0188
Iron-induced relaxation mechanisms in the human substantia nigra: towards quantifying iron load in dopaminergic neurons1Faculty of Physics and Earth Sciences, Leipzig University, Leipzig, Germany, 2Department of Neurophysics, Max Planck Institute for Human Cognitive and Brain Sciences, Leipzig, Germany, 3Paul Flechsig Institute of Brain Research, Leipzig, Germany, 4Felix Bloch Institute for Solid State Physics, Leipzig University, Leipzig, Germany
Synopsis
Pathological iron accumulation in the human brain is a biomarker for neurodegeneration. Several diagnostically promising MR-based methods for in vivo iron quantification were proposed, based on the empirical relationship between R2* and iron concentration. However, these do not account for different chemical forms and cellular distribution of iron. We combined post mortem MRI, advanced quantitative histology and biophysical modeling to develop a generative theory linking obtained iron concentrations to quantitative MR parameters. The impact of nanoscale molecular interaction of water with iron and of iron-rich dopaminergic neurons was quantified in substantia nigra.
Introduction
Pathologic iron accumulation is a biomarker and potential cause of several neurodegenerative diseases. In Parkinson’s disease (PD) iron overload in dopaminergic neurons (DN) may lead to neuronal loss in substantia nigra (SN), especially in nigrosome 1 (N1).1 Several diagnostically promising MR-based methods for in vivo iron quantification were proposed.2,3 These methods mostly utilize R2 and QSM related contrasts and are based on the empirical relationship between iron concentration and MR parameters.4,5
However, this is an oversimplification and the iron-induced MR-contrast in the human brain is poorly understood. The contribution of different chemical forms of iron and different types of iron-containing cells is unknown. Moreover, the role of relaxation mechanisms resulting from either nanoscale molecular interaction of water with iron or from microscopic local field perturbations induced by iron-rich cells has not been quantified yet. Understanding these different relaxation contributions is indispensable in order to develop diagnostic markers with high specificity.
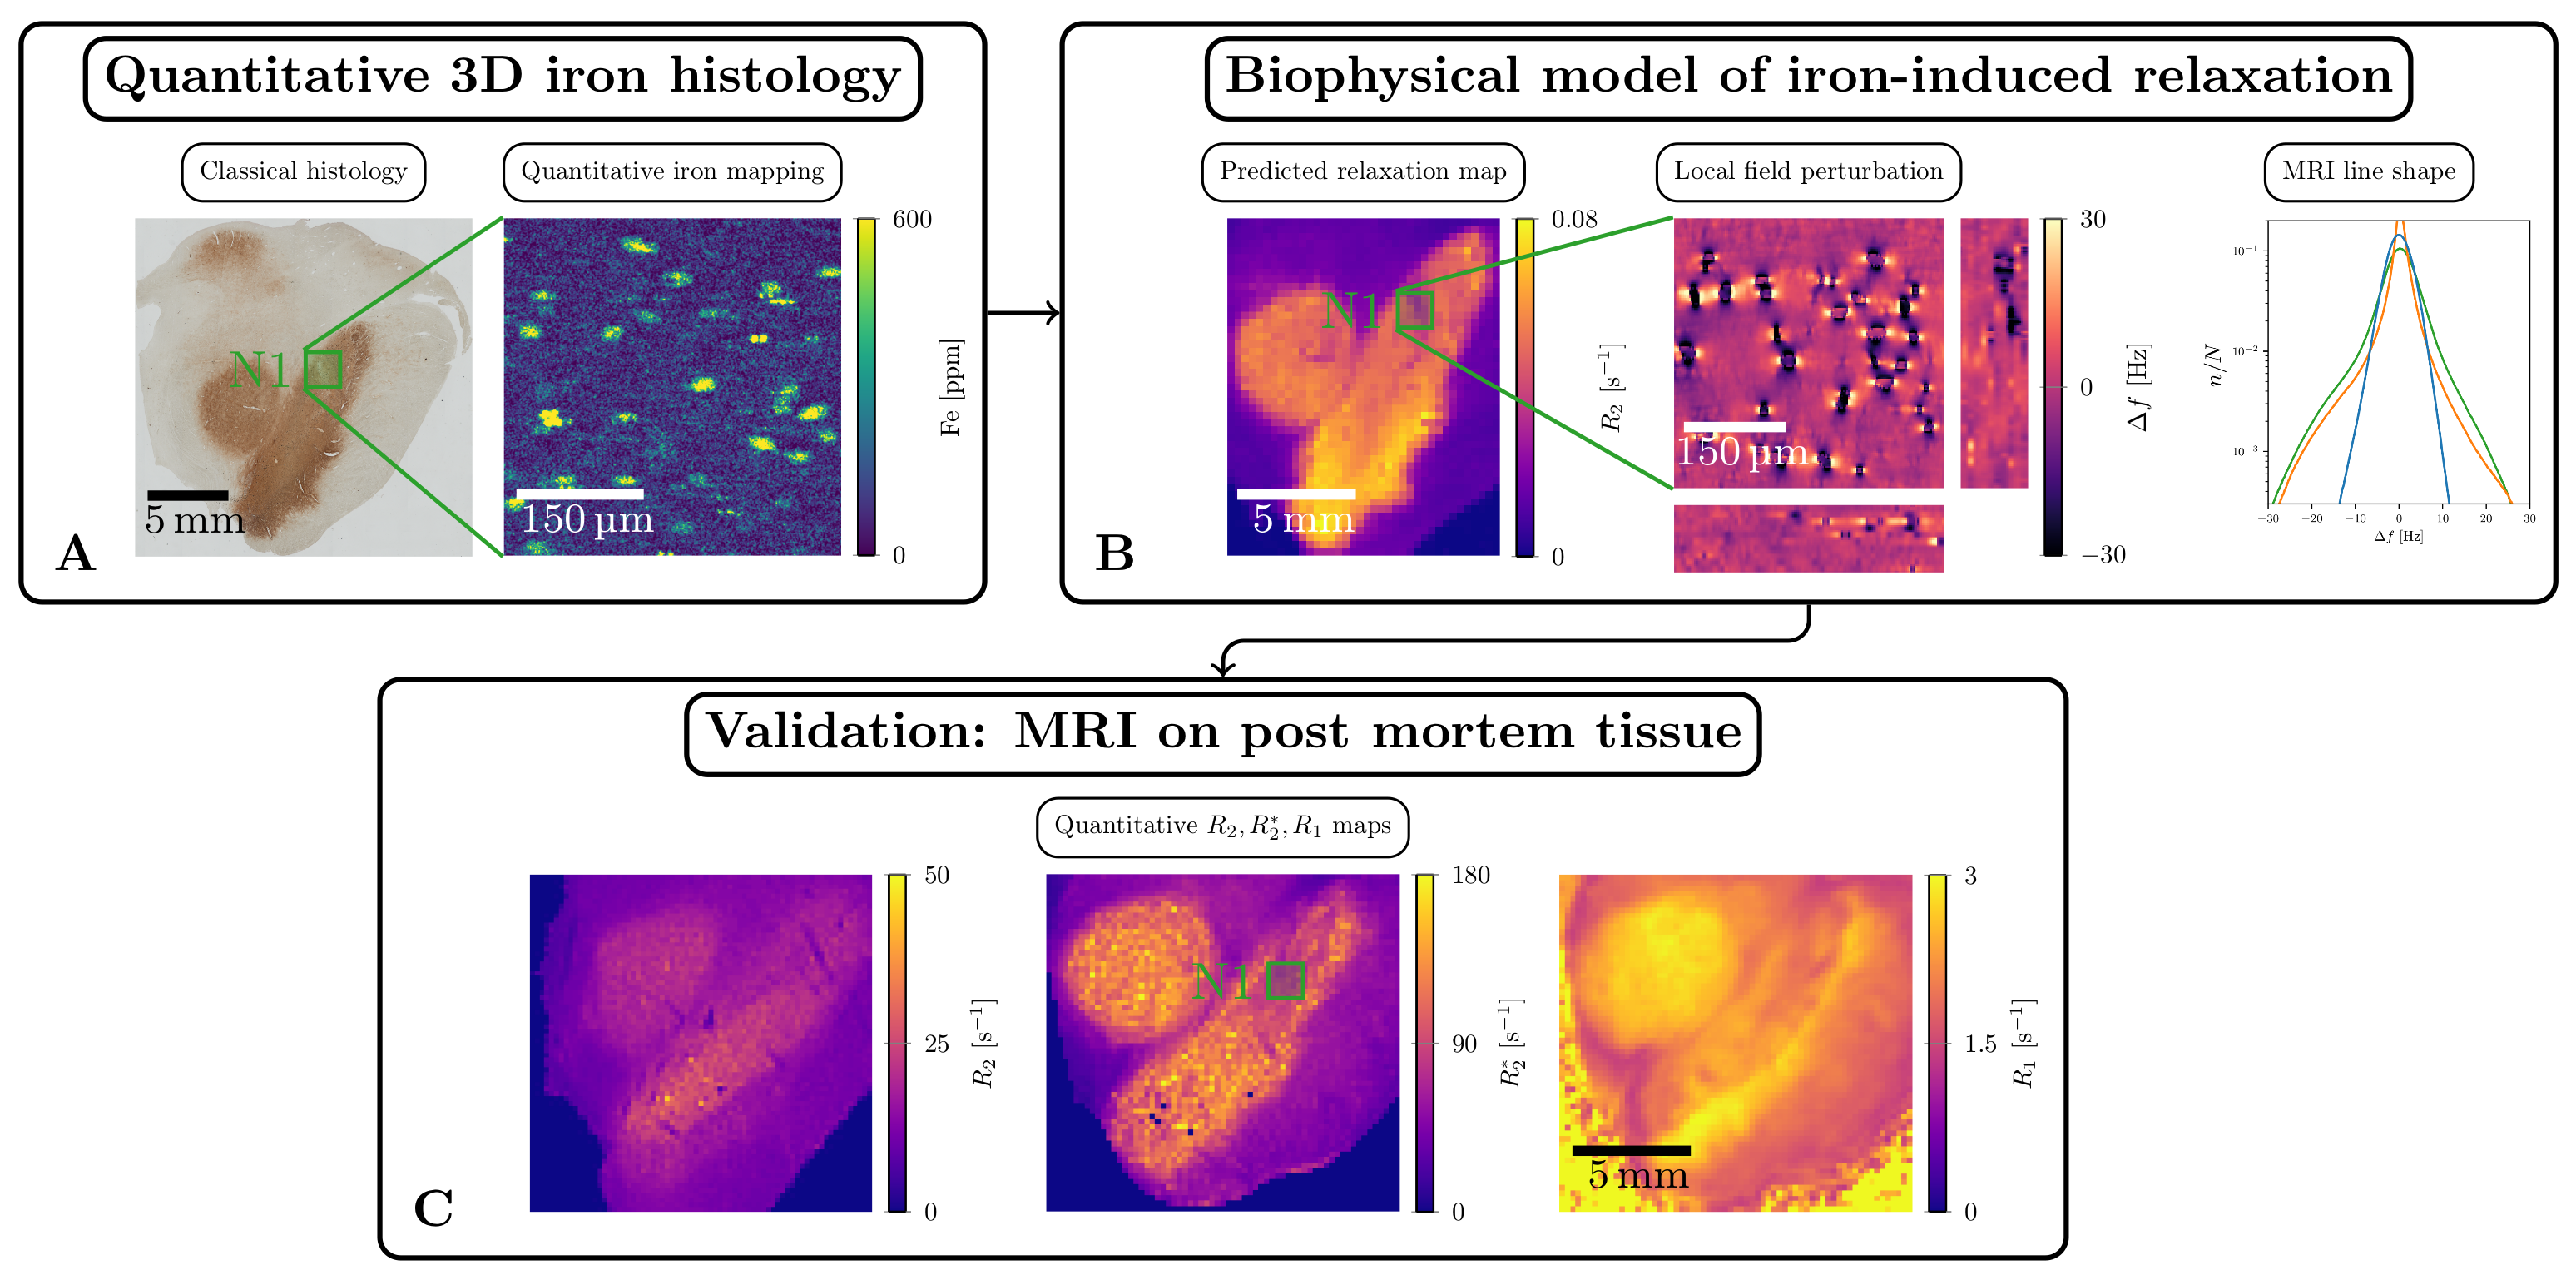
We aim to close this gap by quantifying the contribution to relaxation of several mechanisms in SN. To this end, we combined post mortem MRI, advanced quantitative iron histology and biophysical modeling (Figure 1). We quantified the contribution of the two major chemical forms of iron: iron chelator neuromelanin inside and the storage protein ferritin outside the DN. We developed a generative theory linking histologically obtained cellular iron concentrations with quantitative R2* and R2 maps and compared the theoretical predictions with the experiment.
Methods
Quantitative MRI measurements were performed on two post mortem human brain specimen containing SN at 7 T (Magnetom, Siemens, Erlangen). R2* was estimated from a 3D multi-echo FLASH (isotropic resolution of 0.23 mm, TE1...7=7...46 ms, TR=300 ms), R1 from a MP2RAGE (isotropic resolution 0.3 mm, TI1,2=0.12,0.9 s, TR=3 s) and R2 from a spin echo sequence (0.24 mm, TE1...5=30...75 ms).
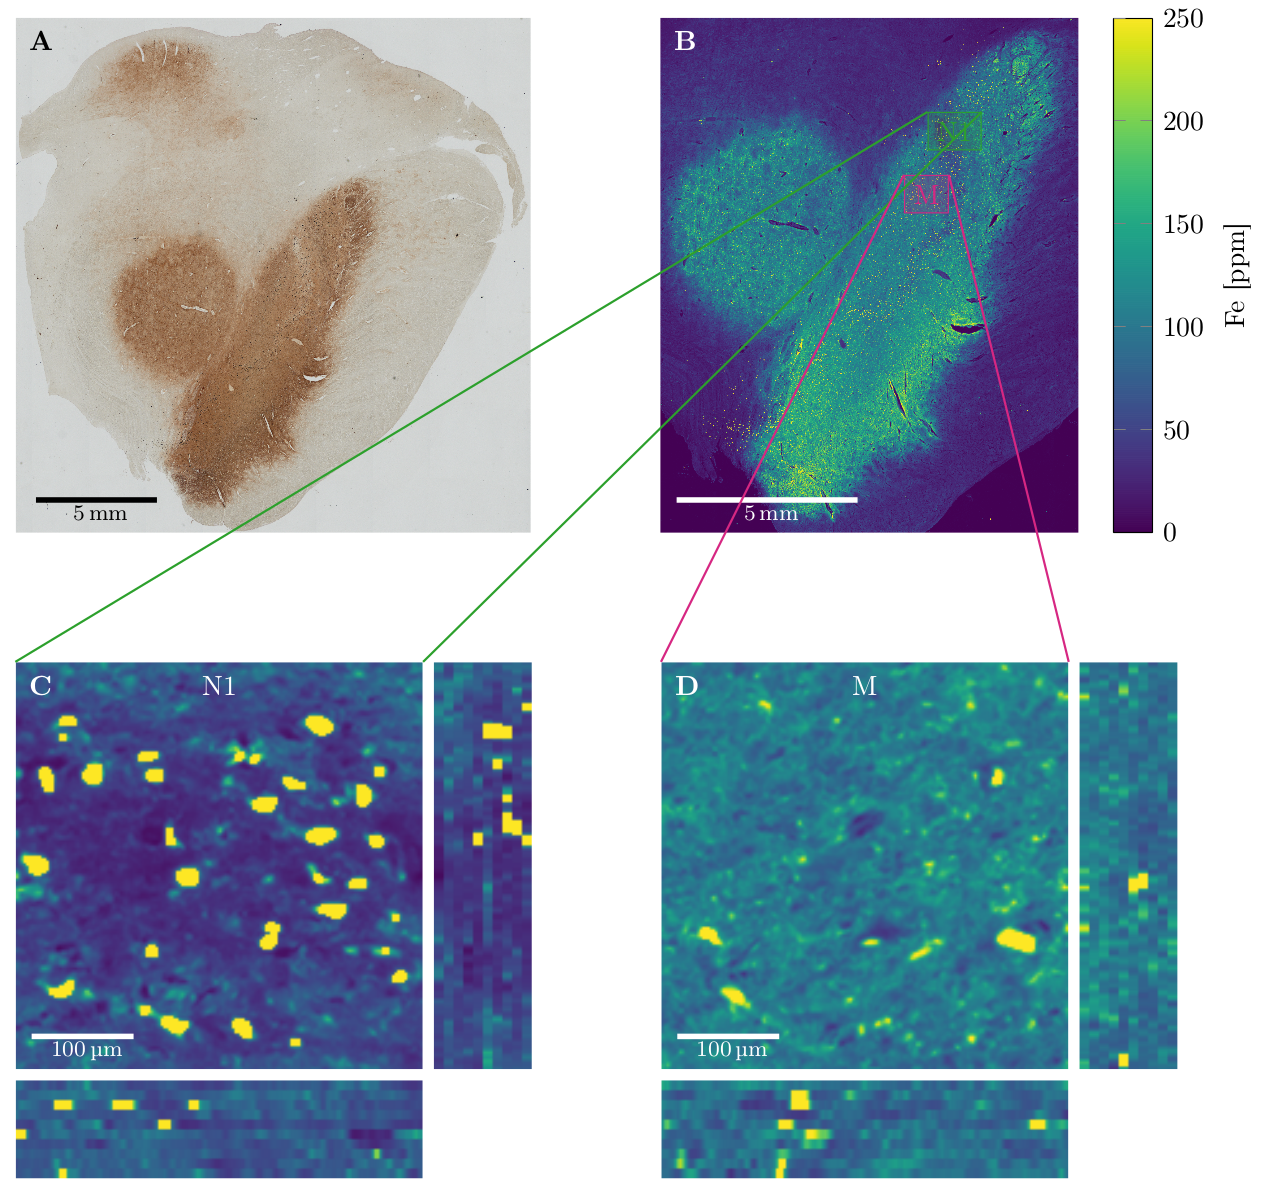
Quantitative microscopic iron maps in 3D were obtained using ten adjacent 10 µm sections stained with Perls' for iron, which were calibrated using quantitative iron maps obtained with Proton Induced X-ray Emission (PIXE). Iron quantification inside and outside the DN was possible using nickel-enhanced immunohistochemistry for neuron detection in the PIXE maps and image segmentation of Perls' stain using a classifier implemented in Fiji.6
Generative biophysical models describing the following relaxation mechanisms were developed using the obtained iron maps.
- The relaxation caused by molecular interaction of water protons with iron bound to ferritin and neuromelanin were estimated using solution relaxivities of both compounds.7,8
- The impact of microscopic cellular distribution of iron to R2* relaxation rate was estimated in a two-step approach:
- The local field perturbation within MRI voxels and resulting MRI signal decays in static dephasing regime were calculated.
- The influence of water diffusion was included using Monte Carlo simulations and motional narrowing theory.9
Relaxation rate maps for each relaxation mechanisms were compared to experimental quantitative MRI maps.
Results
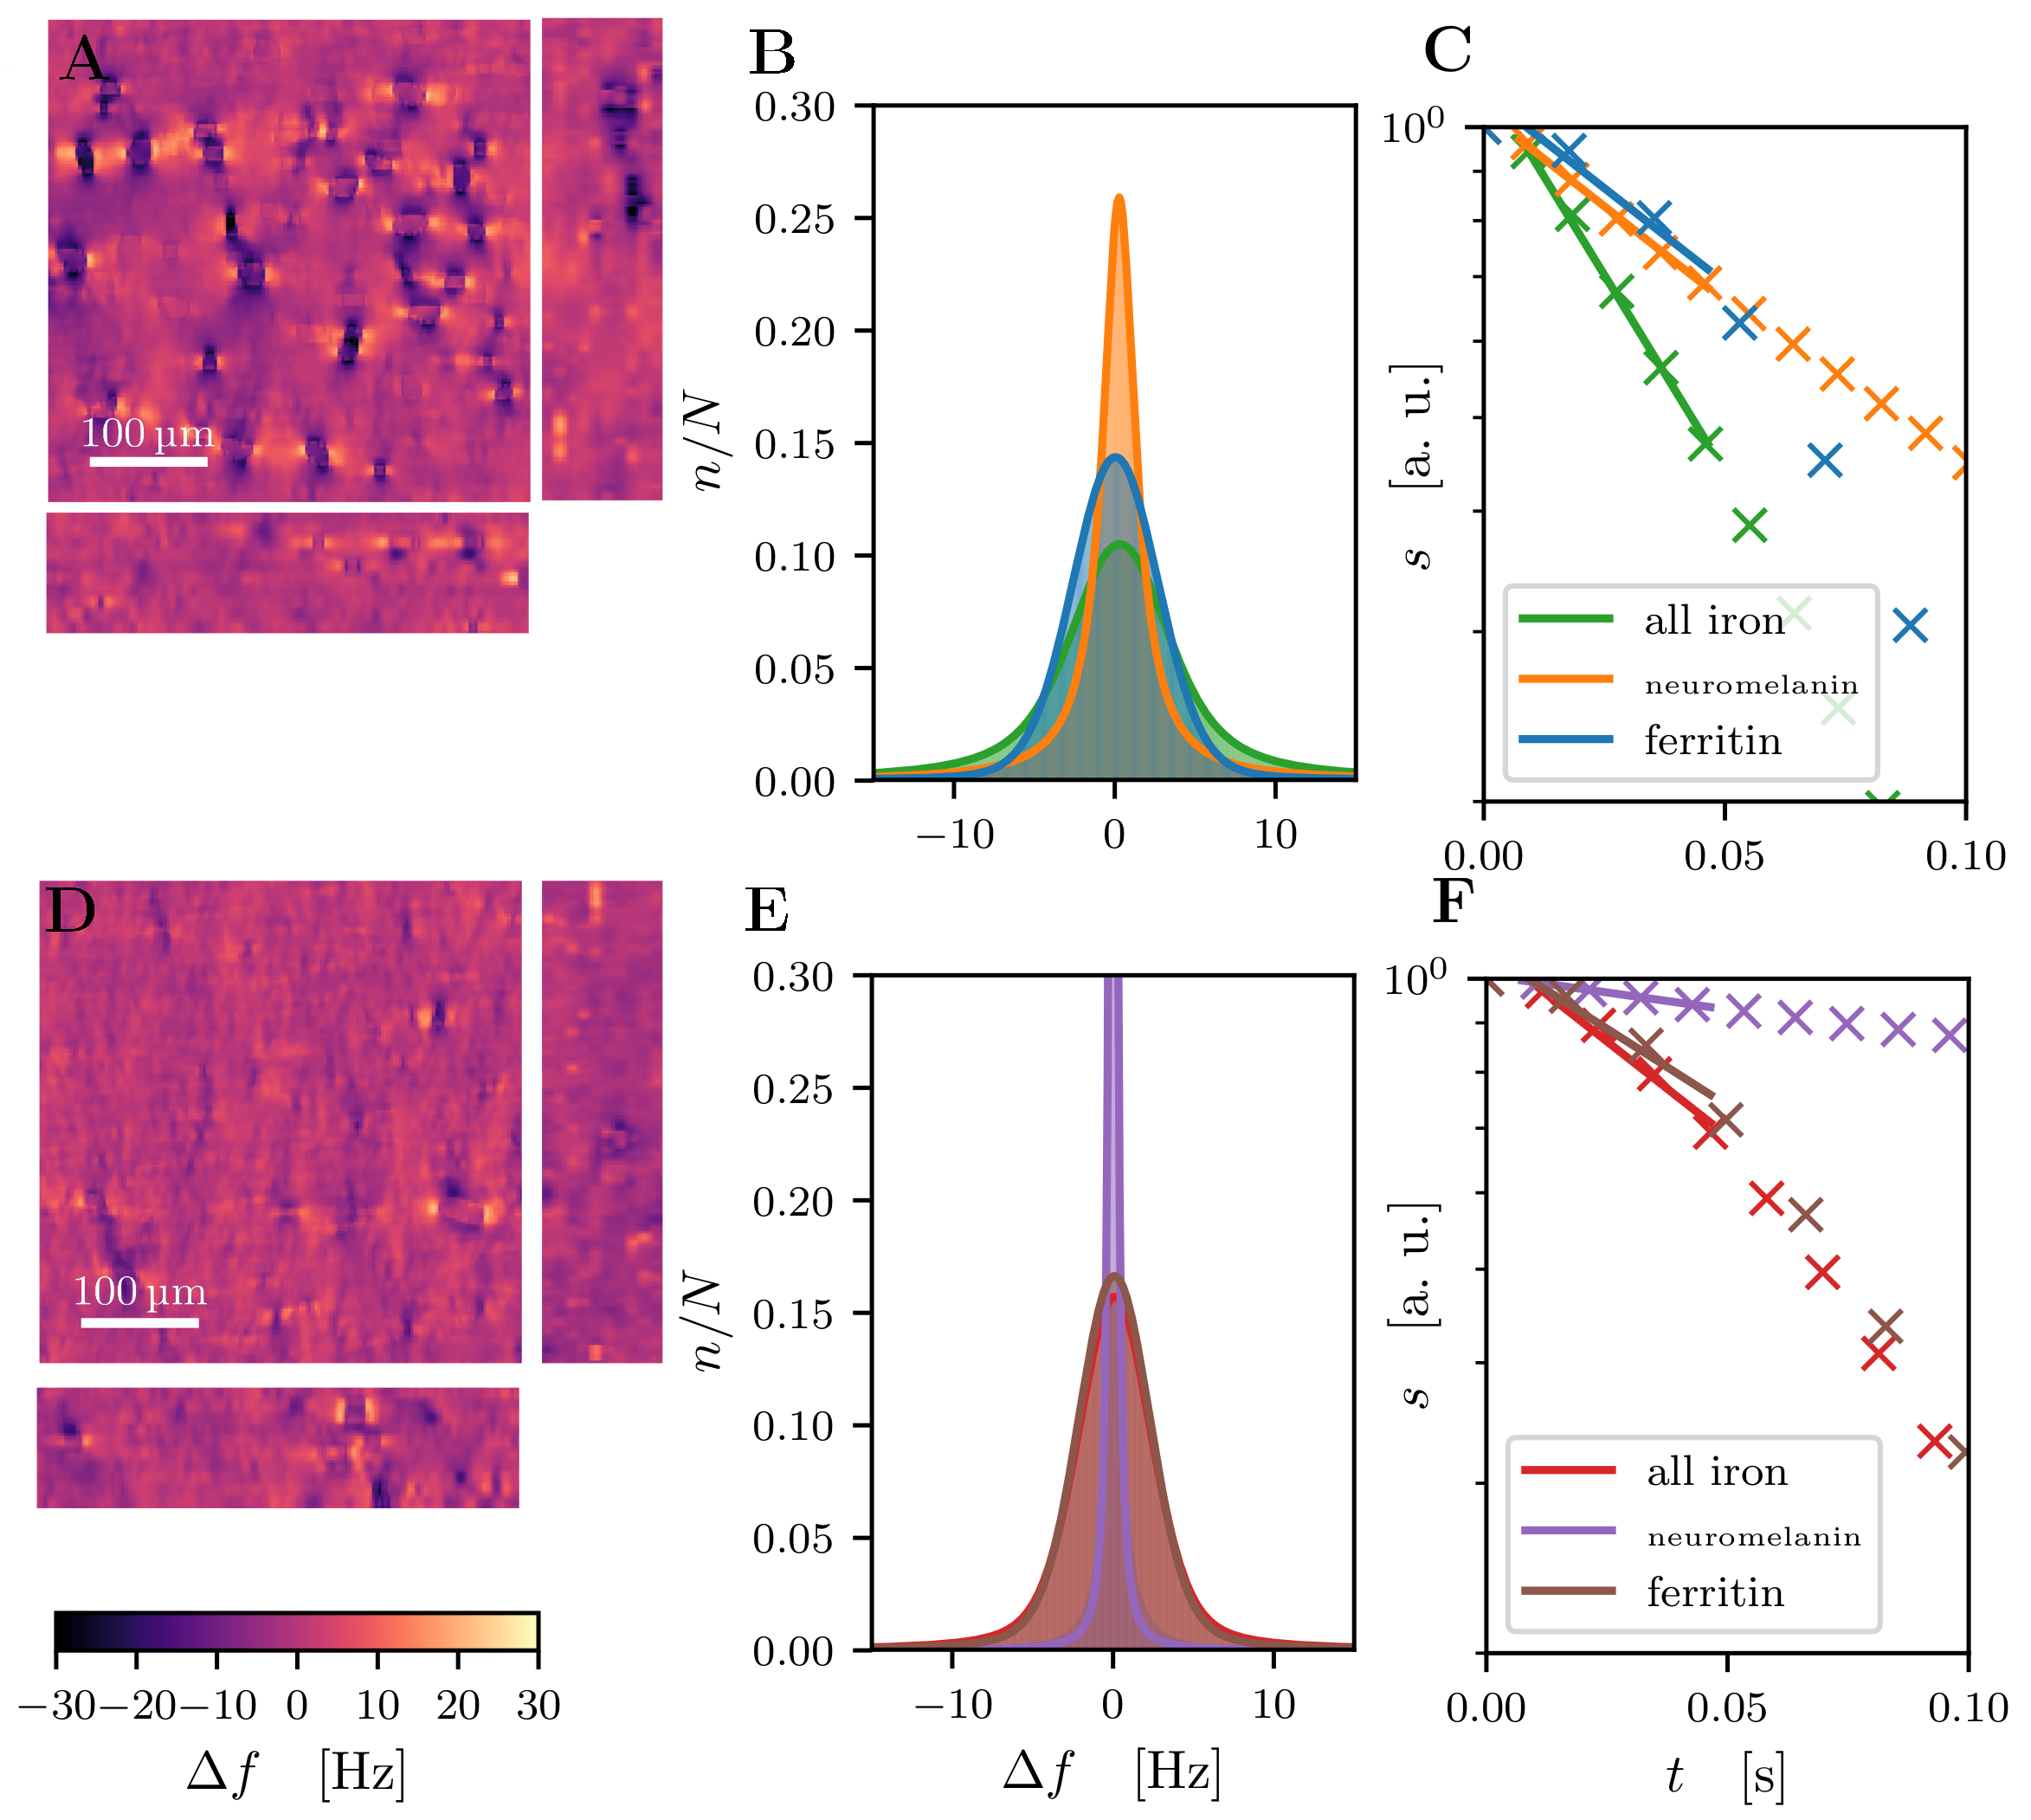
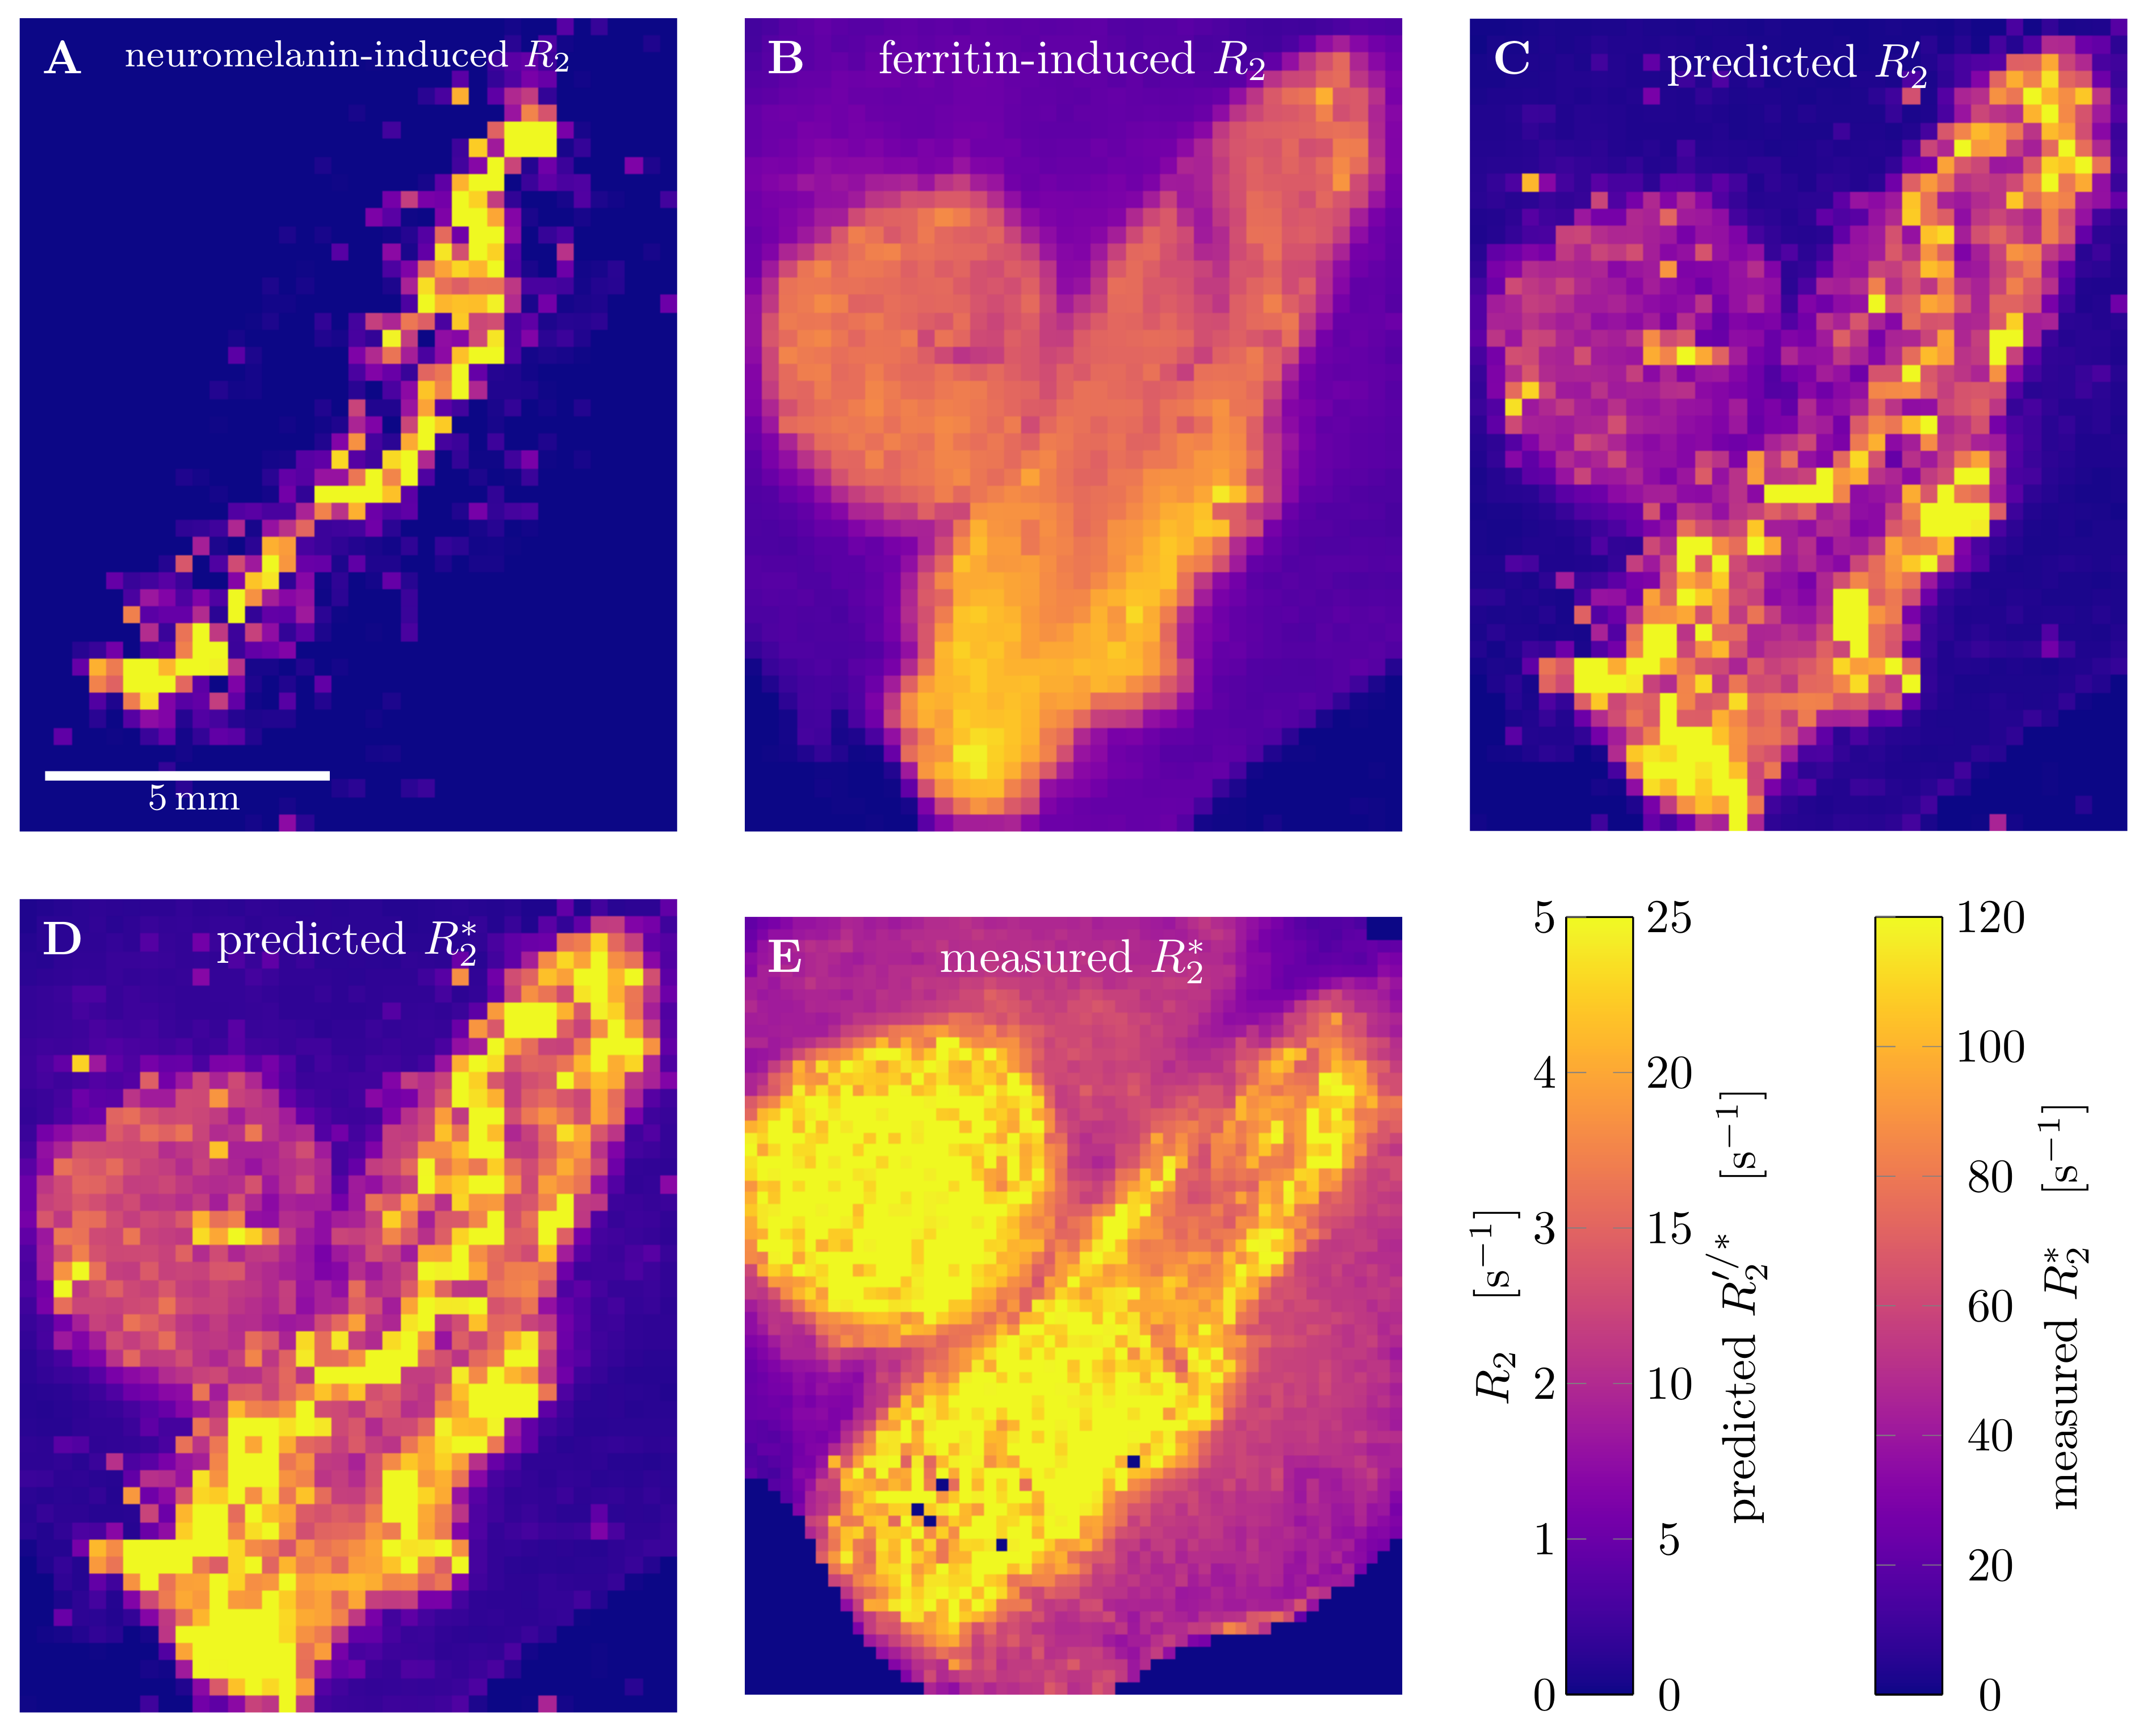
Quantitative 3D iron map of human SN showed inhomogeneous iron distributions at the macroscopic and microscopic scales (Figure 2). Neuromelanin iron was found in the nigrosomes, ferritin iron in the entire SN. N1 showed lower total iron level, but a more inhomogeneous iron distribution. Biophysical modeling of iron-induced MRI contrast demonstrated that the gradient echo signal in SN is a combination of mono- and quadratic exponential decays, with the monoexponential decay originating mostly, but not solely, from iron in DN (Figure 3). Estimated maps of the transverse relaxation rate induced by molecular interaction with neuromelanin (A) and ferritin (B) iron are shown in Figure 4. The upper limit for the iron-induced R2' relaxation rate was derived in the static dephasing regime directly from the quantitative iron maps. According to theoretical estimations the inhomogeneous distribution of iron at the microscopic scale is a dominant relaxation mechanism in SN. However, a quantitative comparison of estimated R2* with experiments shows that theory strongly underestimates R2*. Among studied relaxation mechanisms molecular interaction with ferritin iron demonstrated the highest spatial correlation with experimental maps of R2* (Figure 4B,E).Discussion and Conclusion
We have developed a biophysical model predicting the contributions of different chemical forms of iron and cellular distribution of iron to iron-induced relaxation in human SN. We showed the possibility to disentangle the contributions to R2* relaxation of NM and ferritin iron by a line shape analysis as a first step to DN quantification in vivo. We demonstrated that different relaxation mechanisms result in different patterns of R2* relaxation. Modeling the molecular interactions with ferritin iron showed the highest spatial correlation with measured relaxation rates, but underestimates it by an order of magnitude. This might point towards additional relaxation mechanisms absent in ferritin solutions. Our results provide an important step towards quantitative understanding of iron-induced relaxation mechanisms in human SN.Acknowledgements
The research leading to these results has received funding from the European Research Council under the European Union's Seventh Framework Program (FP7/2007-2013) / ERC grant agreement n° 616905. This project has also received funding from the BMBF (01EW1711A & B) in the framework of ERA-NET NEURON.References
1. F. A. Zucca, J. Segura-Aguilar, E. Ferrari, et al. Interactions of iron, dopamine and neuromelanin pathways in brain aging and Parkinson’s disease. Prog Neurobiol. 2017;155:96–119.
2. M. F. Callaghan, P. Freund, B. Draganski, et al. Widespread age-related differences in the human brain microstructure revealed by quantitative magnetic resonance imaging. Neurobiol. Aging. 2014;35(8):1862–1872.
3. C. Langkammer, N. Krebs, W. Goessler, et al. Quantitative MR Imaging of Brain Iron: A Postmortem Validation Study. Radiology. 2010;257(2):455-462.
4. C. Langkammer, F. Schweser, N. Krebs, et al. Quantitative susceptibility mapping (QSM) as a means to measure brain iron? A post mortem validation study. NeuroImage. 2012;62(3):1593-1599.
5. C. Stüber, M. Morawski, A. Schäfer, et al. Myelin and iron concentration in the human brain: A quantitative study of MRI contrast. NeuroImage. 2014;93(1):95-106.
6. I. Arganda-Carreras, V. Kaynig, C. Rueden et al. Trainable Weka Segmentation: a machine learning tool for microscopy pixel classification. Bioinformatics. 2017;33(15):2424-2426.
7. Y. Gossuin, A. Roch, R. N. Muller, and P. Gillis. Relaxation induced by ferritin and ferritin-like magnetic particles: The role of proton exchange. Magn Reson Med. 200;43(2):237–243.
8. P. Trujillo, P. E. Summers, E. Ferrari, et al. Contrast mechanisms associated with neuromelanin-MRI. Magn Reson Med. 2017;78(5):1790–1800.
9. D. S. Novikov and V. G. Kiselev. Transverse NMR relaxation in magnetically heterogeneous media. J Magn Reson. 2008;195(1):33-39.
Figures