0187
Direct Imaging of Diamagnetic Susceptibility of Beta Amyloid Aggregates in Transgenic Mouse Models of Alzheimer’s Disease using Quantitative Susceptibility Mapping MRI1University of California Berkeley, Berkeley, CA, United States, 2Duke University School of Medicine, Durham, NC, United States
Synopsis
We demonstrated in a phantom that beta amyloid is diamagnetic and can generate strong contrast on susceptibility maps. Based on this, it is further shown both in vivo and ex vivo that magnetic susceptibility mapping could be used to monitor accumulation of amyloid plaques in AD mouse models. Most importantly, the diamagnetic susceptibility map and paramagnetic susceptibility map provided histology-like image contrast for identifying deposition of beta amyloid plaques and iron.
Introduction
It is believed that microscopic changes take place long before morphological changes [1] and the onset of clinical symptoms such as memory loss [2] in Alzheimer’s disease (AD). In addition to probing possible beta amyloid plaques associated microstructural degeneration using diffusion techniques [1, 3], non-invasive methods utilizing endogenous contrast based on R2* have also been assessed for detecting beta amyloid masses and especially accompanied focal iron accumulation [4, 5].
The non-invasive detectability of beta amyloid plaques has been so far largely attributed to focal iron deposition accompanying the plaques in most previous studies [6-14]. Amyloid plaque has been reported to induce no magnetic susceptibility effect [15]. It is believed that the T2* shortening effects of paramagnetic iron are the primary source of contrast between plaques and surrounding tissue [16].
We hypothesized that aggregations of beta amyloid or tau would increase electron density and induce notable changes in local susceptibility. Such a variation itself could be directly discernible, rather than depending on accompanied iron, as a more pronounced diamagnetic susceptibility on quantitative susceptibility mapping (QSM) MR images[17-24].
Methods and Materials
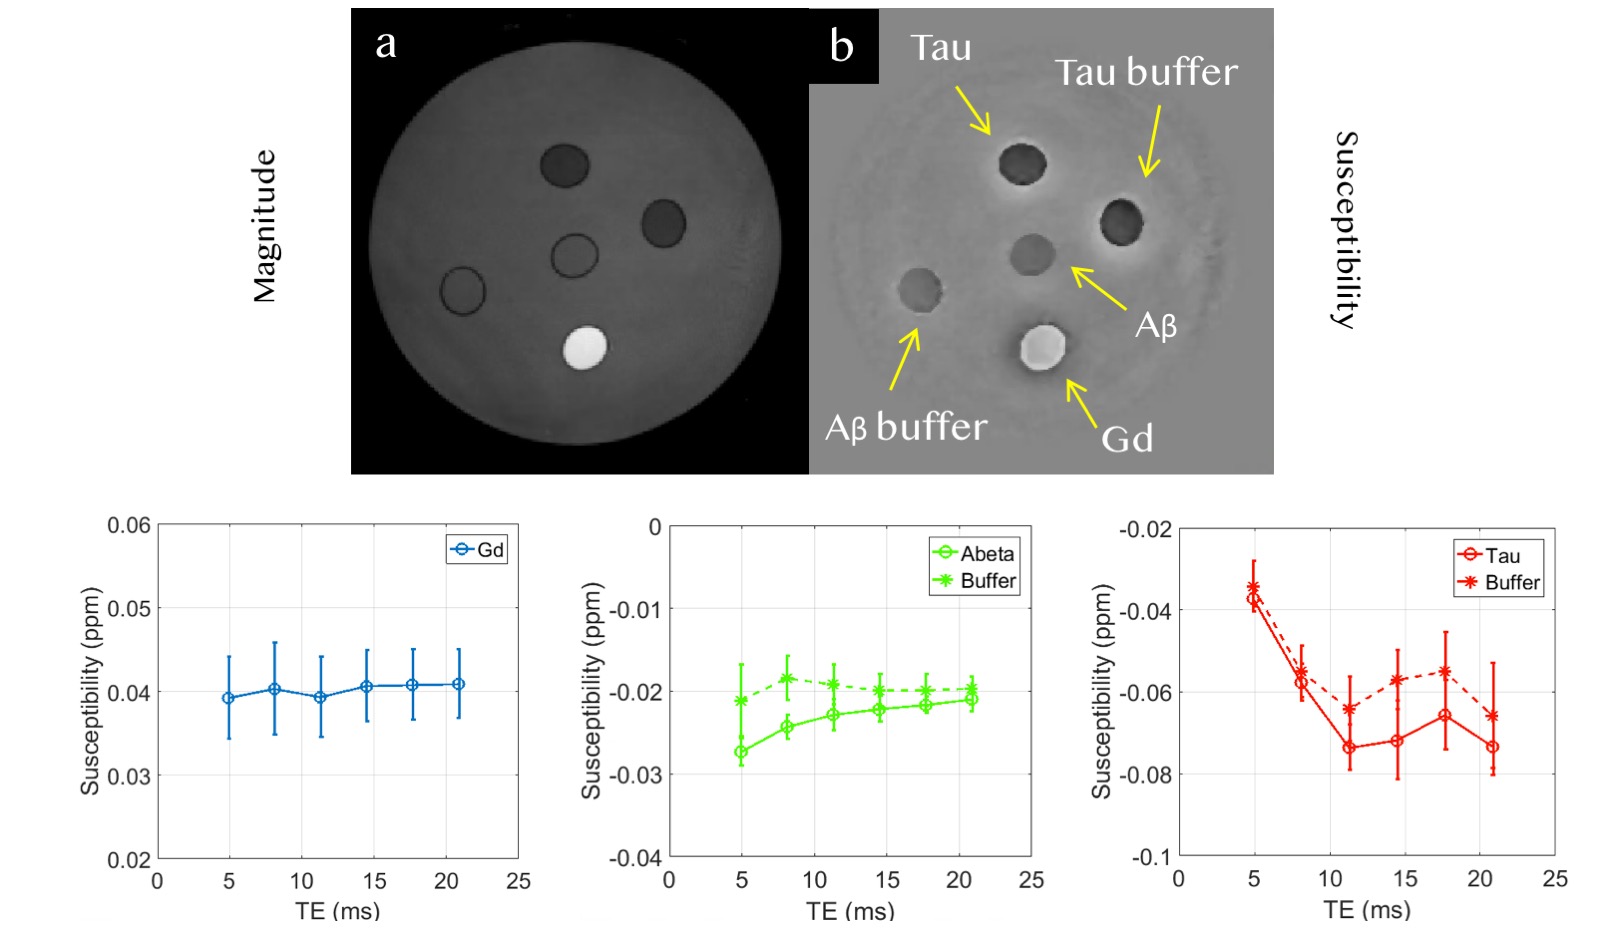
Beta amyloid and tau protein phantom To examine the susceptibility polarities of beta amyloid and tau protein, a cylindrical phantom with five straws was used.
Transgenic mouse models Four pairs of transgenic mice with abnormal beta amyloid aggregation (Tg-SwDI) and wild type were acquired from the Jackson Laboratory.
MR imaging protocols Phantom imaging was performed on a 7.0T scanner. Mouse models were imaged in vivo seven times longitudinally from 70 days to 538 days after birth on a 7T Bruker scanner. Ex vivo imaging of post mortem mouse brains with injected Gd (50 mM) was performed on a scanner with 9.4 T Oxford magnet.
Image processing for quantitative susceptibility mapping The local susceptibility value was derived using an LSQR algorithm [25]. All algorithms were implemented in Matlab (Mathworks, Natick, MA, USA) using STI Suite.
Histological staining for beta amyloid and iron Tissue sections were then co-stained for iron and beta amyloid using diaminobenzide (DAB) enhanced Prussian blue reaction followed by an aqueous thioflavin-S stain [26].
Results
Susceptibility of beta amyloid phantom The susceptibility of gadolinium stays around 0.0393 ppm (Figure 1). The susceptibility of beta amyloid solution has a mean value of -0.0237 ppm. The susceptibility of amyloid buffer has a mean value of -0.0189 ppm (Figure 1).
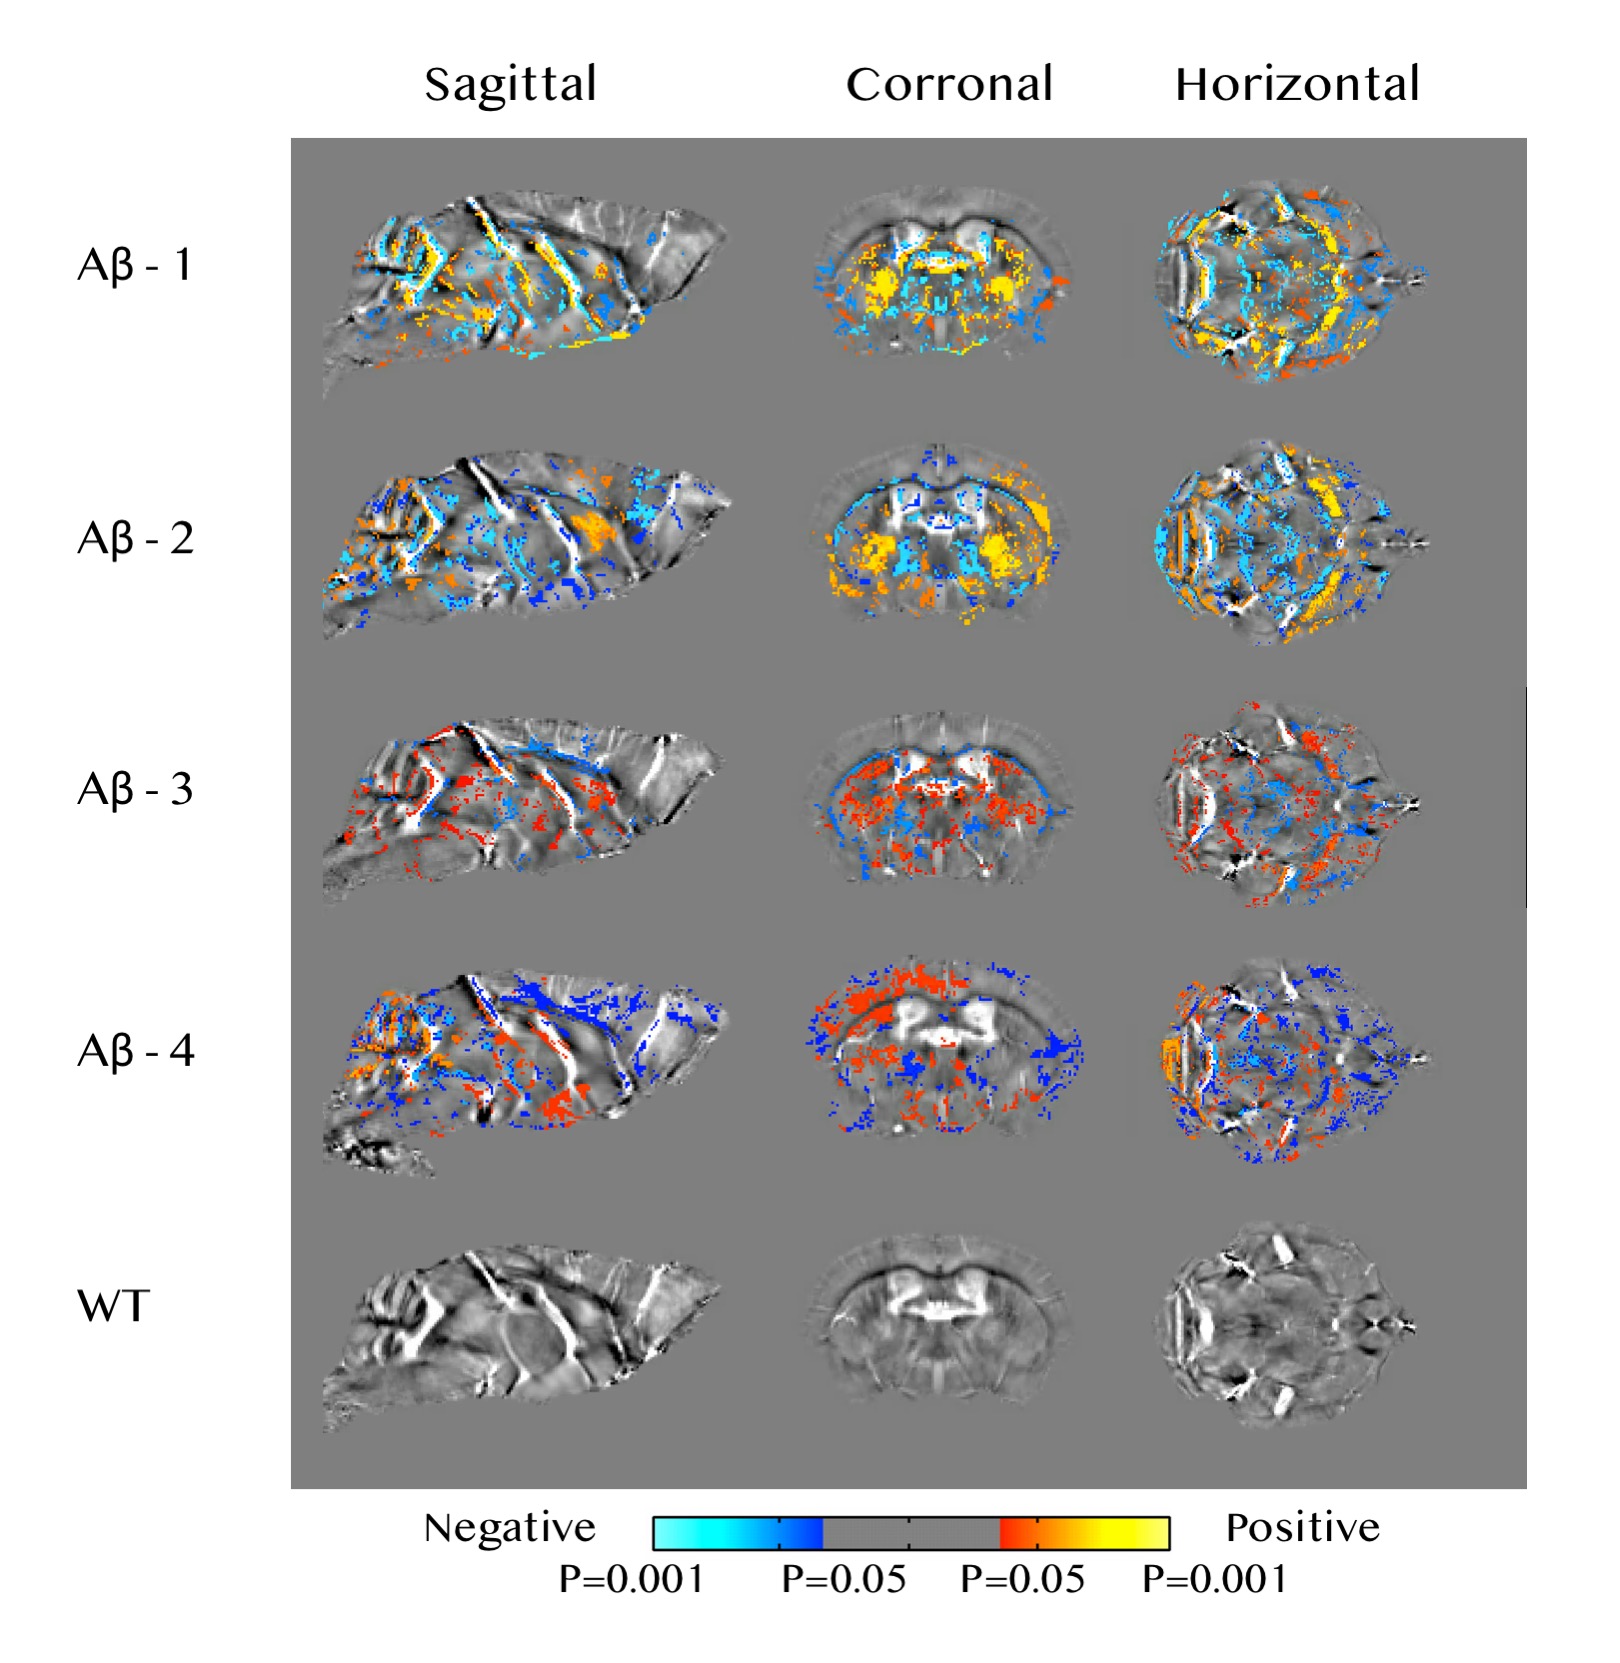
Age-related susceptibility change in Aβ mice Significant positive correlations with age were found in regions including the caudate putamen, hypothalamus, substantia innominata, as well as somatosensory areas of the cerebral cortex (Figure 2). Negative correlations with age were observed mainly in the forebrain cortex, midbrain, cerebellar cortex and thalamus as well as white matter fiber tracts such as the corpus callosum, fornix and anterior commissure (Figure 2). No significant correlation was observed in the wild type mice.
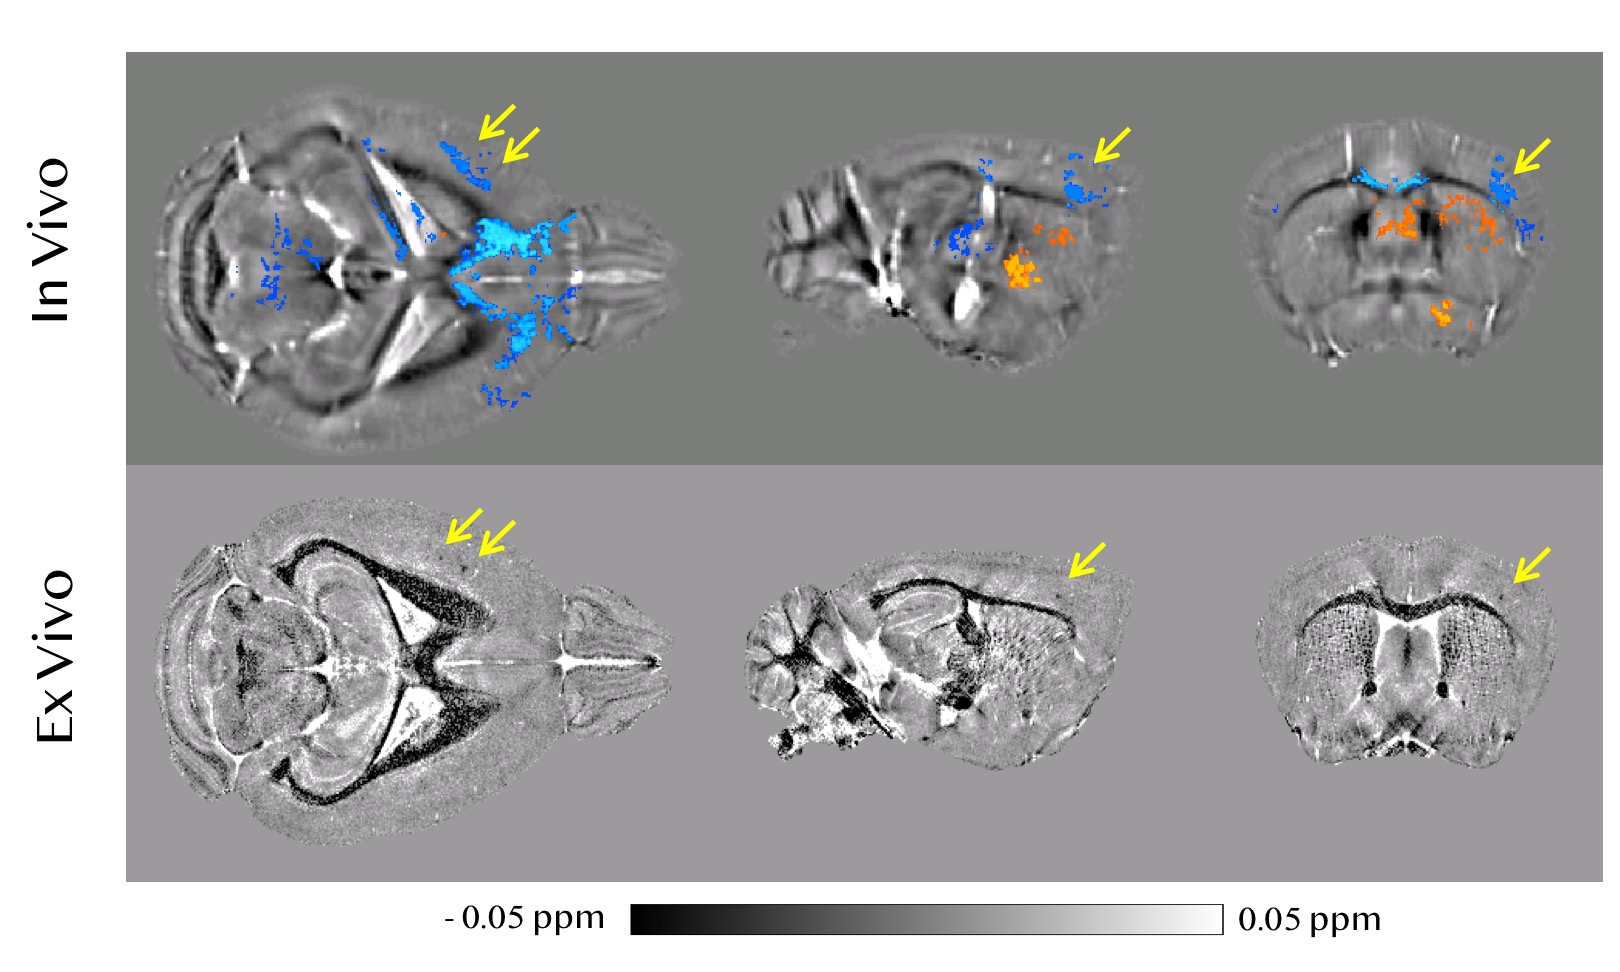
Comparison between in vivo longitudinal correlation and ex vivo high resolution susceptibility map As shown in Figure 3, in a Aβ mouse brain, a cluster of voxels within the primary somatosensory cortex can be identified that exhibited a significant and negative correlation between susceptibility value and age. At the same location on the ex vivo high-resolution susceptibility map, we found several focal spots exhibiting strong diamagnetism. The diamagnetic spots showed a nearly perfect spatial correspondence to the position of the cluster that exhibited negative correlation with age.
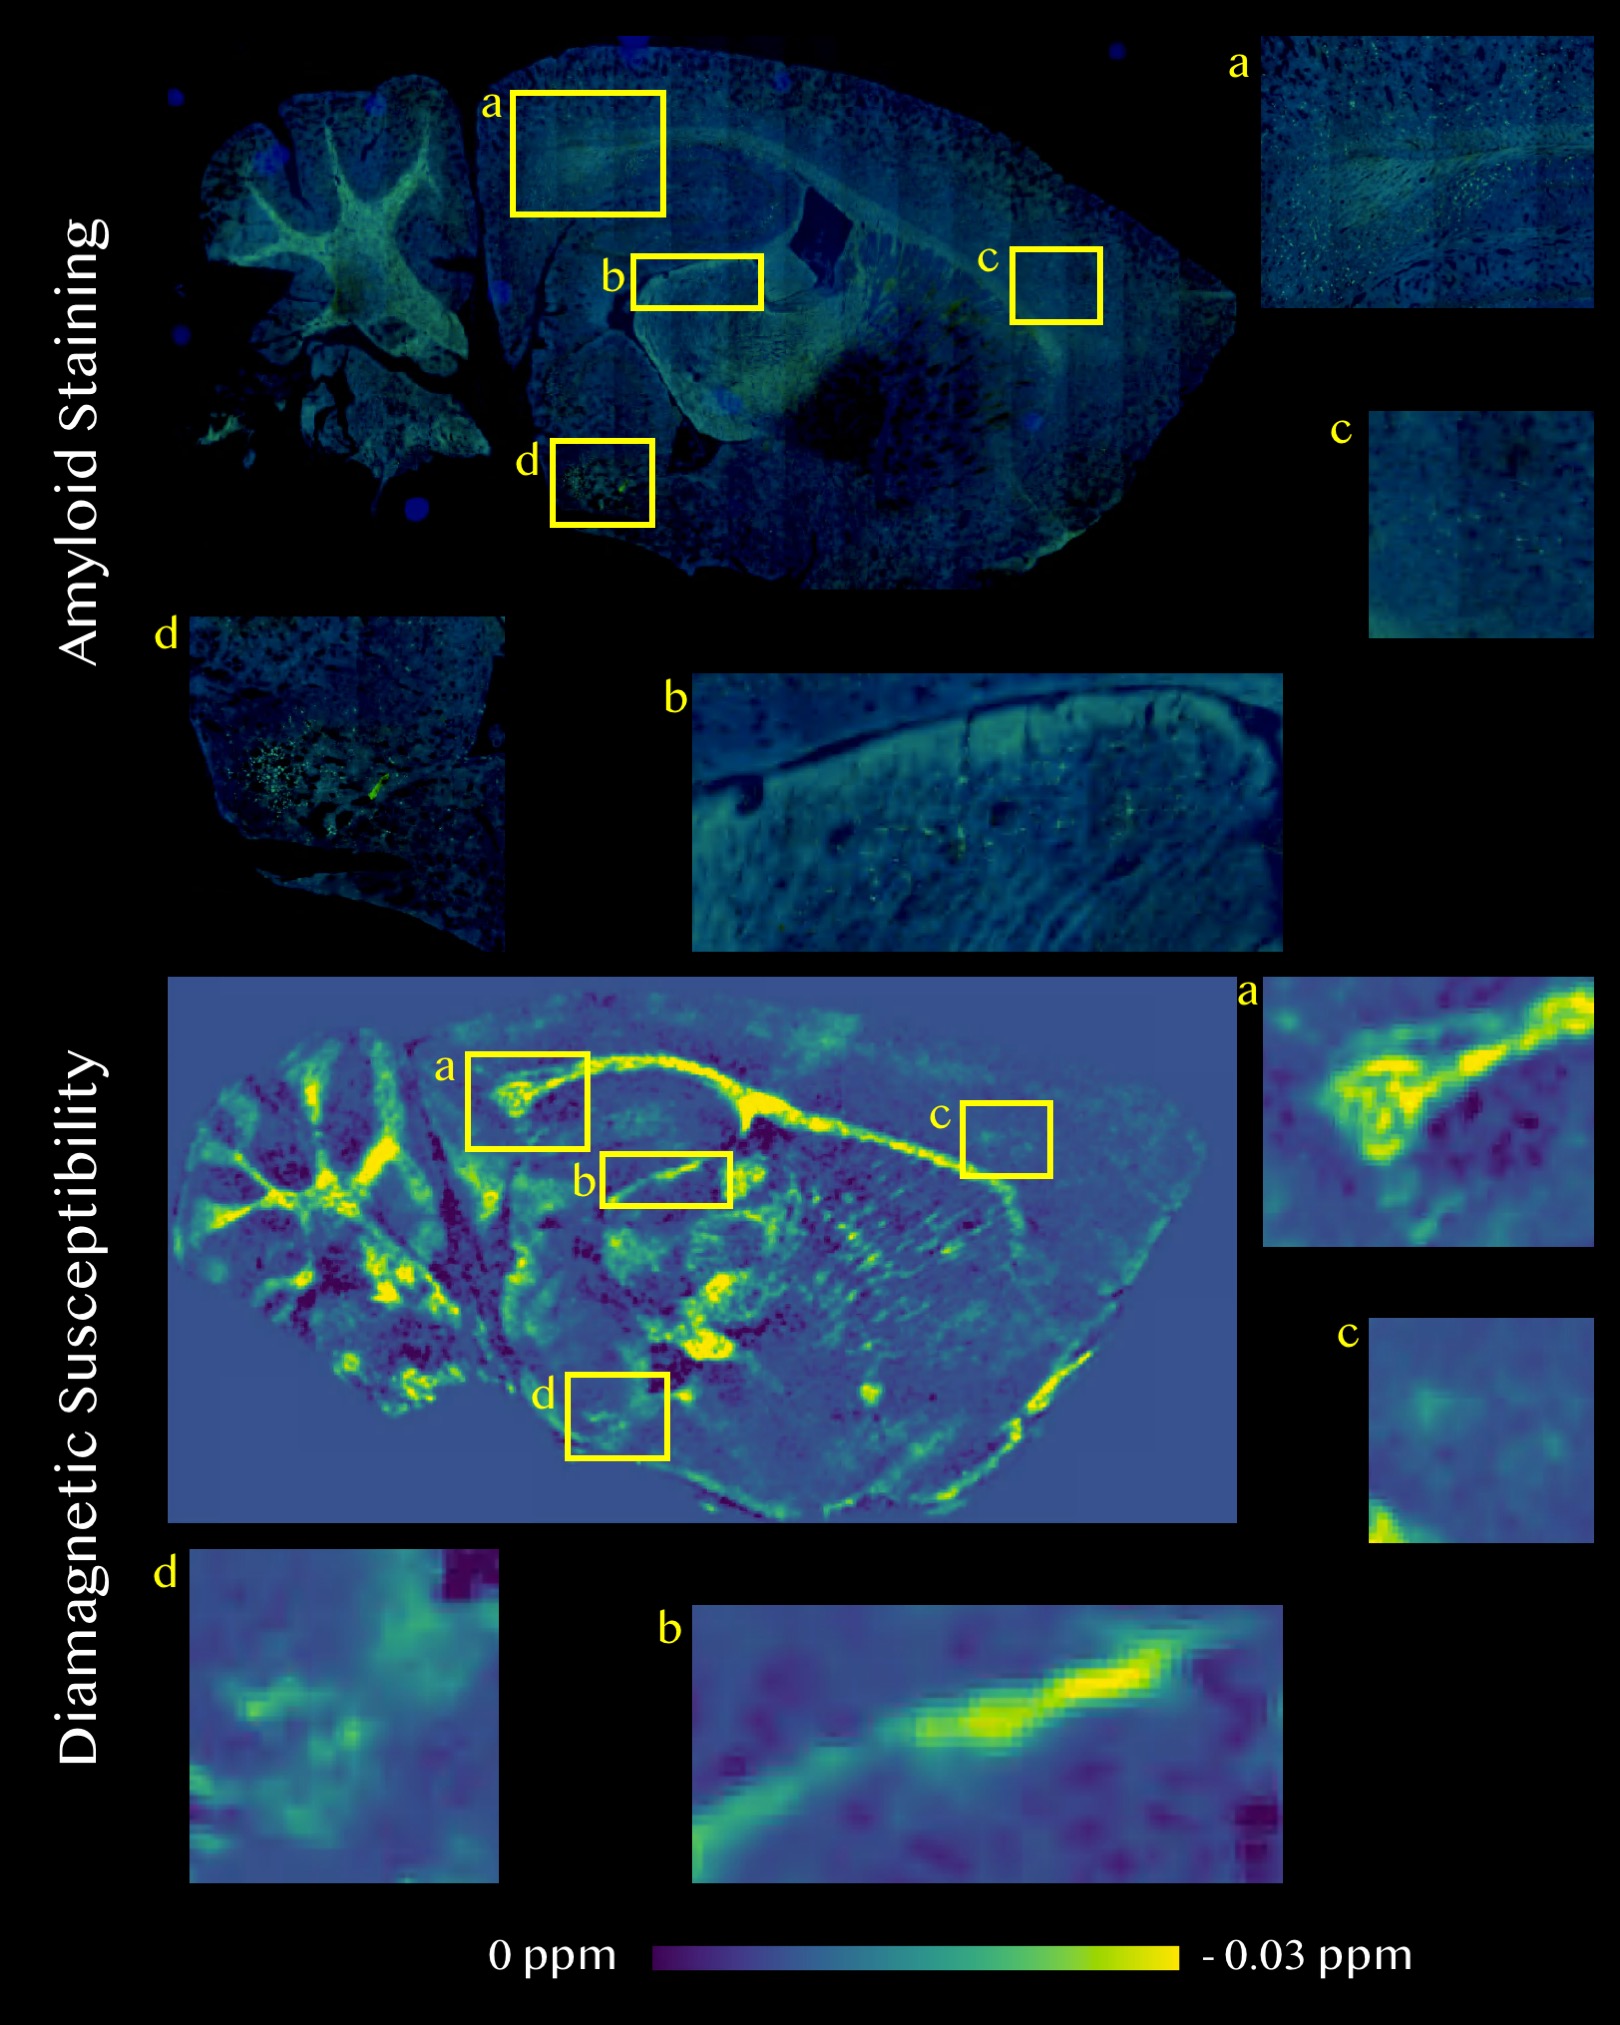
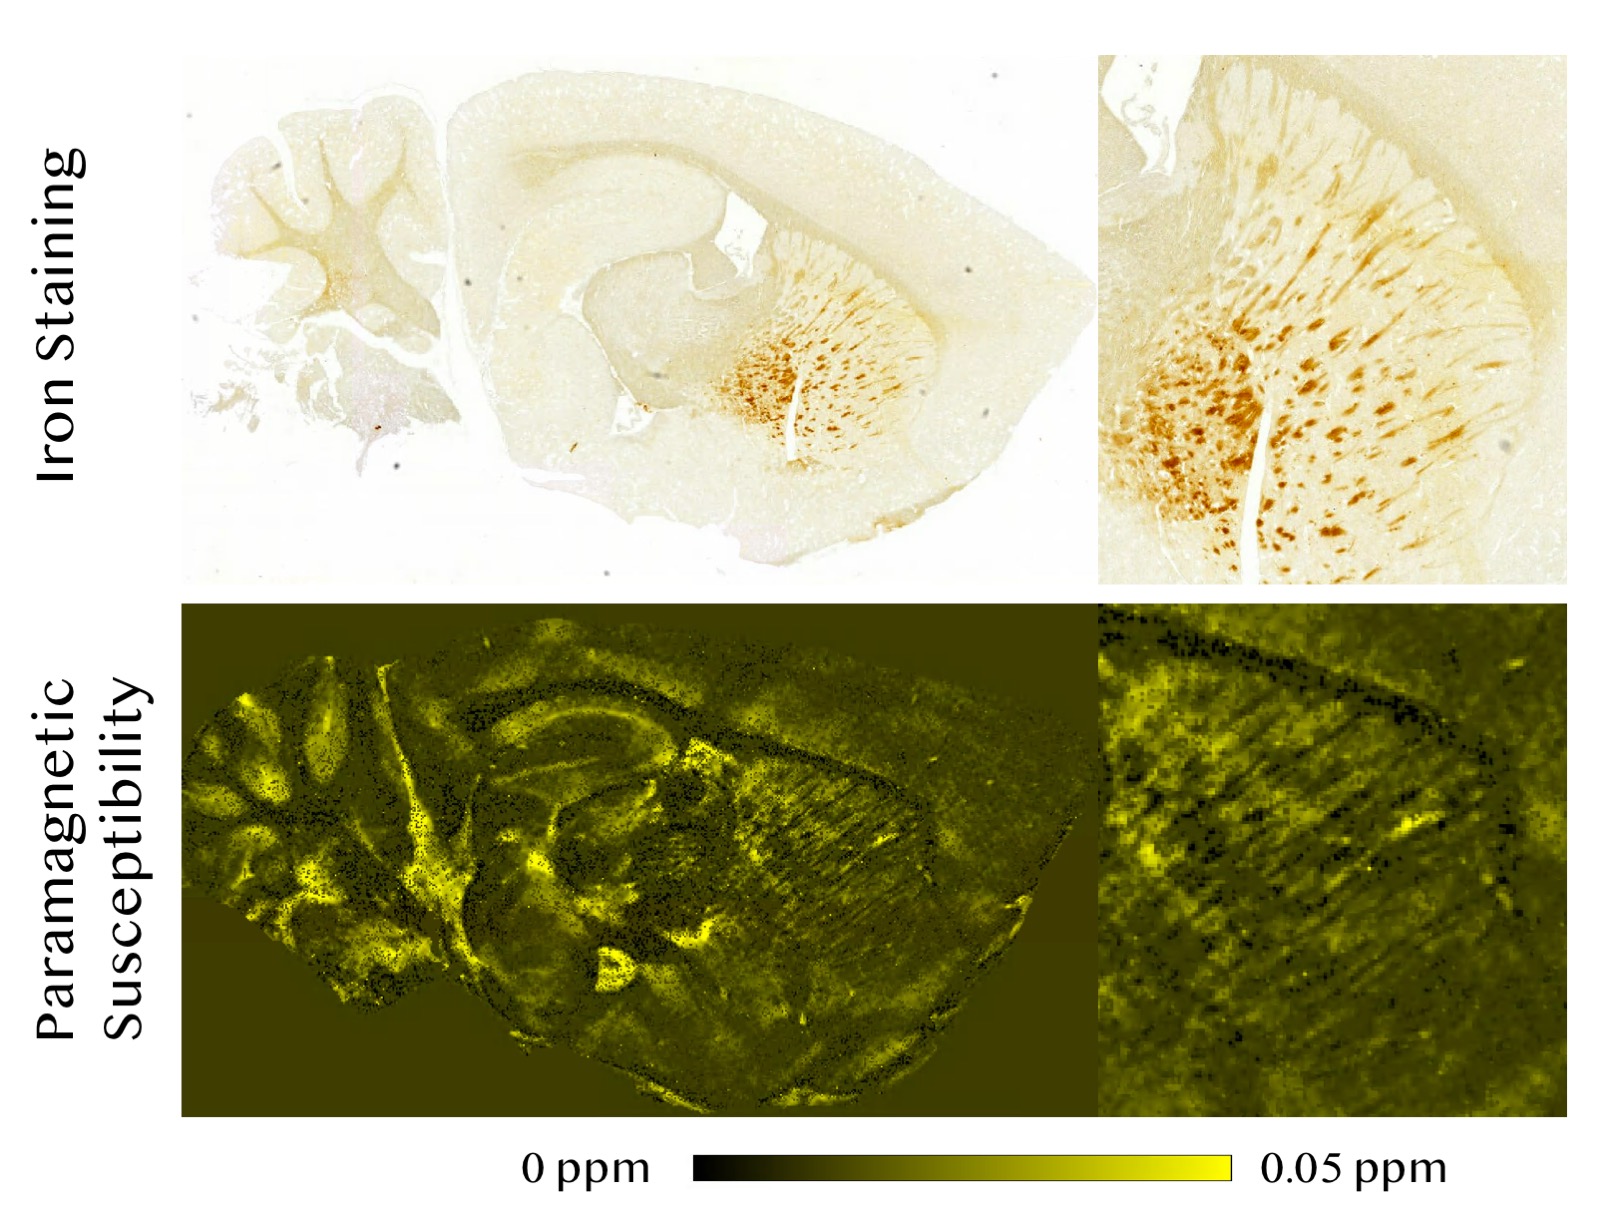
Comparison between diamagnetic and paramagnetic susceptibility maps and histological stains Near the alveus and splenium of corpus callosum surrounding hippocampus (a), diamagnetic components corresponded well with beta amyloid plaques in thioflavin-S stain (Figure 4). Similar strong spatial correspondences between focal diamagnetic components captured on diamagnetic susceptibility map and beta amyloid plaques on thioflavin-S stain were also noted in the thalamus near brachium of the superior colliculus (b), forebrain cortex near genu of the corpus callosum (c), and cortical amygdalar area (d). In Prussian blue stain for iron, notable excessive iron deposition can be visualized throughout the caudate putamen area. Correspondingly structures exhibiting strong paramagnetism were also identifiable on paramagnetic susceptibility map (Figure 5).
Conclusion
We demonstrated in a phantom that beta amyloid is diamagnetic and can generate strong contrast on susceptibility maps. Based on this, it is further shown both in vivo and ex vivo that magnetic susceptibility mapping could be used to monitor accumulation of amyloid plaques in AD mouse models. Most importantly, the diamagnetic susceptibility map and paramagnetic susceptibility map provided histology-like image contrast for identifying deposition of beta amyloid plaques and iron.Acknowledgements
No acknowledgement found.References
1. Gong, N.J., et al., Differential microstructural and morphological abnormalities in mild cognitive impairment and Alzheimer's disease: Evidence from cortical and deep gray matter. Hum Brain Mapp, 2017.
2. Rose, S.E., A.L. Janke, and J.B. Chalk, Gray and white matter changes in Alzheimer's disease: a diffusion tensor imaging study. J Magn Reson Imaging, 2008. 27(1): p. 20-6.
3. Gong, N.J., et al., Correlations between microstructural alterations and severity of cognitive deficiency in Alzheimer's disease and mild cognitive impairment: a diffusional kurtosis imaging study. Magn Reson Imaging, 2013. 31(5): p. 688-94.
4. Meadowcroft, M.D., et al., MRI and Histological Analysis of Beta-Amyloid Plaques in Both Human Alzheimer's Disease and APP/PS1 Transgenic Mice. Journal of Magnetic Resonance Imaging, 2009. 29(5): p. 997-1007.
5. Jack, C.R., Jr., et al., In vivo magnetic resonance microimaging of individual amyloid plaques in Alzheimer's transgenic mice. J Neurosci, 2005. 25(43): p. 10041-8.
6. Dhenain, M., et al., Senile plaques do not induce susceptibility effects in T-2*-weighted MR microscopic images. Nmr in Biomedicine, 2002. 15(3): p. 197-203.
7. Jack, C.R., et al., In vivo visualization of Alzheimer's amyloid plaques by magnetic resonance imaging in transgenic mice without a contrast agent. Magnetic Resonance in Medicine, 2004. 52(6): p. 1263-1271.
8. Falangola, M.F., et al., Histological co-localization of iron in A beta plaques of PS/APP transgenic mice. Neurochemical Research, 2005. 30(2): p. 201-205.
9. Wengenack, T.M., et al., Regional differences in MRI detection of amyloid plaques in AD transgenic mouse brain. Neuroimage, 2011. 54(1): p. 113-122.
10. Chamberlain, R., et al., Comparison of amyloid plaque contrast generated by T2-weighted, T2*-weighted, and susceptibility-weighted imaging methods in transgenic mouse models of Alzheimer's disease. Magn Reson Med, 2009. 61(5): p. 1158-64.
11. Vanhoutte, G., et al., Noninvasive in vivo MRI detection of neuritic plaques associated with iron in APP[V717I] transgenic mice, a model for Alzheimer's disease. Magn Reson Med, 2005. 53(3): p. 607-13.
12. Borthakur, A., et al., In vivo measurement of plaque burden in a mouse model of Alzheimer's disease. J Magn Reson Imaging, 2006. 24(5): p. 1011-7.
13. El Tannir El Tayara, N., et al., Age-related evolution of amyloid burden, iron load, and MR relaxation times in a transgenic mouse model of Alzheimer's disease. Neurobiol Dis, 2006. 22(1): p. 199-208.
14. El Tayara Nel, T., et al., Transverse relaxation time reflects brain amyloidosis in young APP/PS1 transgenic mice. Magn Reson Med, 2007. 58(1): p. 179-84.
15. Dhenain, M., et al., Senile plaques do not induce susceptibility effects in T2*-weighted MR microscopic images. NMR Biomed, 2002. 15(3): p. 197-203.
16. Jack, C.R., Jr., et al., In vivo visualization of Alzheimer's amyloid plaques by magnetic resonance imaging in transgenic mice without a contrast agent. Magn Reson Med, 2004. 52(6): p. 1263-71.
17. Liu, C., et al., Susceptibility-weighted imaging and quantitative susceptibility mapping in the brain. J Magn Reson Imaging, 2015. 42(1): p. 23-41. 18. Liu, C., et al., Quantitative Susceptibility Mapping: Contrast Mechanisms and Clinical Applications. Tomography, 2015. 1(1): p. 3-17.
19. Deistung, A., F. Schweser, and J.R. Reichenbach, Overview of quantitative susceptibility mapping. NMR Biomed, 2017. 30(4).
20. Wang, Y. and T. Liu, Quantitative susceptibility mapping (QSM): Decoding MRI data for a tissue magnetic biomarker. Magn Reson Med, 2015. 73(1): p. 82-101.
21. Schweser, F., A. Deistung, and J.R. Reichenbach, Foundations of MRI phase imaging and processing for Quantitative Susceptibility Mapping (QSM). Z Med Phys, 2016. 26(1): p. 6-34.
22. Haacke, E.M., et al., Quantitative susceptibility mapping: current status and future directions. Magn Reson Imaging, 2015. 33(1): p. 1-25.
23. Gong, N.J., et al., Hemisphere, gender and age-related effects on iron deposition in deep gray matter revealed by quantitative susceptibility mapping. Nmr in Biomedicine, 2015. 28(10): p. 1267-1274.
24. Li, W., et al., Differential developmental trajectories of magnetic susceptibility in human brain gray and white matter over the lifespan. Hum Brain Mapp, 2014. 35(6): p. 2698-713.
25. Li, W., B. Wu, and C.L. Liu, Quantitative susceptibility mapping of human brain reflects spatial variation in tissue composition. Neuroimage, 2011. 55(4): p. 1645-1656.
26. Meadowcroft, M.D., et al., The effect of iron in MRI and transverse relaxation of amyloid-beta plaques in Alzheimer's disease. Nmr in Biomedicine, 2015. 28(3): p. 297-305.
Figures