0183
Periventricular cerebral blood flow: A biomarker for small vessel ischemia1Department of Radiology, University of Pennsylvania, Philadelphia, PA, United States, 2Department of Neurology, University of Pennsylvania, Philadelphia, PA, United States, 3Siemens Healthineers, Madrid, Spain
Synopsis
We evaluated periventricular white matter (PVWM) cerebral blood flow (CBF) as a mechanistically specific biomarker for small vessel ischemia and demonstrated the feasibility of its measurement using state-of-the-art arterial spin labeling. We constructed the PVWM region of interest and demonstrated that mean CBF in PVWM had higher correlation with lesion volumes than global, grey matter, or white matter CBF, even after correction for global CBF, age, and sex. PVWM CBF also showed higher correlation with Trail A and B processing speed than CBF in other regions, or lesion volumes.
Introduction
White matter lesions (WMLs) detected as hyperintensities on T2-weighted magnetic resonance imaging (MRI), especially in the periventricular region, are nearly ubiquitous with aging1,2 and are thought to represent the cumulative effects of small vessel ischemia, though T2 hyperintensities are non-specific. Cerebral blood flow (CBF) provides a more specific measure of ischemia, but is challenging to measure in white matter. The periventricular white matter (PVWM) region, which is supplied by the terminal distributions of small arteries, is the brain region most vulnerable to chronic subthreshold CBF3 and is the primary site for developing WMLs2. PVWM-CBF accordingly provides a putative measure of microvascular CBF with minimal contribution from large arteries. We hypothesized that mean CBF in PVWM measured using state-of-the-art arterial spin labeled (ASL) perfusion MRI would provide a sensitive and mechanistically specific biomarker of small vessel ischemic disease with greater predictive value than current approaches focusing on white matter lesions. We developed the PVWM region of interest (ROI) and demonstrated that PVWM-CBF correlates with PVWM, deep white matter (DWM), and total lesion volume even after adjusting for global CBF. In addition, PVWM-CBF provided a better prediction of cognitive performance than CBF in other regions, or white matter lesion volume.Methods
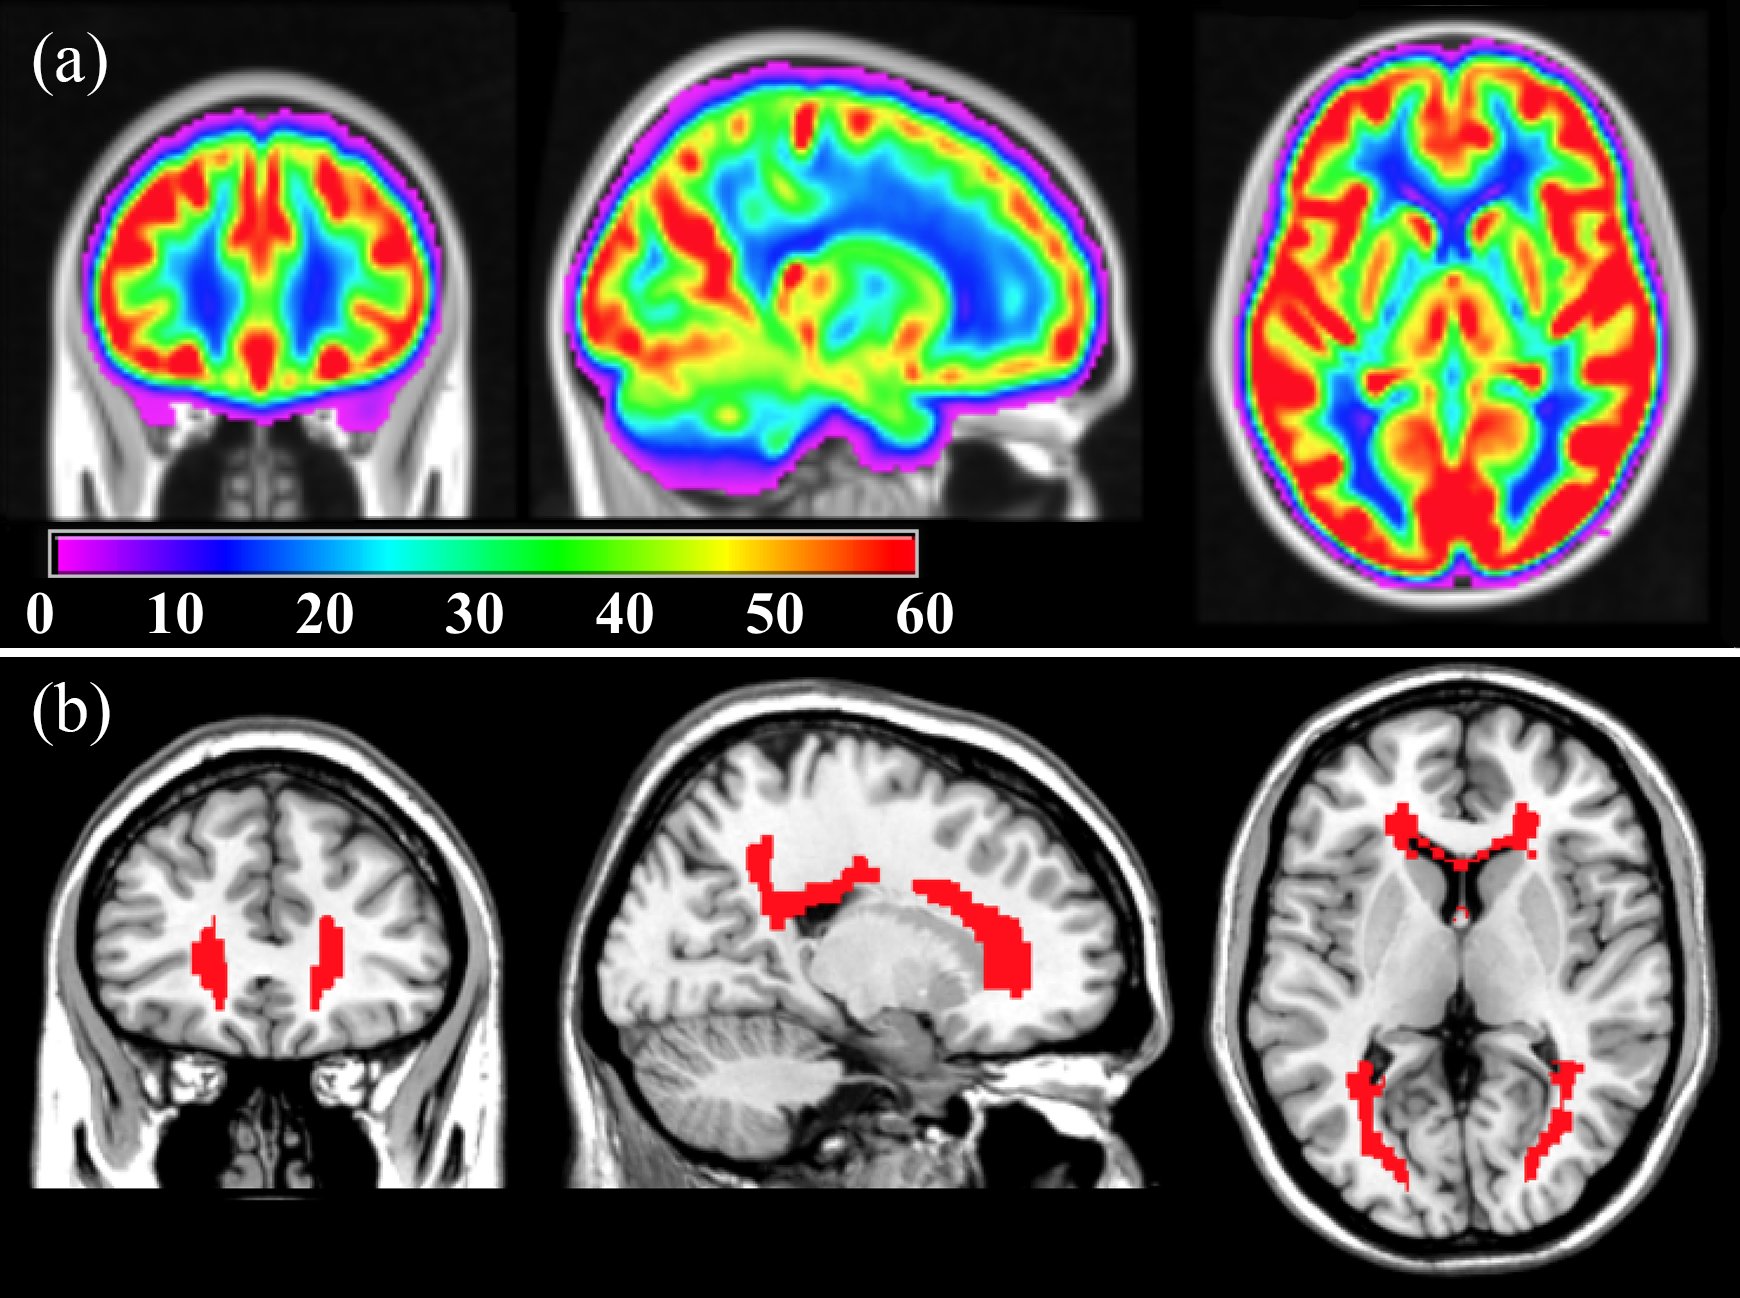
A highly sensitive group-averaged CBF map (figure 1(a)) was derived from 436 healthy middle-aged subjects (age=50.4±3.5 years, 54% female) enrolled in the NHLBI CARDIA study4. The CBF map was derived from 2D pseudo-continuous ASL (PCASL) data (labeling=1.48s, post-labeling-delay (PLD)=1.5s, voxel=3.4x3.4x5mm3) and processed with advanced signal processing strategies.5,6 Subsequently, the PVWM region of interest (ROI) for ischemic risk was constructed by thresholding the group-averaged CBF map to CBF<15 ml/100g/min (figure 1(b)), a threshold shown to predict future occurrence of lesions with certainty7. This region shows the lowest CBF in the brain and is most vulnerable to develop lesions in older age.
State-of-the-art ASL MRI8 (acquired with unbalanced PCASL and 90% background-suppressed 4-shot 1D-accelerated 3D spiral imaging, resolution=2.5 mm3 isotropic, labeling=1.8s, PLD=1.8s, TR=4.25s, TEeff=9.78ms) (representative images in Figure 2) and Fluid Attenuated Inversion Recovery (FLAIR) MRI (TR/TE = 6000/382ms, resolution=0.8 mm3 isotropic, rate=2 GRAPPA acceleration) were obtained from 59 elderly, cognitively normal and amyloid negative subjects (age=73.3±6.9, 63% female) recruited from the Penn Alzheimer’s Disease Center clinical core. Automated lesion segmentation from FLAIR data was obtained using lesion segmentation toolbox9 to derive PVWM, DWM and total lesion volume measurements. Mean CBF in 1) global, 2) grey matter (GM), 3) white matter (WM) and 4) PVWM ROI (constructed as detailed above) were correlated with the lesion volumes after normalizing by total WM volume. The ROI CBFs and the lesion volumes were also correlated with neuropsychological Trail Making Test A and B time performances, which are thought to be sensitive to degeneration in WM pathways.
Results
Figure 3 shows correlations between the various ROI CBFs and lesion volumes. GM CBF correlated with PVWM and total lesion volume (although not with DWM lesion volume) whereas global CBF showed a trend. No significant correlation was observed for WM CBF. PVWM-CBF showed the strongest correlations with PVWM, DWM and total lesion volumes, maintained even after normalized by global CBF. PVWM-CBF outside of lesions also correlated or trended with lesion volumes, which demonstrates that PVWM-CBF values are not driven by lesions only. In each case, the correlation weakened after adjusting for age and sex.
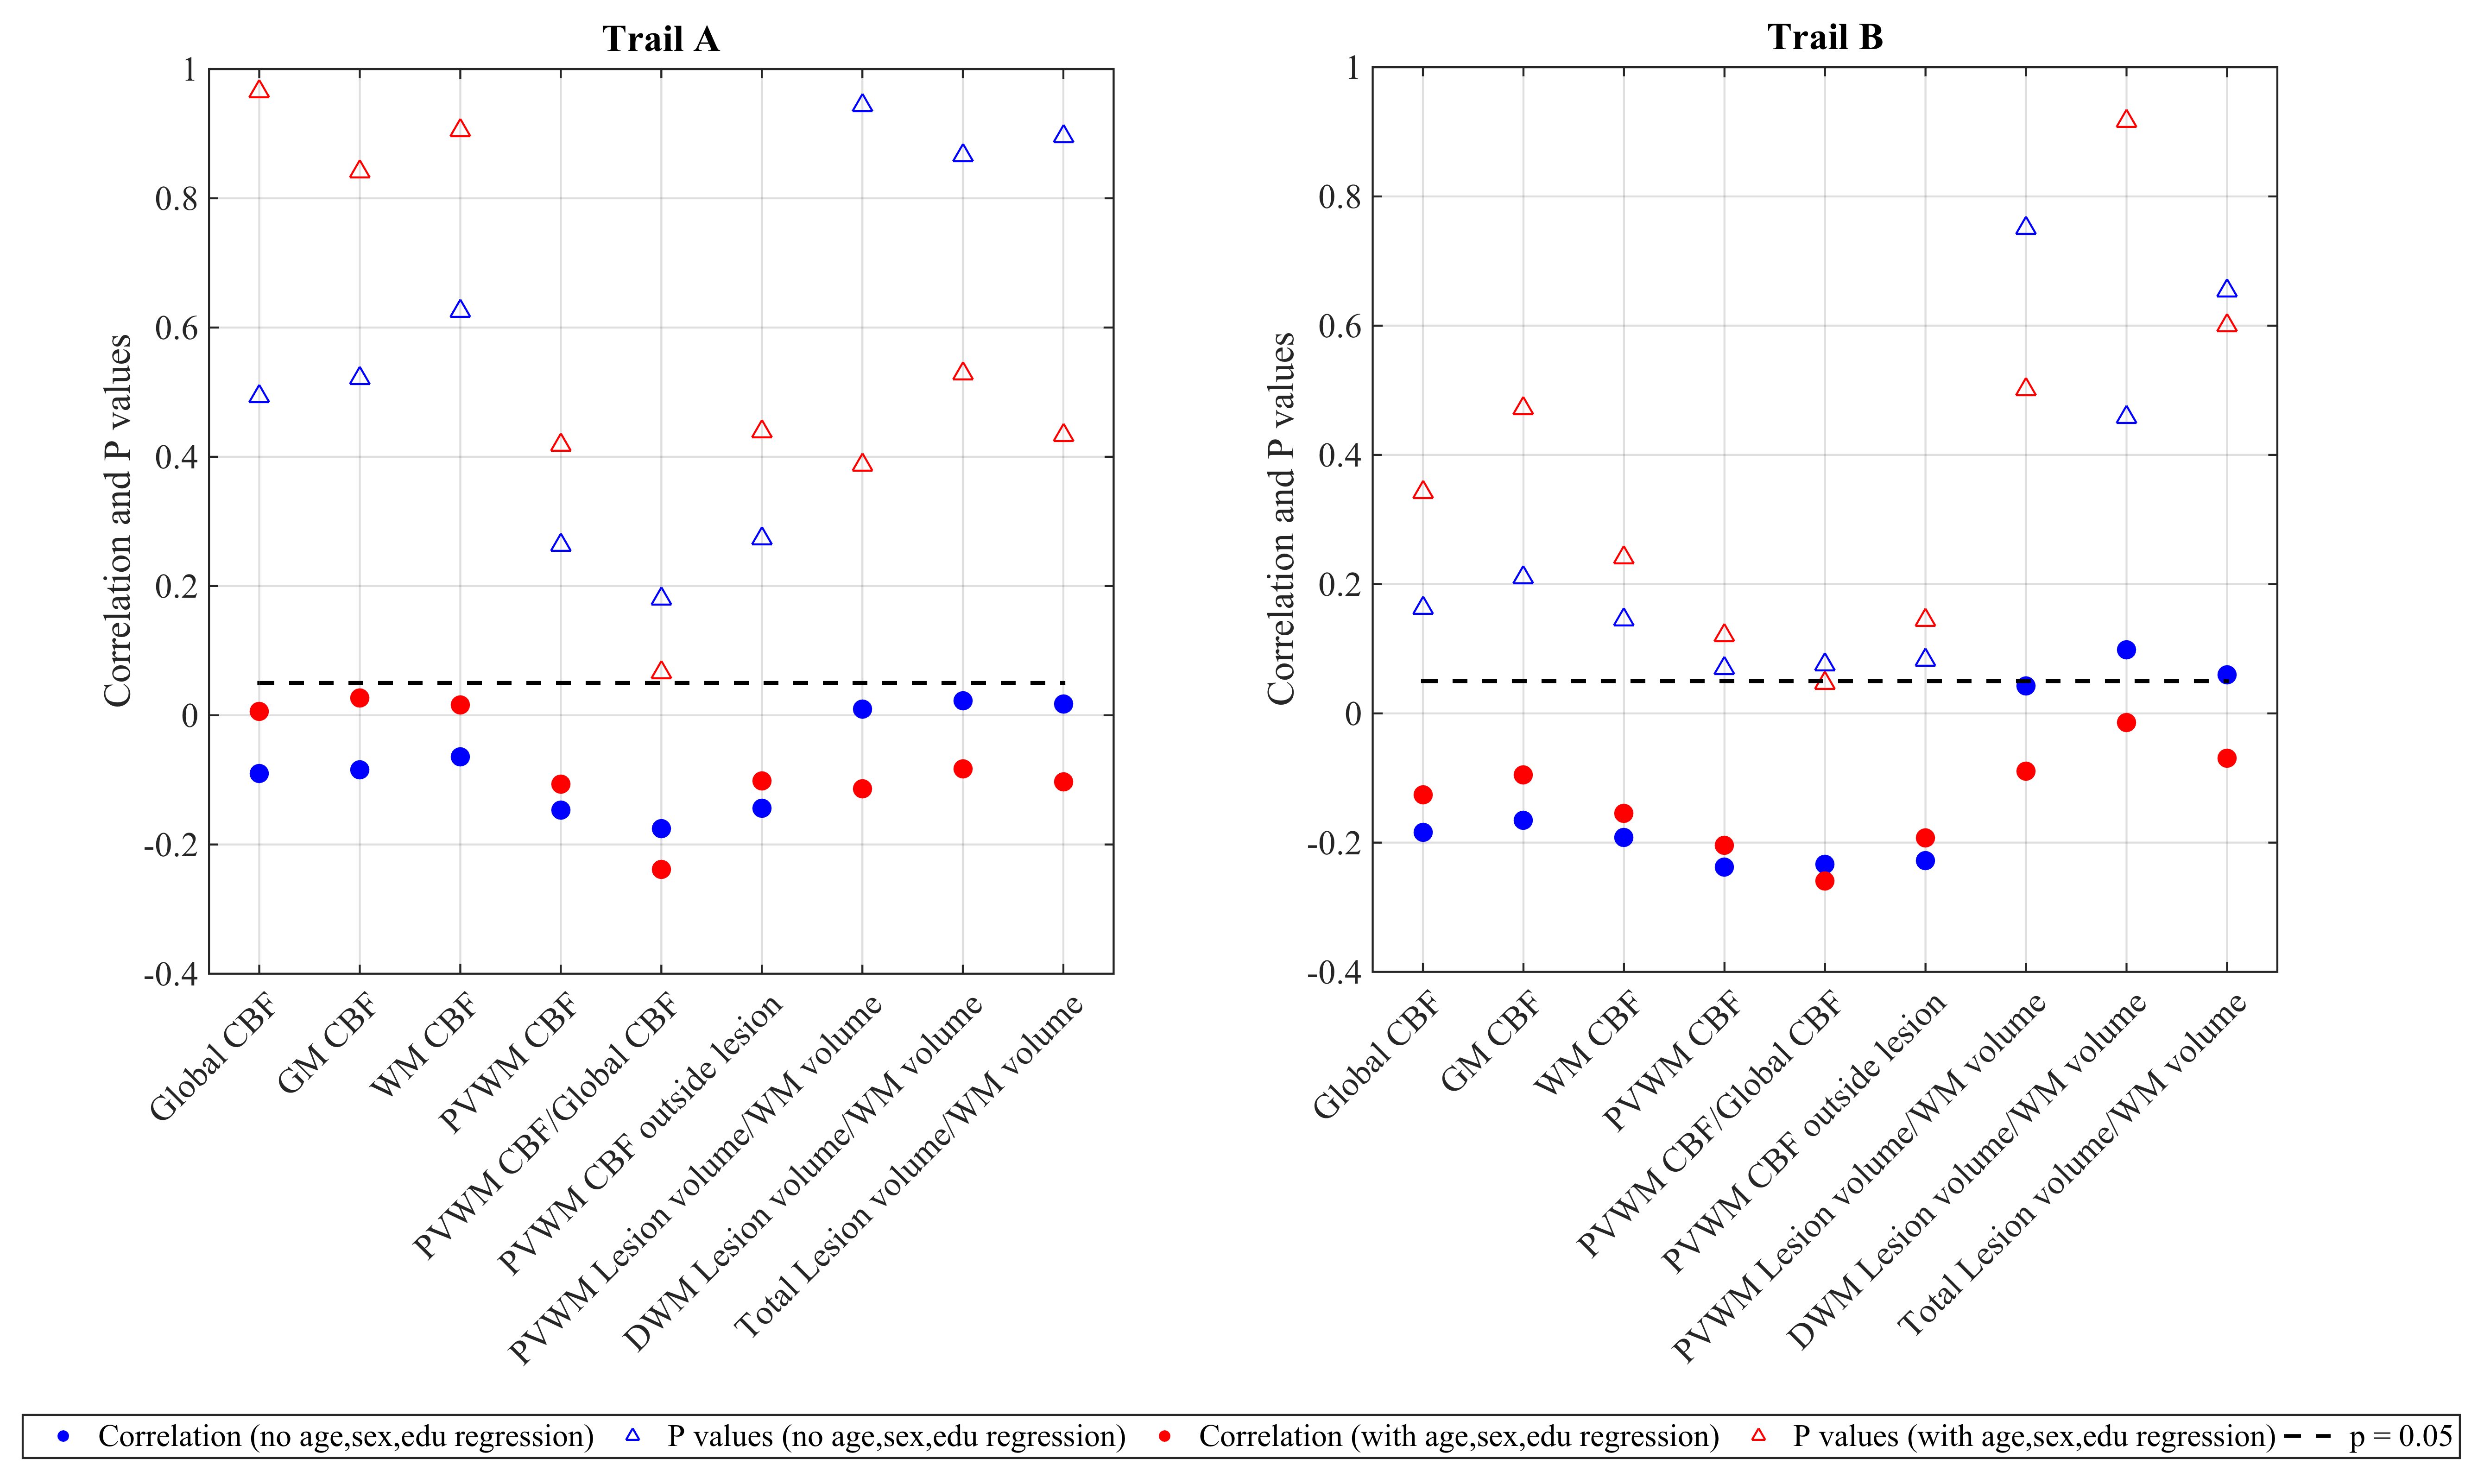
Figure 4 shows correlations of time taken for completion of trail A and B tests with CBF measures and lesion volumes at different ROIs. Although the correlations did not reach statistical significance, PVWM CBF showed a higher degree of correlation, and p values tending towards significance.
Discussions and conclusions
Recent ASL advancements enable sufficient sensitivity and resolution for measurement of white matter CBF. This study demonstrated the feasibility of measuring PVWM CBF and its potential for providing a specific biomarker of microvascular brain dysfunction. PVWM-CBF showed higher predictive power than the other ROIs for both WM lesions and cognitive performance, which persisted after adjusting for global CBF. Since global CBF includes a microvascular component, normalizing by global CBF is expected to partially reduce the specificity of PVWM-CBF. Reduced correlations after regressing for age demonstrate the dependence of both lesions and CBF on age, but PVWM-CBF still showed the strongest dependence with lesions among measured parameters, including correlation trends with cognitive performance. Although the current approach is highly promising, further optimization of PVWM-CBF could include multi-PLD ASL, improved spatial coregistration of the PVWM ROI, and optimized definition of the PVWM ROI based on group PVWM CBF and/or white matter lesion frequency.Acknowledgements
R01 MH080729, P41 EB015893, R01 AG040271 and P30 AG010124. The Coronary Artery Risk Development in Young Adults (CARDIA) study is supported by contracts HHSN268201300025C, HHSN268201300026C, HHSN268201300027C, HHSN268201300028C, HHSN268201300029C, and HHSN268200900041C from the National Heart, Lung, and Blood Institute (NHLBI), the Intramural Research Program of the National Institute on Aging (NIA), and an intra-agency agreement between NIA and NHLBI (AG0005).References
1. Yue NC, Arnold AM, Longstreth WT, Jr., et al. Sulcal, ventricular, and white matter changes at MR imaging in the aging brain: data from the cardiovascular health study. Radiology 1997;202:33-39.
2. Habes M, Erus G, Toledo JB, et al. White matter hyperintensities and imaging patterns of brain ageing in the general population. Brain : a journal of neurology 2016;139:1164-1179.
3. Holland CM, Smith EE, Csapo I, et al. Spatial distribution of white-matter hyperintensities in Alzheimer disease, cerebral amyloid angiopathy, and healthy aging. Stroke; a journal of cerebral circulation 2008;39:1127-1133.
4. Dolui S, Wang Z, Wang DJ, et al. Comparison of non-invasive MRI measurements of cerebral blood flow in a large multisite cohort. Journal of cerebral blood flow and metabolism : official journal of the International Society of Cerebral Blood Flow and Metabolism 2016;36:1244-1256.
5. Dolui S, Wang Z, Shinohara RT, et al. Structural Correlation-based Outlier Rejection (SCORE) algorithm for arterial spin labeling time series. Journal of magnetic resonance imaging : JMRI 2016;45:1786-1797.
6. Dolui S, Wolk DA, Detre JA. SCRUB: A Structural Correlation and Empirical Robust Bayesian Method for ASL Data. Proceedings of the International Society of Magnetic Resonance in Medicine; 2016; Singapore.
7. Bernbaum M, Menon BK, Fick G, et al. Reduced blood flow in normal white matter predicts development of leukoaraiosis. Journal of cerebral blood flow and metabolism : official journal of the International Society of Cerebral Blood Flow and Metabolism 2015;35:1610-1615.
8. Vidorreta M, Wang Z, Chang YV, et al. Whole-brain background-suppressed pCASL MRI with 1D-accelerated 3D RARE Stack-Of-Spirals readout. PloS one 2017;12:e0183762.
9. Schmidt P, Gaser C, Arsic M, et al. An automated tool for detection of FLAIR-hyperintense white-matter lesions in Multiple Sclerosis. NeuroImage 2012;59:3774-3783.
Figures