0182
Black-blood angiography of the lenticulostriate artery at 3T using a high-resolution intracranial vessel wall MR technique: a comparison validation with 7T TOF-MRA1State Key Laboratory of Brain and Cognitive Science, Institute of Biophysics, Chinese Academy of Sciences, Beijing, China, 2The Innovation Center of Excellence on Brain Science, Chinese Academy of Sciences, Beijing, China, 3Biomedical Imaging Research Institute, Cedars-Sinai Medical Center, Los Angeles, CA, United States, 4University of Chinese Academy of Sciences, Beijing, China, 5Siemens Shenzhen Magnetic Resonance Ltd., Shenzhen, China, 6Xuanwu Hospital, Beijing, China
Synopsis
The lenticulostriate artery (LSA) supplies blood to the basal ganglia and its vicinity. Noninvasive imaging of the LSA could be clinically useful to understand mechanisms of microvascular pathology or guide early therapeutic intervention. In this study, we used a recently developed high-resolution intracranial vessel wall MR imaging technique to visualize the LSA in a black-blood (BB) fashion at 3T. Compared to 7T TOF-MRA, this approach can depict the LSA, particularly the stems and proximal segments, with comparable image quality.
Background
The lenticulostriate artery (LSA) is important for supplying blood to the basal ganglia and its vicinity (1). Impairment of the microvasculature is associated with stroke and vascular dementia. Noninvasive techniques for imaging the LSA are clinically useful to understand the mechanisms of microvascular pathology or guide early therapeutic intervention. TOF-MRA at 7T has allowed for exquisite LSA visualization due to obtainable high spatial resolution, but 7T MR scanners are not widely accessible. In this study, a recently developed high-resolution intracranial vessel wall MR imaging technique was employed to image the LSA in a black-blood (BB) modality at 3T. The imaging quality of the BB-MRA was validated by comparing it with 7T TOF-MRA.Methods
Twelve healthy volunteers were enrolled in the study. The local institutional review board approved the study, and informed consent was obtained from all the subjects. For every volunteer, BB-MRA on a MAGNETOM Prisma 3T MR scanner (Siemens Healthcare, Erlangen, Germany) and TOF-MRA on a 7T research scanner (Siemens Healthcare, Erlangen, Germany) were acquired on the same day.
The BB-MRA was implemented by an inversion-prepared, 3D variable-flip-angle turbo spin-echo (TSE) sequence with the following imaging parameters (2): spatial resolution = 0.53x0.53x0.53 mm3, TR/TE = 900/13 ms, echo train length = 52, and acquisition time = 8 min, 10 sec. TOF-MRA was acquired with a spatial resolution of 0.23x0.23x0.34 mm3 and a scan time of 7 min, 23 sec (3).
The middle cerebral artery (MCA) and the LSA were manually traced on the minimal and maximal intensity projections (thickness 0.92 mm) of BB-MRA and TOF-MRA, respectively (4,5). The number of stems and branches of the LSA were counted on the vascular skeletons. The most prominent branch was chosen to measure the contrast-to-noise ratio (CNR), length, and distance between the origin and the visible extremity.
Results
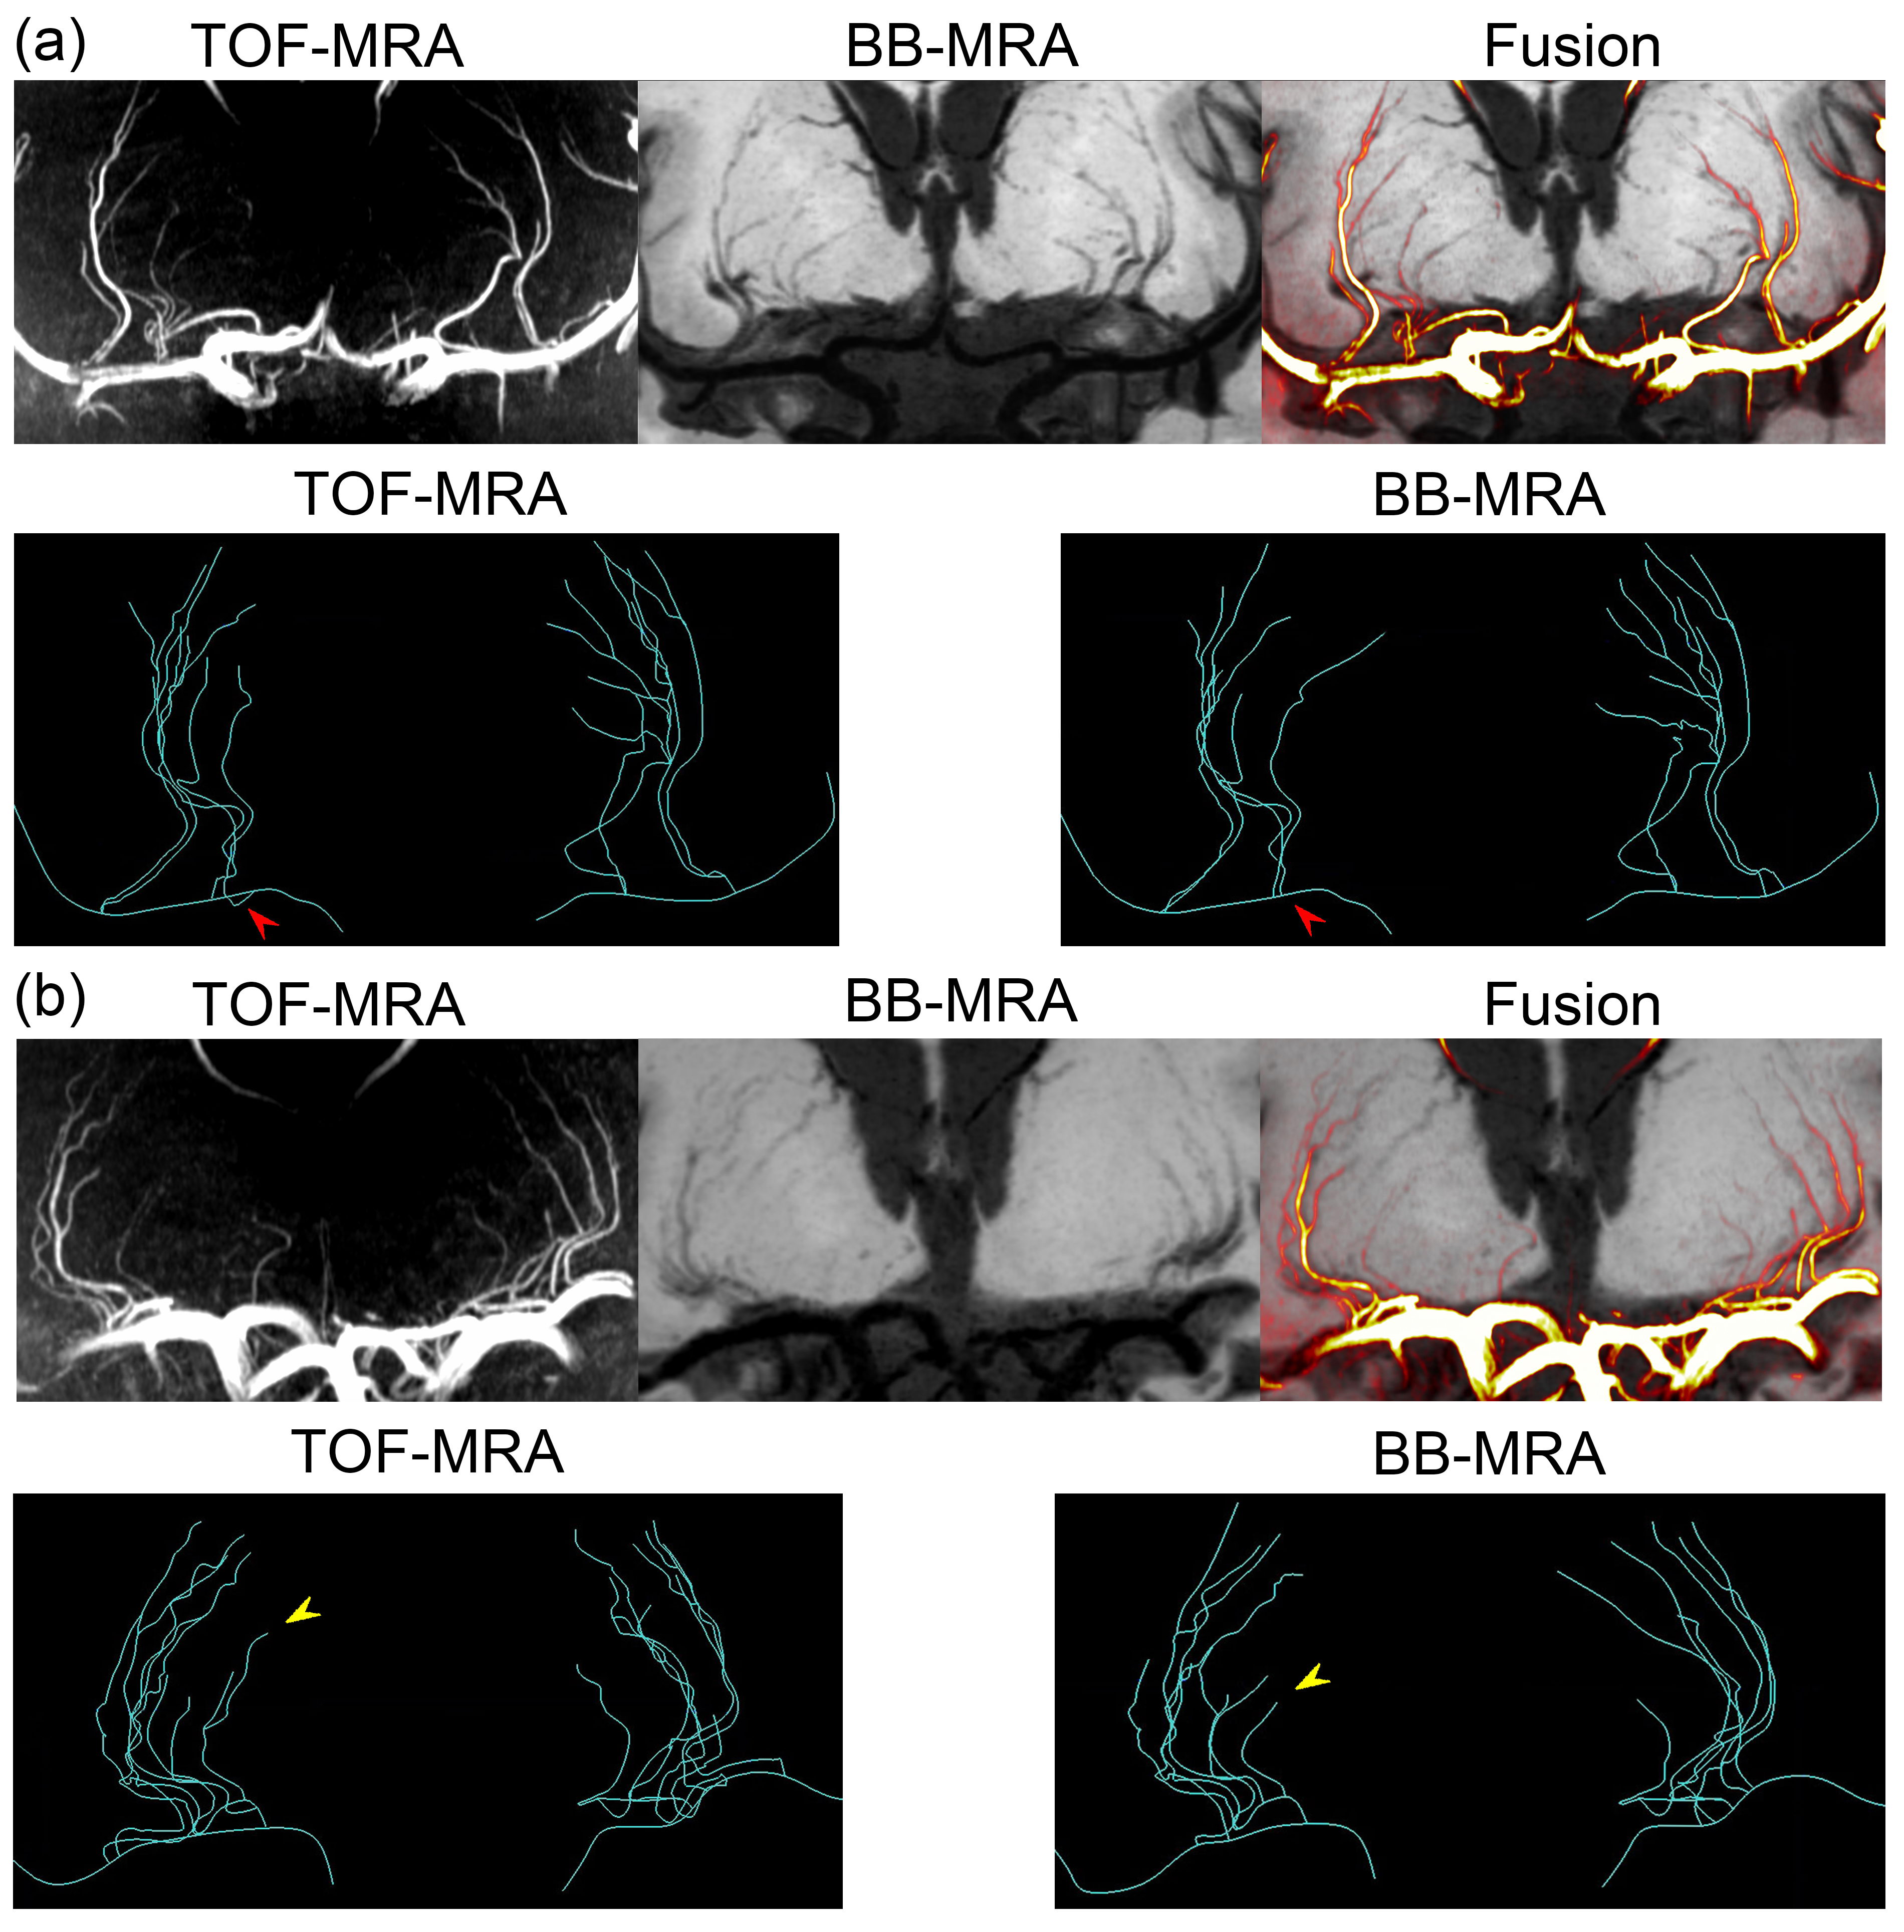
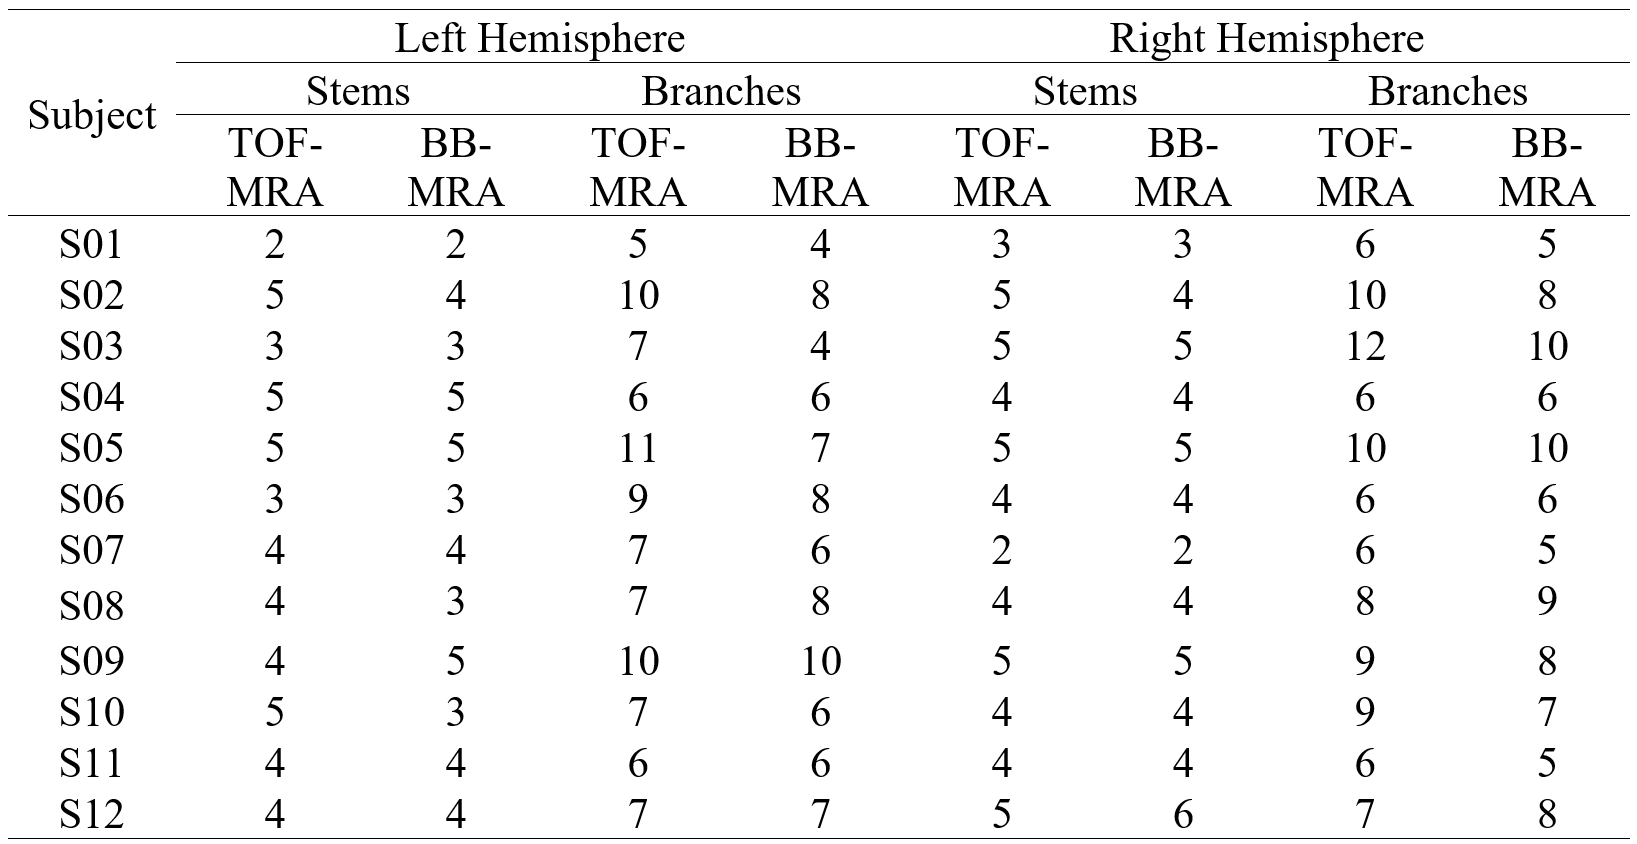
The reconstructed vascular trees of TOF-MRA and BB-MRA are in good agreement in 9 of 12 cases, in which the differences in the number of stems and branches are no more than 2 (see Fig. 1a and Table 1). In the remaining 3 cases, BB-MRA missed some tiny branches and the distal segments of the LSA (Fig. 1b).
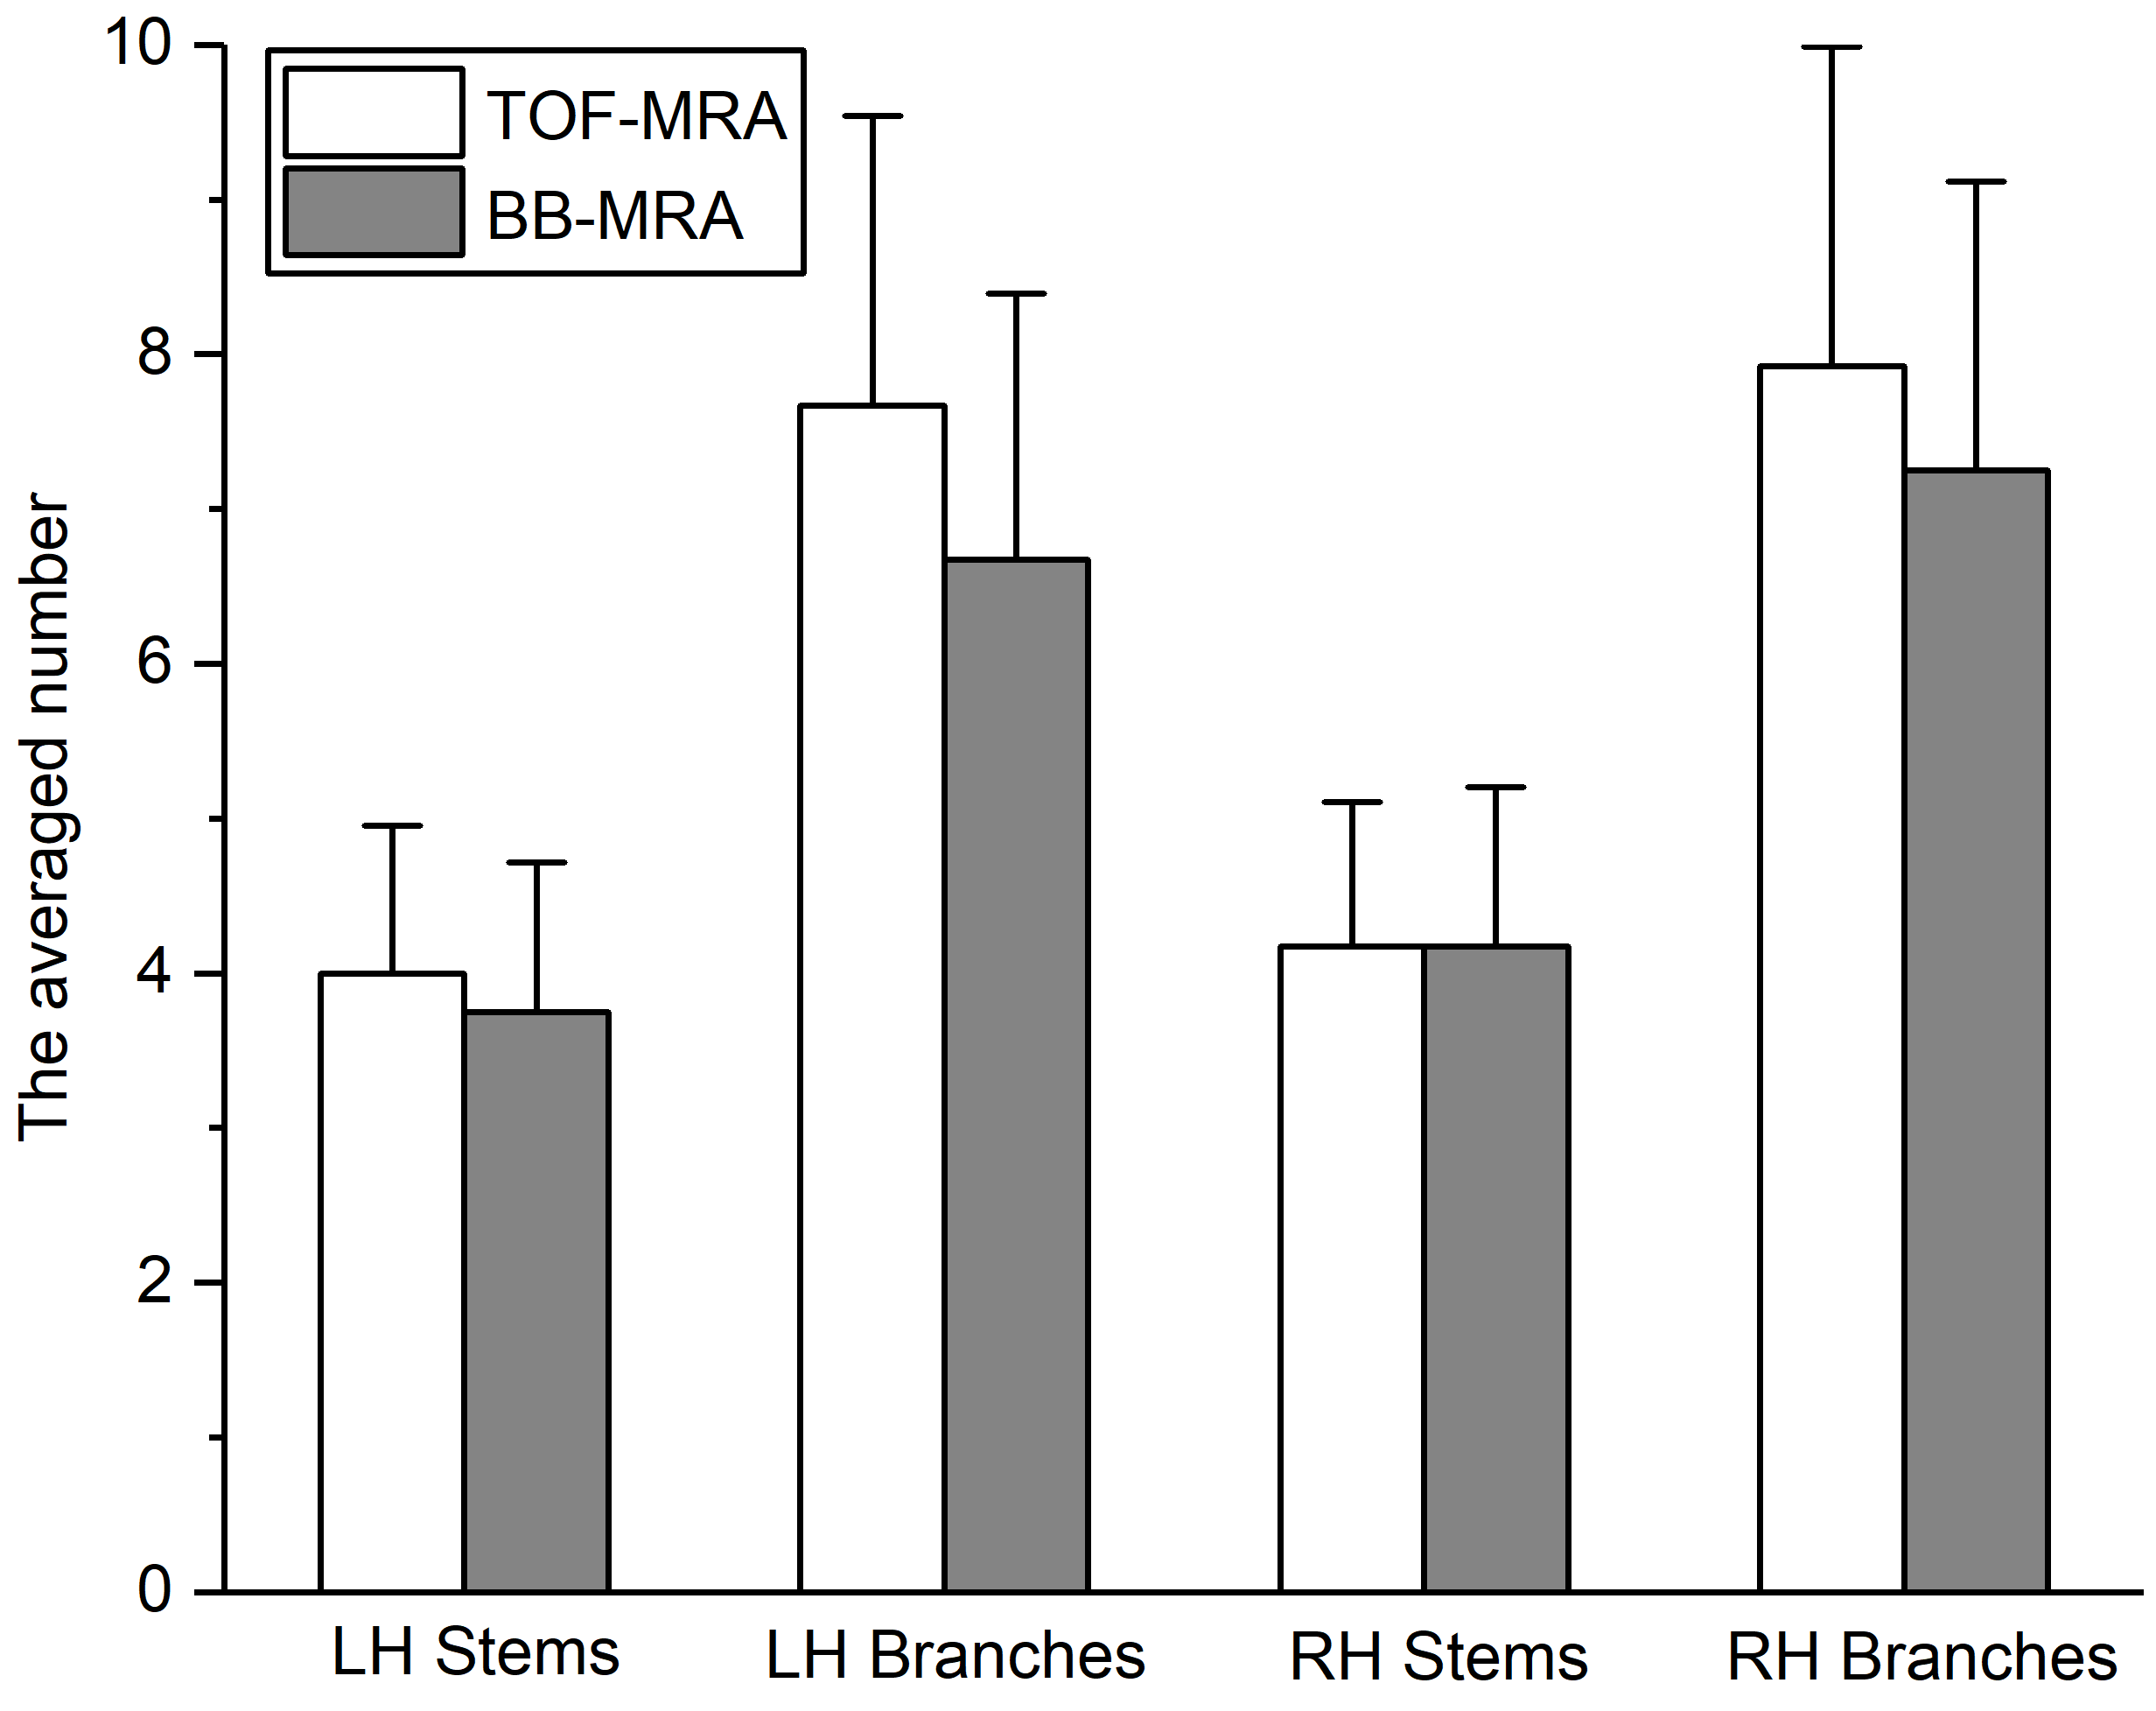
The two acquisitions showed similar numbers of LSA stems, but the number of branches seen with BB-MRA was smaller than with TOF-MRA in 3 cases (Table 1). Fig. 2 shows that there was no significant difference between the two imaging modalities (Mann-Whitney U test, LH stems: p = 0.486, LH branches: p = 0.262, RH stems: p = 0.877, and RH branches: p = 0.410).
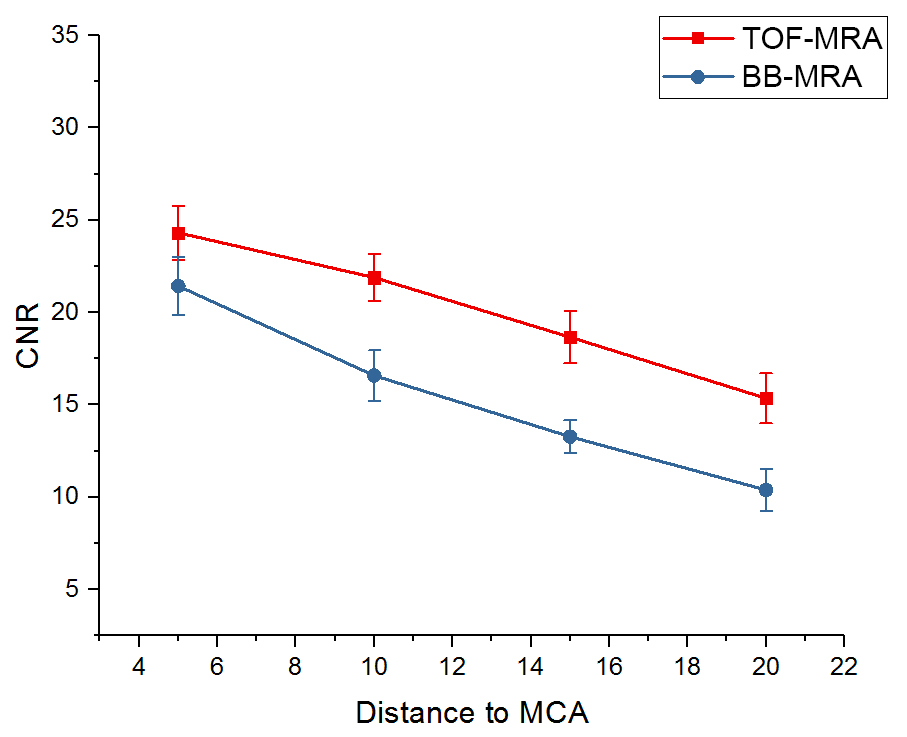
Fig. 3 demonstrates a higher CNR at 7T TOF-MRA than 3T BB-MRA. The CNR of the LSA branches decreased with the distance to the parent MCA in both TOF-MRA and BB-MRA.
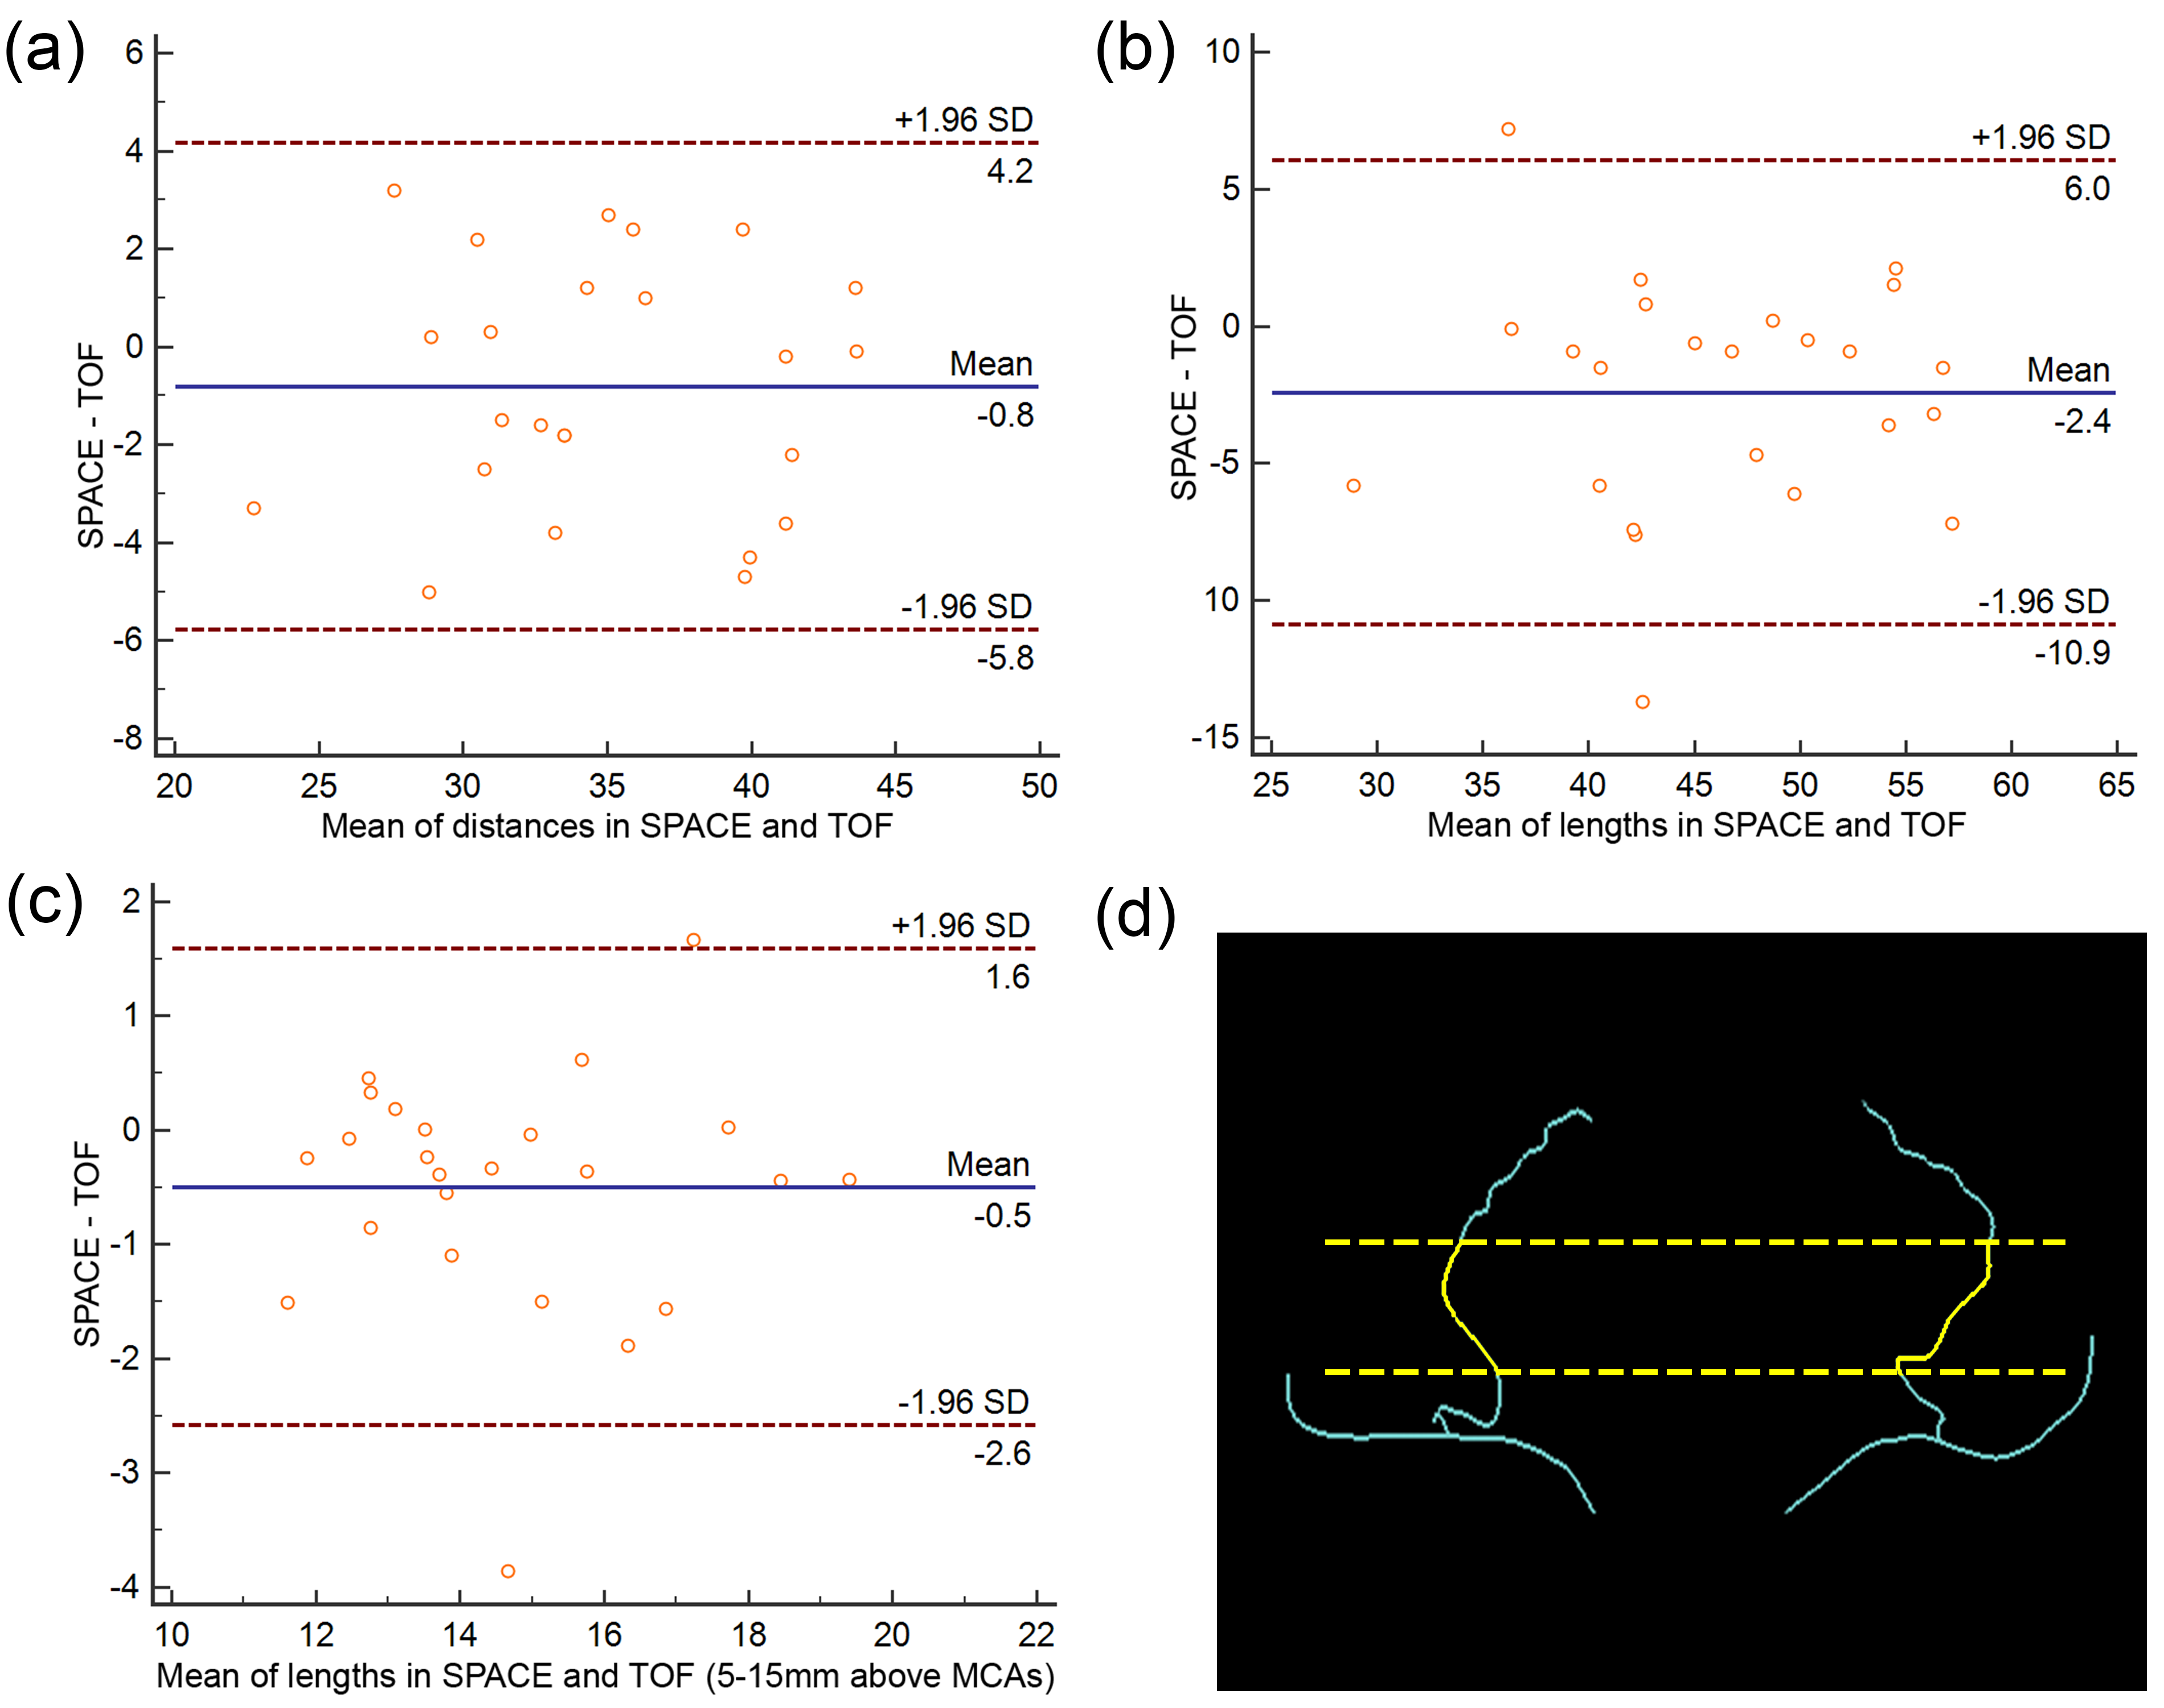
The Bland-Altman plots in Fig. 4 show that there were similar distances measured with both BB-MRA and TOF-MRA but a shorter length with BB-MRA. The difference in length is reduced when measuring the parts with 5-15 mm vertical distances from the MCA.
Discussion
Our results indicate that BB-MRA achieves a credible depiction of the LSA in the brain parenchyma near the skull base, where CNR is sufficient for discriminating the lumen of the LSA from background tissue. The number of stems acquired using 3T BB-MRA and 7T TOF-MRA is highly consistent. The extracted vascular trees from the two modalities are in good agreement, in most cases.
The major deficiencies of 3T BB-MRA in imaging the LSA involve the number of branches and the length of visible vessels. Fig. 3 shows that 7T TOF-MRA has a higher CNR than 3T BB-MRA. This means that the contrast of the lumen to the surrounding tissue may be insufficient for identifying the far end of the LSA using 3T BB-MRA. Some tiny extremities are therefore not confidently visible in the images, as shown in Fig. 1b.
The cerebrospinal fluid surrounding the MCA also introduces an uncertainty in tracing the arterial lumen of the LSA in BB-MRA, in some cases. This makes the proximal part of the extracted LSA less distinguishable, as illustrated in Fig. 1a. These two speculations are supported by the findings shown in Fig. 4c, where the lengths measured in the two modalities are close to each other when tracing only parts of the LSA.
Conclusion
The intracranial vessel wall MR technique was demonstrated to achieve BB-MRA of the LSA in a 3T MR system. Compared with 7T TOF-MRA, the stems and proximal segments of the LSA are well-depicted by BB-MRA, with comparable image quality.Acknowledgements
This work was supported in part by the Ministry of Science and Technology of China grant (2015CB351701), and the National Nature Science Foundation of China grant (91132302).References
1. Marinković S, Gibo H, Milisavljević M, Ćetković M. Anatomic and clinical correlations of the lenticulostriate arteries. Clin. Anat. 2001;14:190–195. doi: 10.1002/ca.1032.
2. Yang Q, Deng Z, Bi X, Song SS, Schlick KH, Gonzalez NR, Li D, Fan Z. Whole-brain vessel wall MRI: A parameter tune-up solution to improve the scan efficiency of three-dimensional variable flip-angle turbo spin-echo. J. Magn. Reson. Imaging 2017;46:751–757. doi: 10.1002/jmri.25611.
3. Kang C-K, Park C-W, Han J-Y, Kim S-H, Park C-A, Kim K-N, Hong S-M, Kim Y-B, Lee KH, Cho Z-H. Imaging and analysis of lenticulostriate arteries using 7.0-Tesla magnetic resonance angiography. Magn. Reson. Med. [Internet] 2009;61:136–144. doi: 10.1002/mrm.21786.
4. Rosset A, Spadola L, Ratib O. OsiriX: An open-source software for navigating in multidimensional DICOM images. J. Digit. Imaging 2004;17:205–216. doi: 10.1007/s10278-004-1014-6.
5. Updegrove A, Wilson NM, Merkow J, Lan H, Marsden AL, Shadden SC. SimVascular: An Open Source Pipeline for Cardiovascular Simulation. Ann. Biomed. Eng. 2017;45:525–541. doi: 10.1007/s10439-016-1762-8.
Figures