0181
Identify the neurovascular coupling efficacy of long-term depolarization or seizer-like events in the hippocampus with optogenetic single-vessel fMRI1High-Field Magnetic Resonance, Max Planck Institute for Biological Cybernetics, Tuebingen, Germany, 2University of Tuebingen, Tuebingen, Germany, 3Neurology, Renmin Hospital of Wuhan Universit, Wuhan University, Wuhan, China, 4Graduate Training Centre of Neuroscience, University of Tuebingen, Tuebingen, Germany
Synopsis
Optogenetic activation can elicit seizure-like events in the hippocampus of anesthetized rats. However, it remains unclear how the hemodynamic signaling responds to the seizure-like events or long-term depolarization in hippocampus. Here, we applied the multi-model fMRI platform to acquire concurrent single-vessel fMRI and calcium signal upon optogenetic stimulation in the hippocampus. The neurovascular coupling coefficient was significantly lower for the long-term depolarization/seizure-like calcium event than that of normally evoked events. The reduced neurovascular coupling efficacy during seizure-like events indicates the lack of sufficient blood supply under high-energy demand of long-term depolarization, and eventually causes tissue damage.
Introduction
The single-vessel fMRI method has been developed
to map the hemodynamic signal from individual penetrating vessels in deep
cortical layers1. The advantage of the single-vessel fMRI method is to detect
the vessel-specific hemodynamic responses at the deeper brain regions beyond
the penetrating depth of the conventional optical methods (e.g. two photon
imaging), e.g. hippocampus, noninvasively2. By combining single-vessel fMRI
with optogenetics and fiber optic calcium recording methods, i.e. an
multi-modal fMRI platform, we could examine the underlying neurovascular
coupling events in the subcortical regions of animals at both normal
physiological and pathophysiological states3. Several studies reported the optogenetically driven seizure-like
events in the hippocampus of anesthetized rats with fMRI4, 5. However, it
remains unclear how the seizure-like or long-term depolarization events couple to
hemodynamic signaling in the hippocampal vasculature. Here, we applied the multi-model
fMRI platform to acquire concurrent single-vessel fMRI and calcium signal upon
optogenetic stimulation, showing distinct neurovascular coupling efficacy
between normally evoked and long-term depolarization/seizure-like calcium
events in hippocampus. Methods
fMRI were performed in alpha-chloralose anesthetized rats. The detailed surgical procedures were described previously6. Briefly, all images were acquired with a 14.1T/26 cm horizontal bore magnet (Magnex), interfaced to an AVANCE III console (Bruker) and equipped with a 12 cm gradient set, capable of providing 100 G/cm with a rise time of 150 μs (Resonance Research). A transreceiver surface coil with 7.5 mm diameter was used to acquire fMRI images. To detect the individual arterioles and venules, a 2D-MGE sequence was used with the following parameters: TR, 100 ms; TE, 2.5, 5.5, 11.5, 14.5, 17.5, 17.5, 20.5, 23.5 ms; flip angle, 58°; matrix, 256x192; in-plane, 67x67 μm; slice thickness, 500 μm. For fMRI, the steady state free precession (SSFP) imaging method was applied to map the fMRI signal with the following parameters: TE, 5.85 ms (BOLD) TR, 11.7 ms; matrix, 128x128 (BOLD); flip angle, 22°; TE, 5.2 ms (CBV); TR, 10.4 ms; matrix, 96x96 (CBV); flip angle, 17°; slice thickness, 500 μm. CBV-weighted signals were obtained after intravenous administration of 15-20 mg Fe/kg dextran coated iron oxide (Biopal, MA). The ChR2 and Gcamp6f were expressed by AAV5 viral vectors into the hippocampal CA1 region with CaMKII and Syn promoters. Fiber optic (200 μm) was inserted into the hippocampus for optical stimulation, the light pulse was delivered through the 473 nm laser (10 ms, 3 Hz, 8 s). AFNI software was used for image analysis. The amplitude modulated response model (AM1) based on the AFNI script was used to perform the linear regression analysis.Results
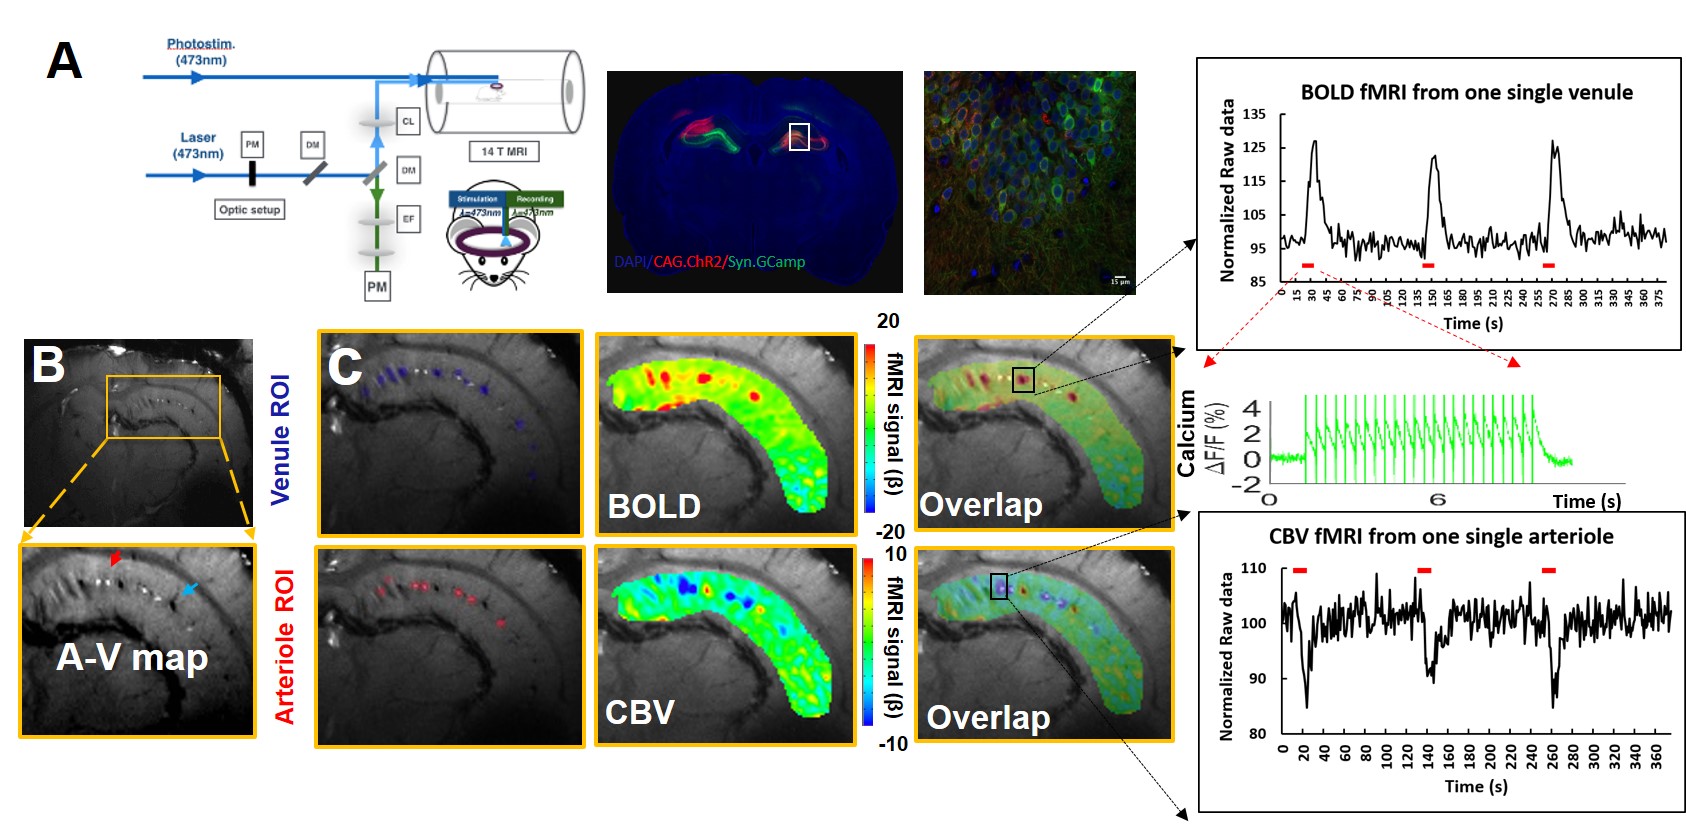
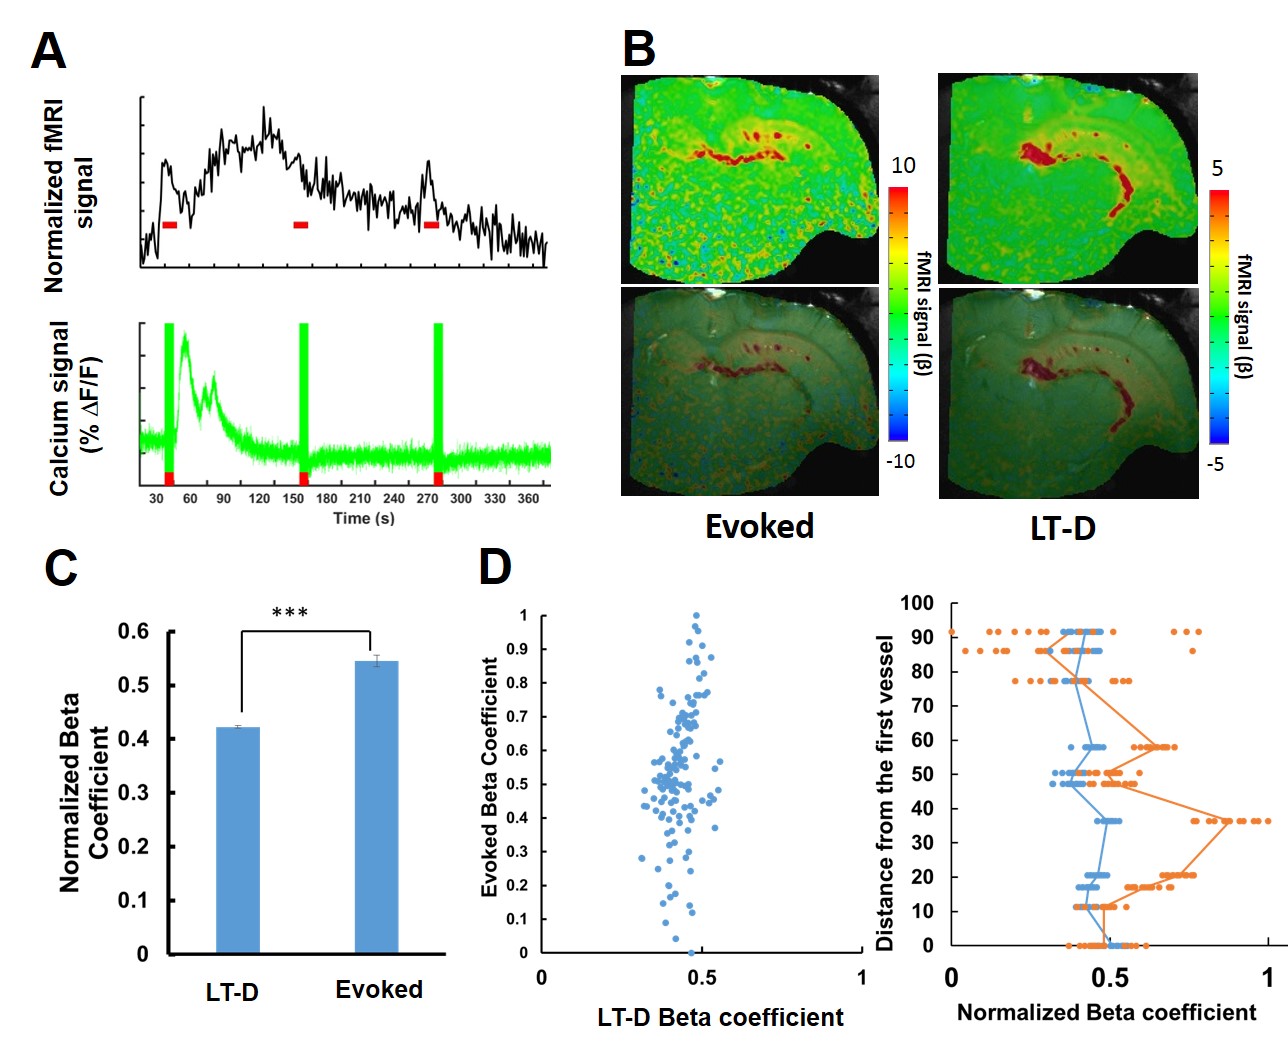
We first established the multi-modal fMRI platform to record the single-vessel fMRI and calcium signal in the hippocampus upon optogenetic stimulation. Fig 1A shows the schematic plan for the opto-fMRI with calcium signal recording in the hippocampal region, where GCaMP6f was co-expressed with Channelrhodopsin-2. Individual penetrating venules (black dots) and arterioles (white dots) in the hippocampus can be specifically in a 2D A-V map (Fig 1B)2. Two fiber optics were inserted into the hippocampus to concurrently deliver light pulses for optogenetic activation and record the evoked GCaMP-mediated calcium spikes. Fig 1C shows that the BOLD signal was primarily located at the venules and the CBV signal was mainly located at the arterioles. The corresponding calcium signal driven by 10 ms light pulse was recorded simultaneously. As previously reported2,4,5, seizure-like events could be initiated by optogenetic activation in the hippocampus. Here, we observed long-term depolarization (LT-D)-induced large-scale calcium signal during the inter-stimulus intervals and the corresponding increased BOLD signal(Fig 2A). An AFNI-based amplitude modulated response model was applied to perform the linear regression analysis between the calcium and BOLD signal for both normally evoked and LT-D events. The calcium-based neurovascular coupling coefficient is significantly higher for normally evoked events than the LT-D event (Fig 2B, C). Fig 2D shows the vessel-specific coefficient scatter plot for both events, demonstrating largely spread coefficient values for normally evoked events and uniformly distributed LT-D coefficients. By plotting the coefficients from individual vessels as the function of venule distance, the LT-D coefficients were similar in venules penetrating the whole hippocampal structure, but the peak coefficients for normally evoked events were mainly located at the activated hippocampal regions.Conclusion
We detected distinct neurovascular coupling efficacy between normally evoked and Long-term depolarization-induced calcium events. The significantly reduced coefficients of the LT-D event indicates the lack of sufficient blood supply to the hippocampal regions. This multi-modal hippocampal fMRI mapping scheme makes it possible to better decipher the vascular dynamic basis of hippocampal function during the seizure-like states.Acknowledgements
This research was supported by the internal funding from Max Planck Society.References
1. Yu X, et al. Sensory and optogenetically driven single-vessel fMRI. Nature methods 13, 337-340 (2016).
2. Xuming Chen et al. ISMRM (2017).
3. Wang M, et al. ISMRM (2017).
4. Weitz AJ, et al. Optogenetic fMRI reveals distinct, frequency‐dependent networks recruited by dorsal and intermediate hippocampus stimulations. NeuroImage 107, 229‐241 (2015).
5. Osawa S, et al.Optogenetically induced seizure and the longitudinal hippocampal network dynamics. PLoS One 8:e60928 (2013).
6. Yu X, et al.Thalamocortical inputs show post-critical-period plasticity. Neuron. 74, 731-742 (2012).
Figures