0180
3D MRI Mapping of Whole-Brain Water Permeability with Intrinsic Diffusivity Encoding of Arterial Labeled Spins (IDEALS)1Radiology, Stony Brook University Hospital, Stony Brook, NY, United States, 2Biomedical Engineering, Stony Brook University, Stony Brook, NY, United States
Synopsis
Breakdown of the blood-brain barrier has been hypothesized as a key mechanism leading to neuronal dysfunction that underlies many neurological and psychiatric diseases. Compared with exogenous contrast agents, trans-capillary water permeability may provide a more direct and sensitive assessment of BBB integrity at disease onset and progression. While the current gold standard approach to measure water permeability is O15-H2O PET, its widespread use is limited by availability and cost. Here, we propose a novel MRI-based method, IDEALS, to non-invasively map BBB water permeability with high sensitivity and whole-brain coverage. This method was applied in healthy participants and brain tumor patients.
Introduction:
Blood-brain barrier (BBB) disruption has been linked to multiple central nervous system diseases and psychiatric disorders including cancer, multiple sclerosis, stroke, and mood, behavior and cognitive dysfunctions1. Because water molecules are several times smaller than most exogenous contrast agents and trans-capillary water exchange is mainly facilitated by active, trans-cellular transport mechanisms, assessing BBB water permeability, i.e. extraction fraction (Ew) and permeability-surface area product (PSw), could provide a more direct and sensitive assessment of BBB dysfunction at the early stage of disease progression. While O15-H2O positron emission tomography (PET) has long been the gold standard for BBB water permeability measurement, the associated high cost excludes widespread routine applications2-4. Here we propose a novel MRI-based approach, Intrinsic Diffusivity Encoding of Arterial Labeled Spins (IDEALS), to non-invasively map whole-brain BBB water permeability.Theory:
In IDEALS, intravascular and extravascular labeled water after pCASL preparation will be separated by the intrinsic diffusivity of the segmented 3D-GRASE acquisition. The attenuation of the k-space signal caused by self-diffusion and flow-related pseudo-diffusion along the 3D-GRASE echo train manifests as a point spread function (PSF) along the partition direction in the image domain. The PSFs are different for intra- and extra-vascular labeled spins, and are dependent upon the segmentation scheme and other MR parameters. Perfusion MR signals $$$∆M_{high}$$$ and $$$∆M_{low}$$$ acquired at high and low segmentation schemes respectively, can be described as:
$$$∆M_i=(1-A_2)\cdot ∆M_{true}\otimes PSF_i^{intra}+A_2\cdot ∆M_{true}\otimes PSF_i^{extra}$$$, (1)
where the subscript i represents the high and low segmentation scheme; $$$∆M_{true}$$$ is the true perfusion signal; $$$\otimes$$$ is the convolution operator; $$$PSF_i^{intra}$$$ and $$$PSF_i^{extra}$$$ are the PSFs for intravascular and extravascular spins respectively; $$$A_2$$$ is the signal fraction from labeled extravascular spins. The PSFs can be estimated under the paradigm of augmented extended phase graphs accounting for diffusion and pseudo-diffusion5. Therefore, an A2 map can be estimated through a deconvolution process. To improve estimation robustness in low perfusion white matter (WM) regions, a partial volume correction method similar to CBF quantification is utilized6. Two post-labeling delay (PLD) values of 2000 ms and 1000 ms are adopted. A PLD of 2000 ms ensures that all labeled intravascular spins resides in venules and veins so that Ew can be derived from A2 after T1 correction. A PLD of 1000 ms will determine the arterial transit time (ATT) similar to FEAST approach7. The BBB PSw is subsequently estimated from the Renkin-Crone equation8,9:
$$$E_w=1-e^{-\frac{PS_w}{CBF}}$$$. (2)
Methods:
Ten healthy participants and eight brain tumor patients were recruited with IRB approval and informed consent. All studies were performed on a Siemens 3T MRI. The parameters for pCASL 3D-GRASE were: TR/TE/Label Time 4500/16.12/1600ms, FA=120°, matrix of 64×64×32, FOV of 256×256×128mm3, iPAT2. Two segmentation schemes (4PAR×2PE and 1PAR×2PE) and two PLDs (1000 and 2000ms) were used for a total of 4 sets of ASL images with total acquisition time ~15min. High resolution MPRAGE images were acquired for tissue segmentation. FLAIR, pre- and post-contrast images were acquired in brain tumor patients. Two-tailed paired t-tests were used to test for significant within-subject differences in gray matter (GM) and WM. Two-tailed unpaired t-tests were used to test for significant sex differences. P values of <0.05 were considered significant.Results & Discussions:
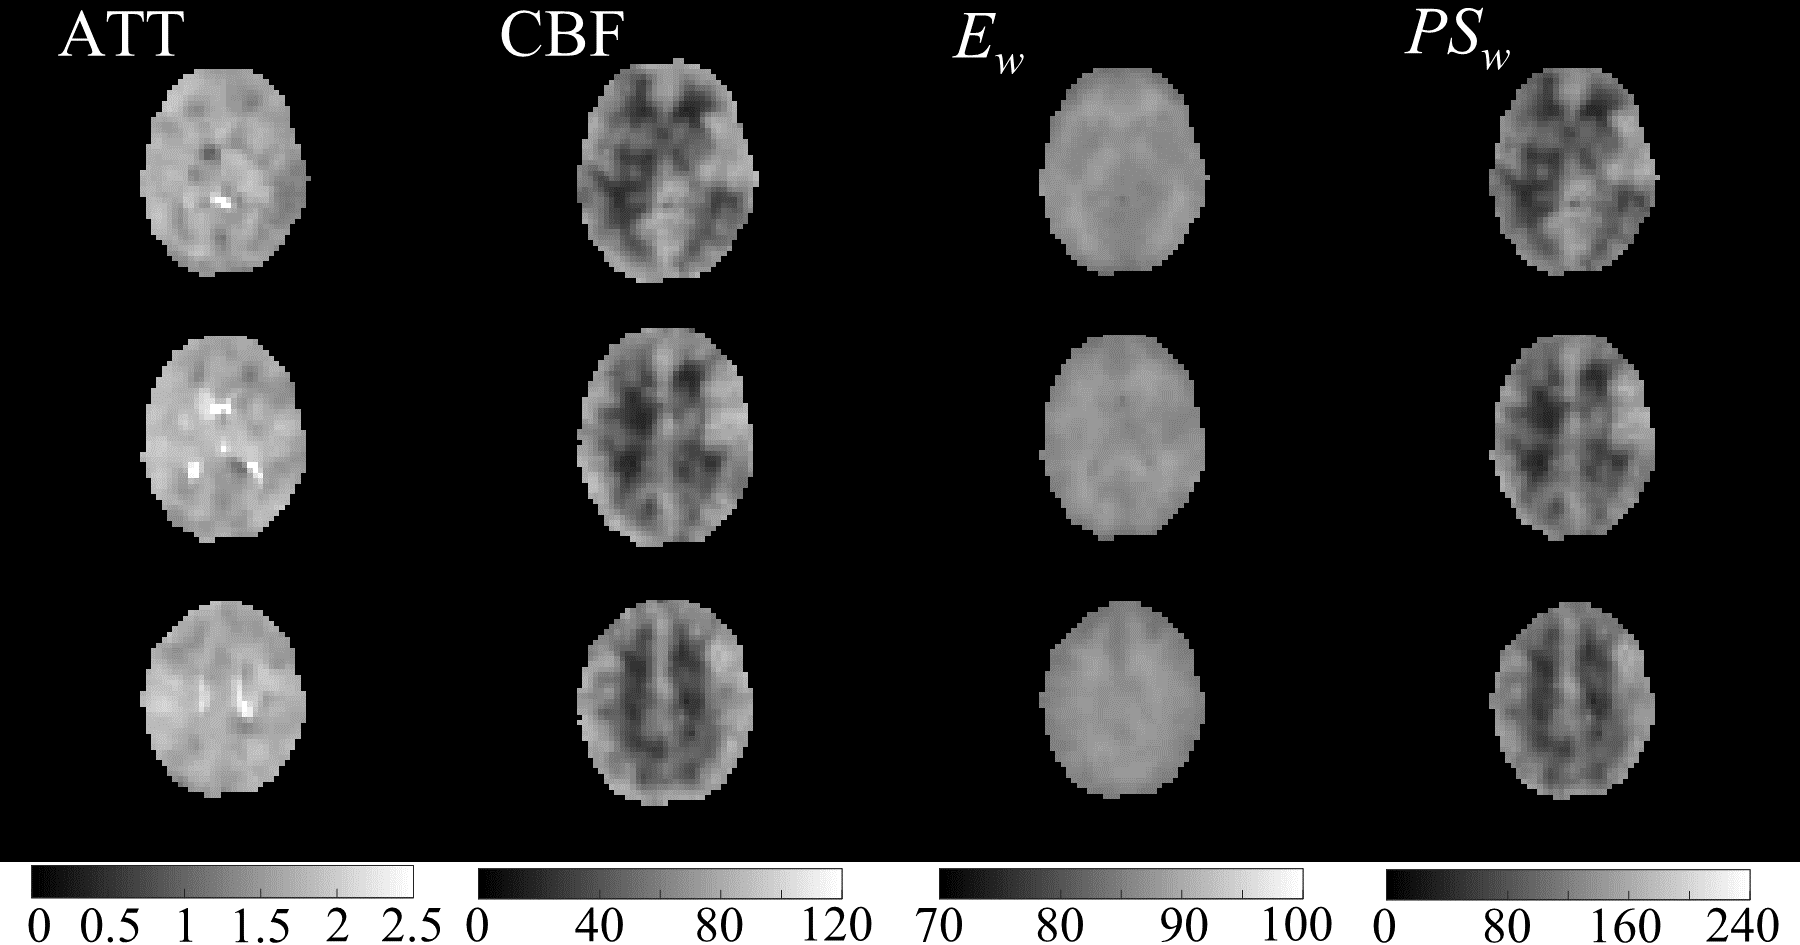
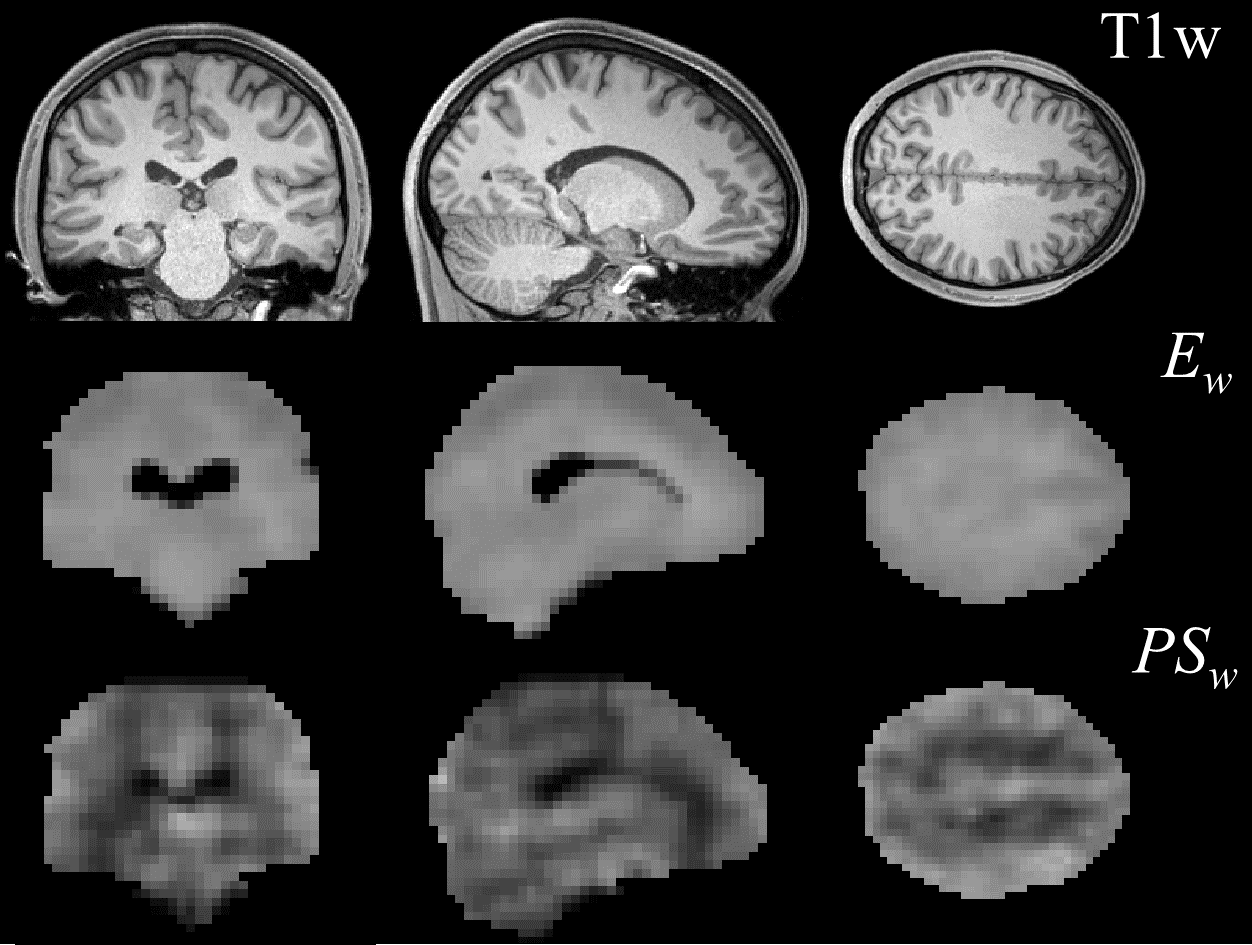
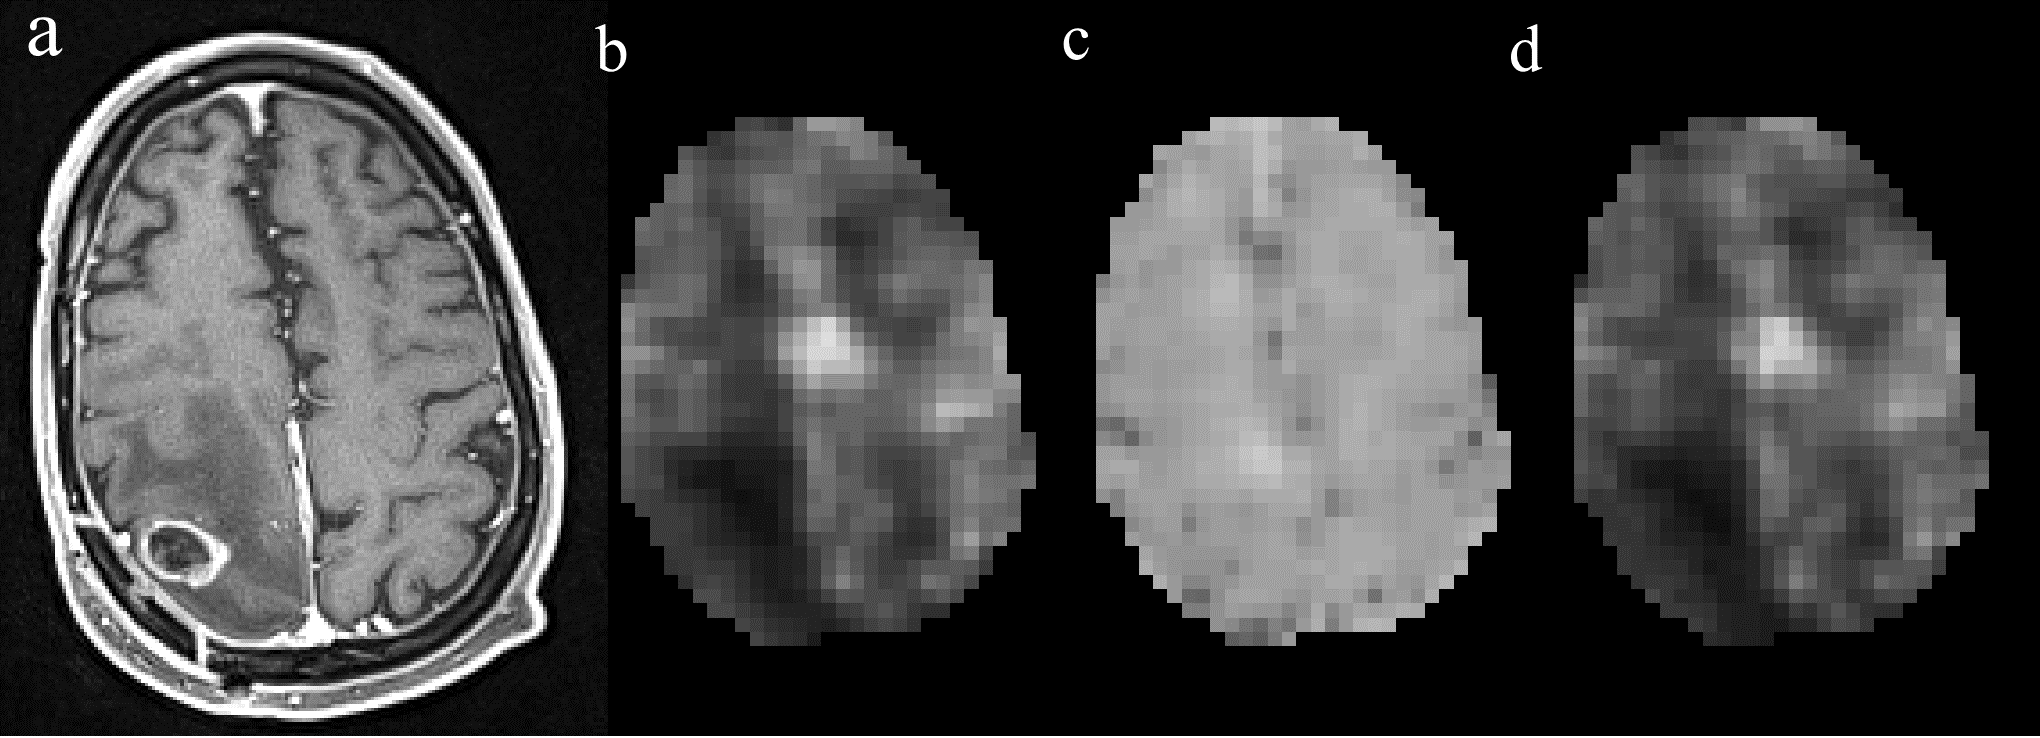
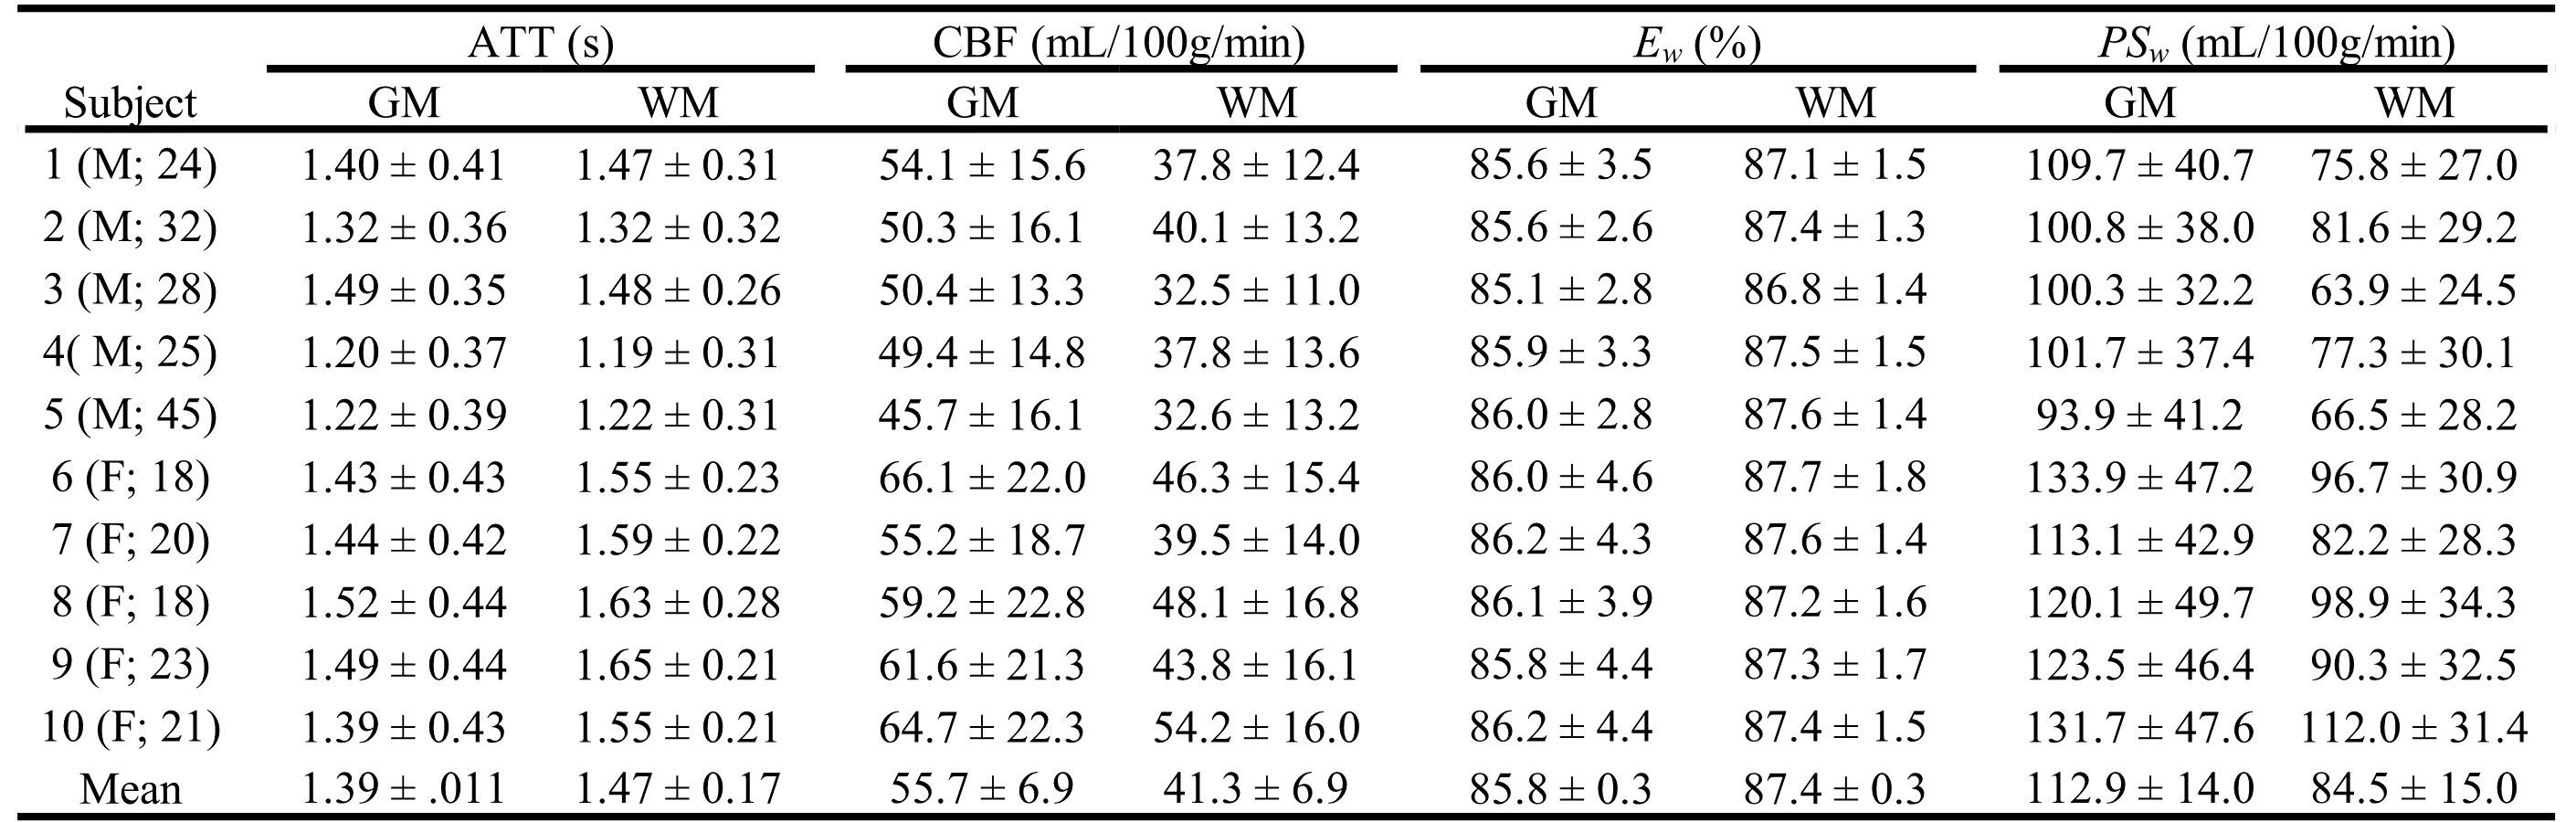
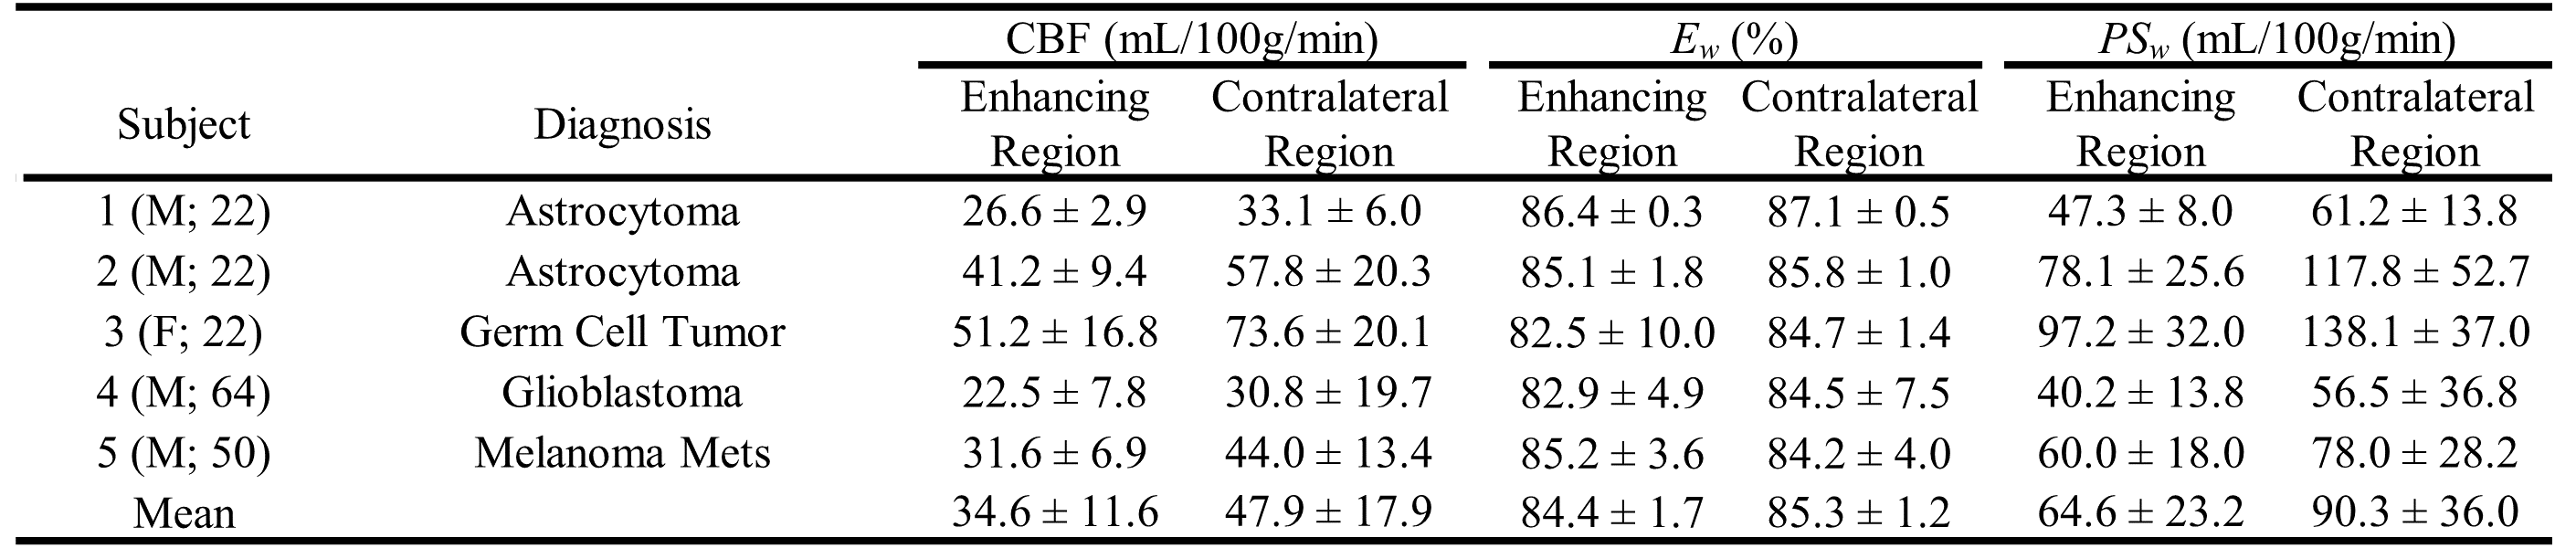
Figures 1 and 2 display the derived whole-brain BBB permeability maps from a healthy participant. Average values of ATT, CBF, Ew and PSw in GM and WM for healthy participants are listed in Table 1. PSw and CBF were significantly higher in GM than WM; Ew was significantly lower in GM than WM. Both Ew and PSw values are in good agreement with PET-based measurements2-4. Sex differences were also observed in BBB permeability with females exhibiting higher GM and WM PSw compared to male participants. No significant sex differences were observed in Ew. Figure 3 shows the IDEALS parameter maps and post-contrast T1w image from a glioblastoma patient. Table 2 lists the average Ew and PSw values for the contrast-enhancing tumor and contralateral regions. Decreased BBB water permeability was observed in contrast-enhancing regions when compared to contralateral regions, which is consistent with previously reported observations and may demonstrate a link to the hypoxic conditions associated with tumors10.Conclusion:
Encouraging initial results using the proposed IDEALS method in healthy participants and brain tumor patients was reported in this study. This novel MRI approach provides BBB water permeability maps with whole-brain coverage at comparatively high spatial and temporal resolutions without the need for a MRI contrast agent.Acknowledgements
No acknowledgement found.References
1. Hawkins BT, Davis TP. The blood-brain barrier/neurovascular unit in health and disease. Pharmacological reviews. 2005;57(2):173-185.
2. Berridge MS, Adler LP, Nelson AD, et al. Measurement of Human Cerebral Blood Flow with [15O]Butanol and Positron Emission Tomography. Journal of Cerebral Blood Flow & Metabolism. 1991;11(5):707-715.
3. Preskorn SH, Raichle ME, Hartman BK. Antidepressants alter cerebrovascular permeability and metabolic rate in primates. Science. 1982;217(4556):250-252.
4. Herscovitch P, Raichle ME, Kilbourn MR, Welch MJ. Positron Emission Tomographic Measurement of Cerebral Blood Flow and Permeability—Surface Area Product of Water Using [15O]Water and [11C]Butanol. Journal of Cerebral Blood Flow & Metabolism. 1987;7(5):527-542.
5. He X, Le T, Leuong H, DeLorenzo C, Rarsey R, Schweitzer M. Diffusion Sensitivity of 3D-GRASE Readout in ASL Perfusion. Paper presented at: ISMRM2015; Toronto, Canada.
6. Asllani I, Borogovac A, Brown TR. Regression algorithm correcting for partial volume effects in arterial spin labeling MRI. Magnetic Resonance in Medicine. 2008;60(6):1362-1371.
7. Wang J, Alsop DC, Song HK, et al. Arterial transit time imaging with flow encoding arterial spin tagging (FEAST). Magnetic Resonance in Medicine. 2003;50(3):599-607.
8. Renkin EM. Transport of potassium-42 from blood to tissue in isolated mammalian skeletal muscles. American Journal of Physiology--Legacy Content. 1959;197(6):1205-1210.
9. Crone C. The permeability of capillaries in various organs as determined by use of the ‘indicator diffusion’method. Acta Physiologica. 1963;58(4):292-305.
10. Rooney WD, Li X, Sammi MK, Bourdette DN, Neuwelt EA, Springer CS. Mapping human brain capillary water lifetime: high‐resolution metabolic neuroimaging. NMR in Biomedicine. 2015;28(6):607-623.
Figures