0179
Cerebral Metabolic Rate of Oxygen (CMRO2) mapping by a joint model of quantitative susceptibility mapping (QSM)-based method and quantitative BOLD (qBOLD)1Biomedical Engineering, Cornell University, Ithaca, NY, United States, 2Radiology, Weill Cornell Medical College, New York, NY, United States, 3Tongji Hospital, Tongji Medical College, Huazhong University of Science and Technology, Wuhan, China
Synopsis
In this work, we propose a gradient echo (GRE) based measurement of oxygen extraction fraction (OEF) based on a simultaneous modeling of the magnitude (using quantitative BOLD corrected for non-blood tissue susceptibility) and phase (based on QSM), without additional vascular challenges and empirical assumptions. Compared to methods based on QSM only and on qBOLD only, the proposed model provided better CMRO2 contrast between gray and white matter, and more uniform OEF in healthy subjects.
Purpose
Cerebral metabolic rate of oxygen (CMRO2) and oxygen extraction fraction (OEF) maps are critical to assess tissue viability in neurologic disorders such as ischemic stroke1. Several gradient echo (GRE) MRI based CMRO2 measurement methods have been proposed, phase modeling using quantitative susceptibility mapping (QSM) 2-4 or magnitude modeling using quantitative Blood Oxygenation Level Dependent imaging (qBOLD)5,6. QSM-based methods have assumed a fixed empirical linear relationship between the vein blood volume fraction ($$$v$$$) and cerebral blood flow (CBF) to obtain $$$v$$$2-4, but this relationship may vary between tissues and in disease. It is, however, available using a qBOLD analysis. On the other hand, qBOLD approximates the non-blood tissue susceptibility ($$$\chi_{nb}$$$) as identical to fully oxygenated blood5,6, thereby ignoring tissue iron stored in ferritin or myelin that contribute to the rich $$$\chi_{nb}$$$ contrast in the brain. QSM-based methods, however, acquire the $$$\chi_{nb}$$$ from data2-4. Accordingly, we propose to combine QSM and qBOLD (QSM+qBOLD) to map the OEF and CMRO2. This model combination can discard the above-mentioned empirical assumptions and additional vascular challenges.Theory and Methods
CMRO2 and OEF can be expressed.$$CMRO2=CBF\cdot OEF\cdot CaO_2$$ $$OEF=1-\frac{Y}{Y_a}$$
where $$$CaO_2$$$ is arterial oxygen concentration (7.377 μmol/ml), $$$Y_a$$$ is arterial oxygen saturation (0.98), and $$$Y$$$ is venous oxygenation. The proposed QSM+qBOLD method consists of solving $$Y^*,v^*,\chi_{nb}^*,S^{0*},R_2^*=argmin_{Y,v,\chi_{nb},S^0,R_2}\left\{|||S|-F_{qBOLD}(Y,v,\chi_{nb},S^0,R_2)||^2_2 + w\cdot ||F_{QSM}(Y,v,\chi_{nb})-QSM||^2_2\right\}$$
where $$$w$$$ is weight factor, $$$S^0$$$ the GRE signal at TE=0, and $$$R_2$$$ the cellular contribution to signal decay. Furthermore,
$$F_{qBOLD}(Y,v,\chi_{nb},S^0,R_2)=S^0\cdot e^{-R_2\cdot TE}\cdot F_{BOLD}(v,\delta\omega(Y,\chi_{nb}),TE)\cdot G(TE)$$
where $$$F_{BOLD}$$$ and $$$G$$$ are extravascular and macroscopic contribution to magnitude decay7. $$$\delta\omega$$$ is the frequency difference between deoxygenated blood and the surrounding tissue: $$\delta\omega(Y,\chi_{nb})=\frac{1}{3}\cdot \gamma \cdot B_0 \cdot \left[ \Delta\chi\cdot(1-Y)+\chi_{ba}-\chi_{nb}\right] $$
$$$\gamma$$$ is the gyromagnetic ratio (267.513 MHz/T), $$$B_0=3T$$$, $$$\Delta\chi$$$ is the susceptibility difference between fully oxygenated and fully deoxygenated blood ($$$0.357\times4\pi\times0.27$$$ ppm)6, $$$\chi_{ba}$$$ is purely oxygenated blood susceptibility (-108.3 ppb). Note that the qBOLD assumption of $$$\chi_{nb}=\chi_{ba}$$$ is not made here. Finally, $$F_{QSM}(Y,v,\chi_{nb})=\left[\frac{\chi_{ba}}{\alpha}+\psi_{Hb}\cdot \Delta\chi_{Hb}\cdot \left(-Y+\frac{1-(1-\alpha)\cdot Y_a}{\alpha}\right)\right]\cdot v + \left(1-\frac{v}{\alpha}\right)\cdot\chi_{nb}$$
where $$$\alpha$$$ is ratio between vein and total blood volume assumed (0.77), $$$\psi_{Hb}$$$ the hemoglobin volume fraction (0.0909 for tissue and 0.1197 for vein), $$$\Delta\chi_{Hb}$$$ the susceptibility difference between deoxy- and oxy-hemoglobin (12522 ppb)2-4. Note that $$$v$$$, which was estimated from CBF in QSM-based methods, is now an unknown to be determined by data.
Optimization
The five unknowns $$$Y,v,\chi_{nb},S^0,R_2$$$ were scaled by their initial guess: $$$x\mapsto\frac{x}{|x_0|}$$$. The initial guesses were: $$$Y_0$$$ estimated from the sagittal sinus2,4, $$$v$$$ based on CBF8, $$$\chi_{nb,0}=\chi_{ba}$$$5,6, and $$$S^0_0$$$ and $$$R_{2,0}$$$ obtained from a mono-exponential fit against Eq. 4 with the initial values $$$Y_0$$$, $$$v_0$$$, and $$$\chi_{nb,0}$$$. $$$w$$$ was selected using the L-curve method9. L-BFGS-M was used for constrained optimization10,11.
Validation
The QSM+qBOLD model was compared with a QSM-based method2 and qBOLD6 in 11 healthy volunteers at 3T. 3D ASL (20 cm FOV, 1.56x1.56x3.5 mm3 voxel size, 1500 ms labeling period, 1525 ms post-label delay). 3D spoiled Gradient Echo (SPGR, 0.78x0.78x1.2 mm3 voxel size, 7 echoes,TE1 =2.3 ms, ΔTE = 3.9 ms, TR=30.5 ms). QSM was generated by morphology enable dipole inversion12. All images were co-registered to QSM. T1 weighted images were used for ROI segmentation.
Results
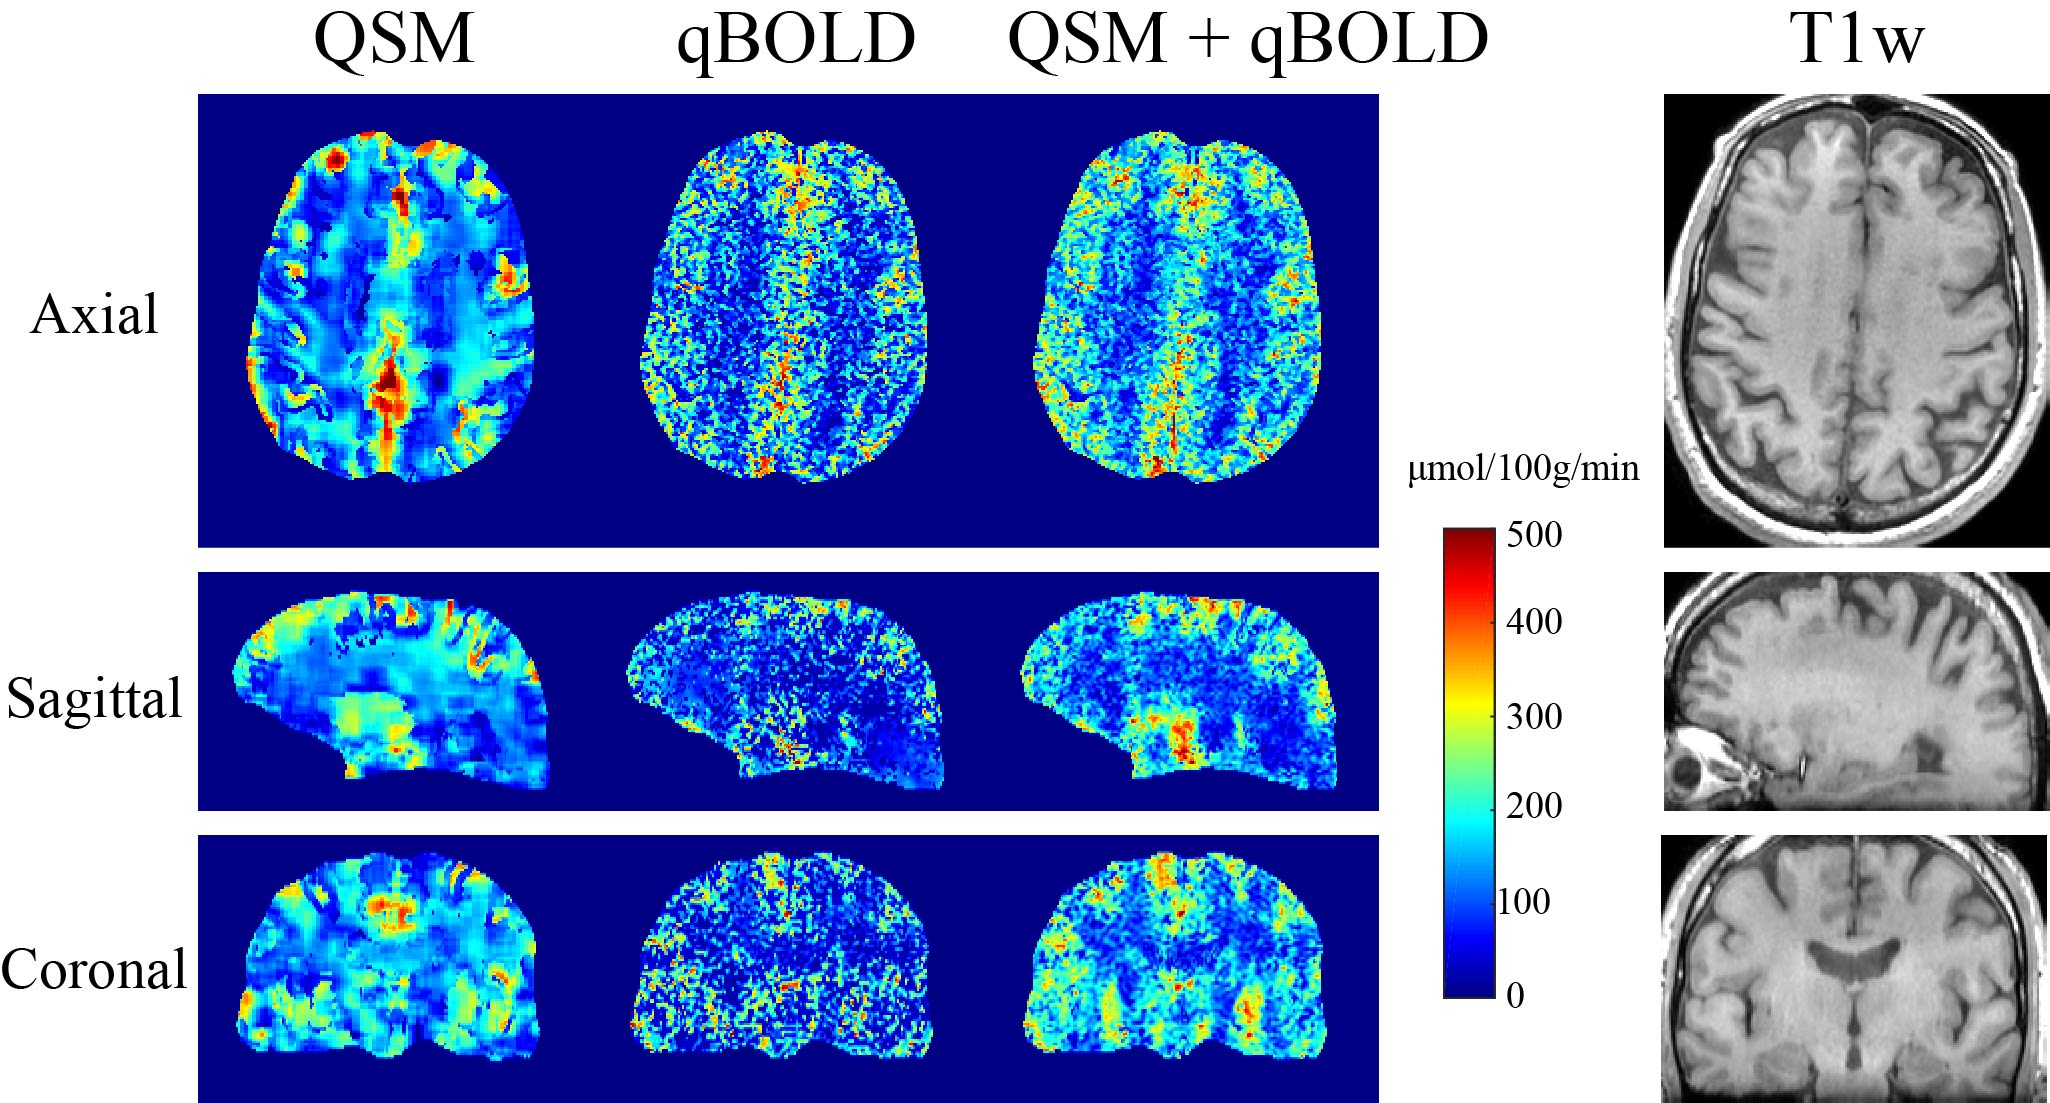
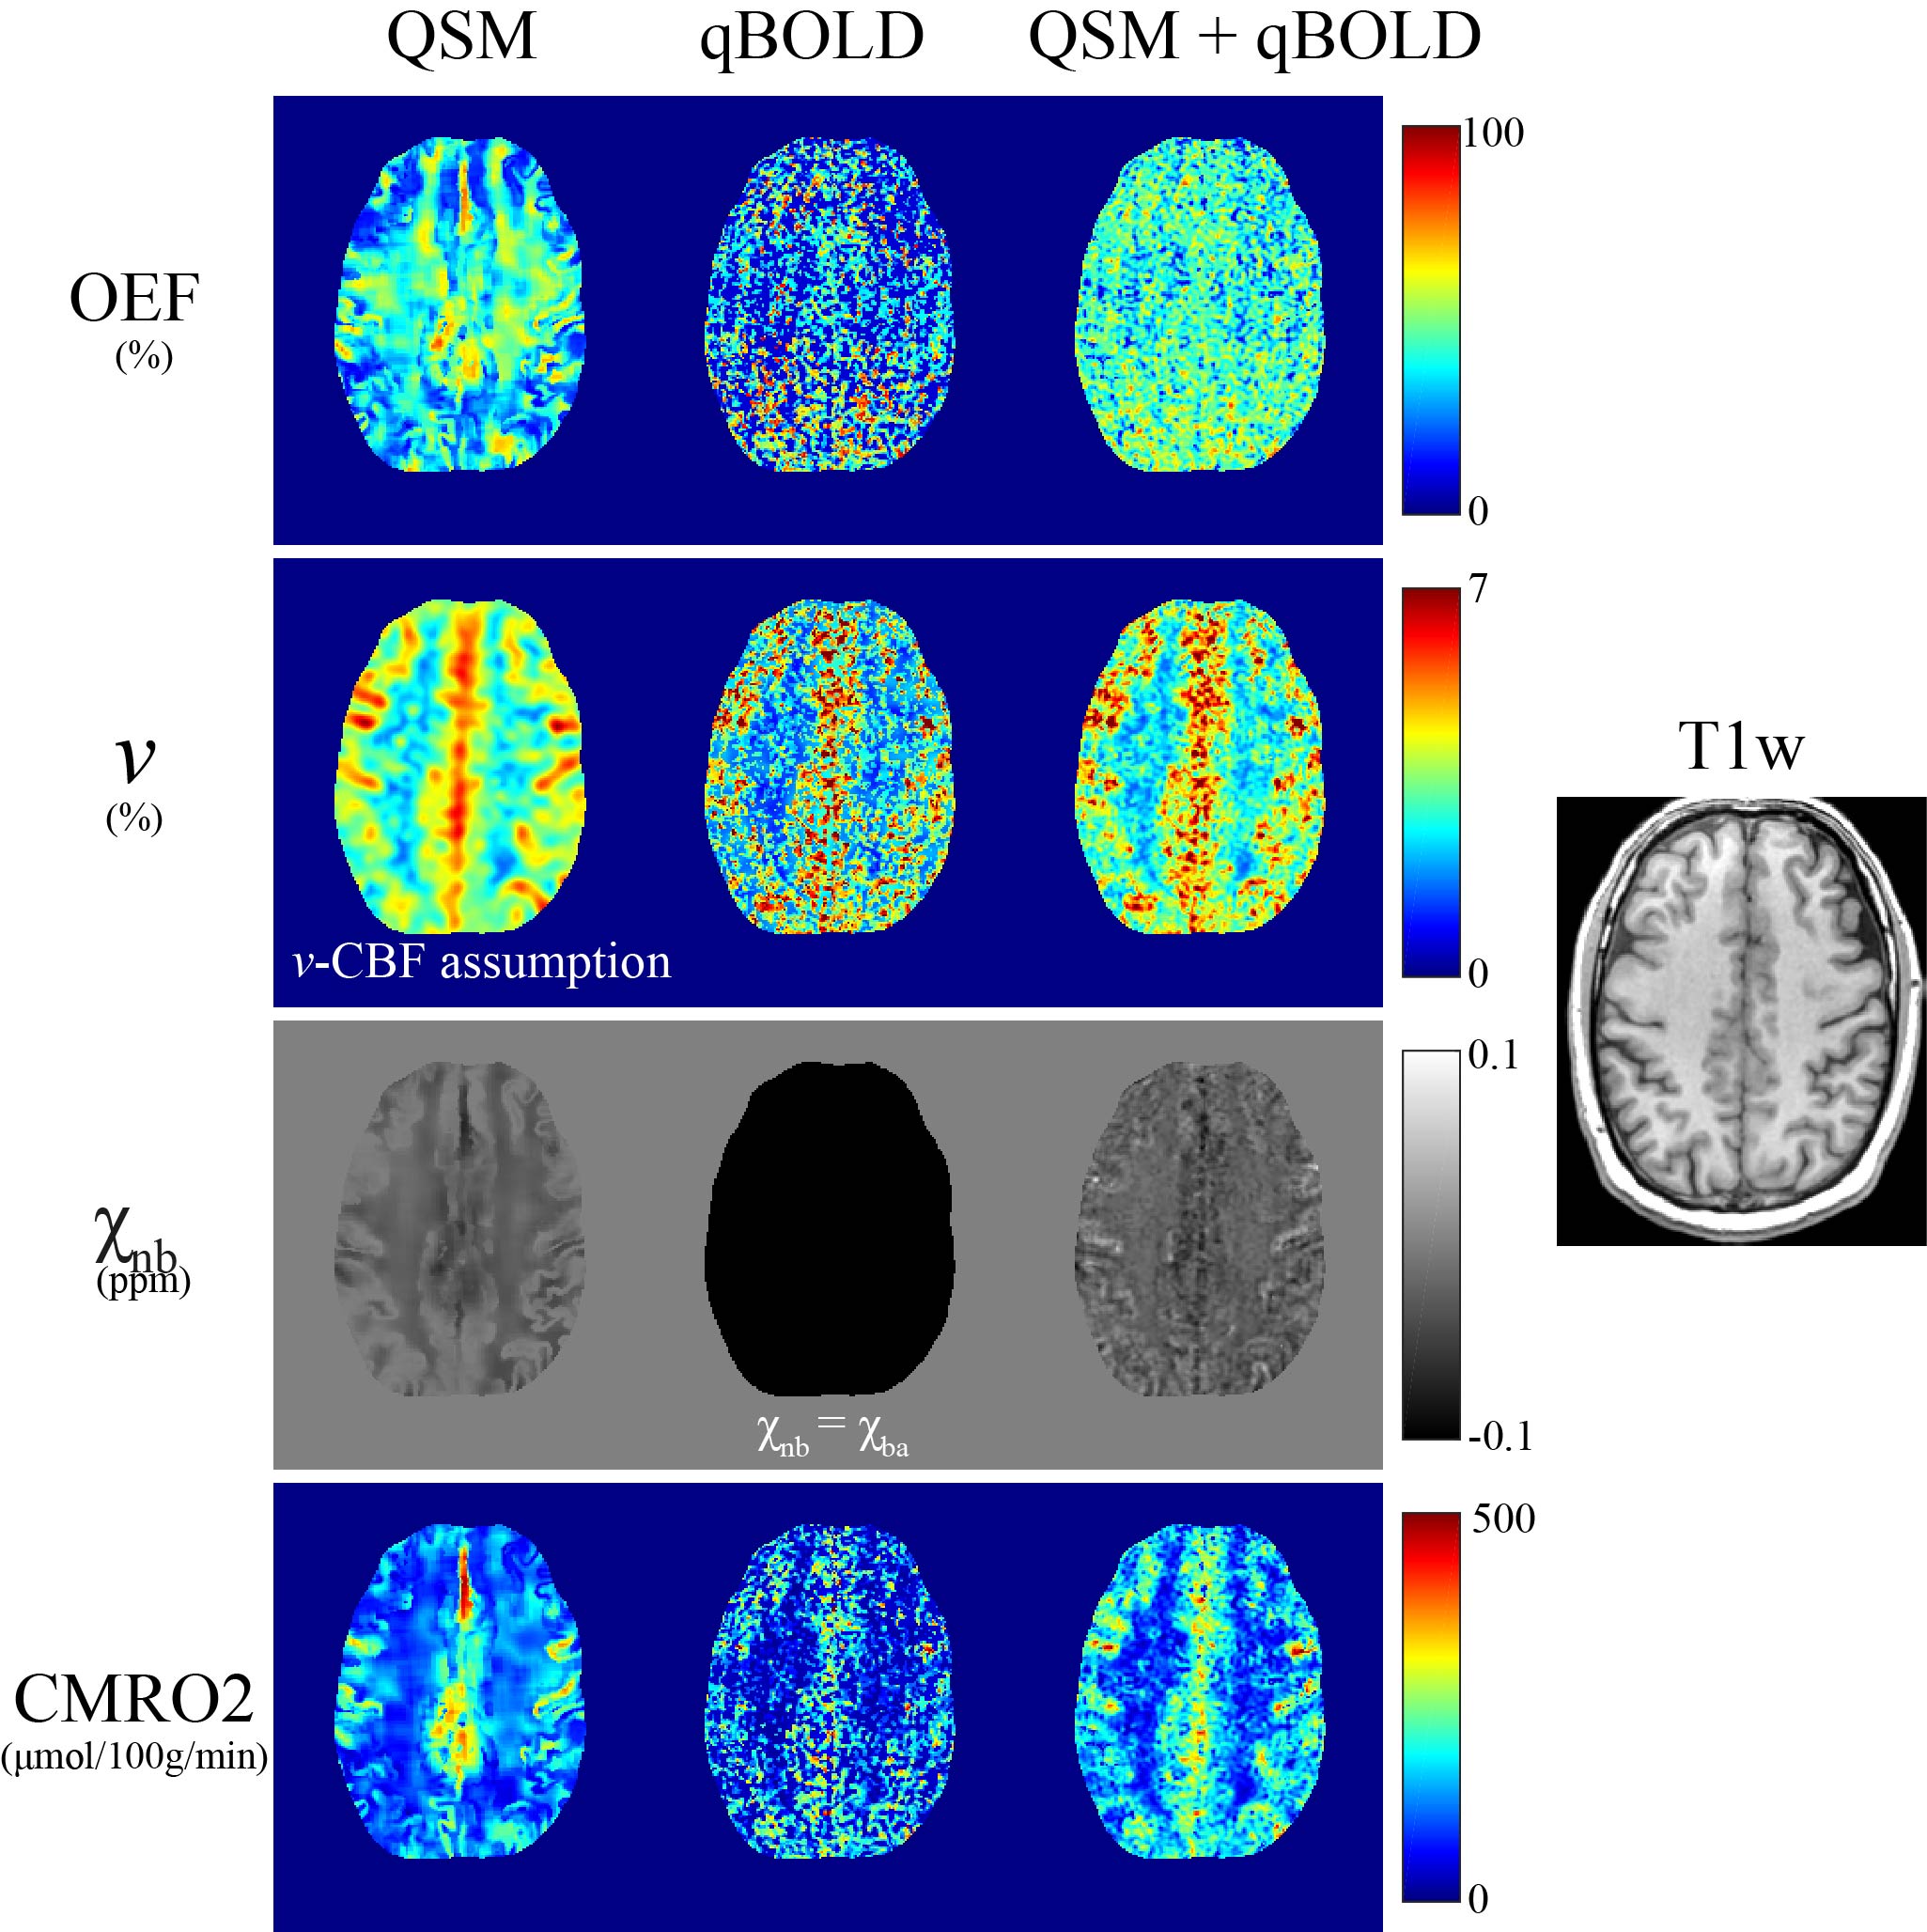
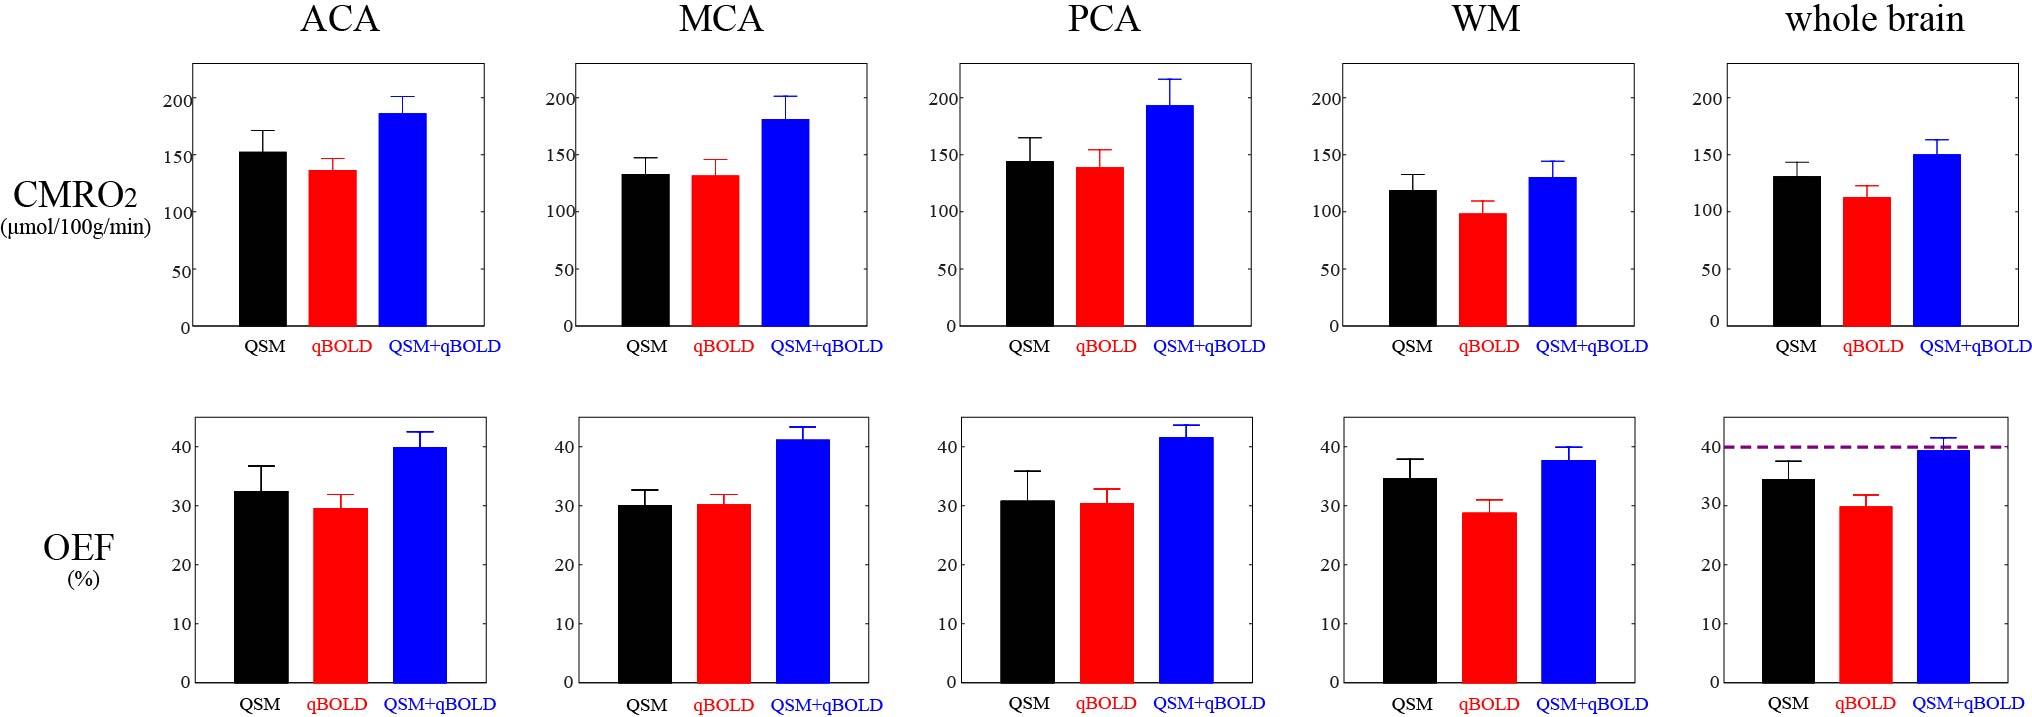
QSM+qBOLD showed higher CMRO2 contrast between cortical gray matter (CGM) and white matter (WM) than qBOLD and QSM (Figs. 1 and 3). In Figs. 2 and 3, QSM+qBOLD showed higher OEF than both QSM and qBOLD, a more uniform OEF map than QSM, a less noisy OEF map than qBOLD, and similar $$$v$$$ and $$$\chi_{nb}$$$ maps (higher in CGM than in nearby WM) to QSM.Discussion
The OEF from the proposed method is in line with prior PET studies (Fig. 3). The higher OEF than qBOLD may be explained by the inclusion of $$$\chi_{nb}$$$ as a variable (Eqs. 2 and 5). The clear GM/WM contrast using QSM+qBOLD (Fig. 2) is consistent with the known myelin content difference13. The smoothness of the QSM based CMRO2 and OEF maps (Figs. 1 and 2) are likely due to the use of the minimum local variance constraint2 needed to overcome the underdetermined system. A previously proposed combined model of QSM and qBOLD also made this assumption for the QSM term and ignored the $$$ \chi_{nb}$$$ term in $$$F_{qBOLD}$$$14. The proposed QSM+qBOLD model does not rely on either assumption.Conclusion
This study shows the feasibility of jointly modeling the phase and magnitude GRE signal for OEF and CMRO2 estimation in healthy subjects. Without any vascular challenge or empirical assumptions, QSM+qBOLD can be readily applied to study damage to vital organs caused by oxygen-deficiency, such as Alzheimer’s disease15,16, multiple sclerosis17,18, and ischemic stroke19.Acknowledgements
This work was supported by NIH grant R21EB024366, R21EY027568, R01NS095562, and S10OD021782.References
1. Gupta, A., et al., Oxygen Extraction Fraction and Stroke Risk in Patients with Carotid Stenosis or Occlusion: A Systematic Review and Meta-Analysis. American Journal of Neuroradiology, 2014. 35(2): p. 250-255.
2. Zhang, J., et al., Quantitative susceptibility mapping-based cerebral metabolic rate of oxygen mapping with minimum local variance. Magn Reson Med, 2017.
3. Zhang, J., et al., Quantitative mapping of cerebral metabolic rate of oxygen (CMRO2) using quantitative susceptibility mapping (QSM). Magnetic Resonance in Medicine, 2015. 74(4): p. 945-952.
4. Zhang, J., et al., Cerebral metabolic rate of oxygen (CMRO2) mapping with hyperventilation challenge using quantitative susceptibility mapping (QSM). Magnetic resonance in medicine, 2017. 77(5): p. 1762-1773.
5. Yablonskiy, D.A., A.L. Sukstanskii, and X. He, BOLD-based Techniques for Quantifying Brain Hemodynamic and Metabolic Properties – Theoretical Models and Experimental Approaches. NMR Biomed, 2013. 26(8): p. 963-986.
6. Ulrich, X. and D.A. Yablonskiy, Separation of cellular and BOLD contributions to T2* signal relaxation. Magnetic resonance in medicine, 2016. 75(2): p. 606-615.
7. X., U. and Y. DA., Enhancing image contrast in human brain by voxel spread function method. In Proceedings of the 22nd Annual Meeting of ISMRM. Milan, Italy, Abstract 3197.
8. Leenders, K.L., et al., Cerebral blood flow, blood volume and oxygen utilization. Normal values and effect of age. Brain, 1990. 113 ( Pt 1): p. 27-47.
9. Hansen, P.C., Analysis of Discrete Ill-Posed Problems by Means of the L-Curve. SIAM Review, 1992. 34(4): p. 561-580.
10. Liu, D.C. and J. Nocedal, On the limited memory BFGS method for large scale optimization. Mathematical programming, 1989. 45(1): p. 503-528.
11. Byrd, R.H., et al., A limited memory algorithm for bound constrained optimization. SIAM Journal on Scientific Computing, 1995. 16(5): p. 1190-1208.
12. Wang, Y. and T. Liu, Quantitative susceptibility mapping (QSM): Decoding MRI data for a tissue magnetic biomarker. Magn Reson Med, 2015. 73(1): p. 82-101.
13. Langkammer, C., et al., Susceptibility induced gray-white matter MRI contrast in the human brain. Neuroimage, 2012. 59(2): p. 1413-9.
14. Cho, J., et al., Optimal quantitative mapping of Cerabral Metabolic Rate of Oxygen (CMRO2) by combining quantitative susceptibility mapping (QSM)-based method and quantitative BOLD (qBOLD). In Proceedings of the 25th Annual Meeting of ISMRM. Hawaii, USA, Abstract 1110.
15. Sun, X., et al., Hypoxia facilitates Alzheimer's disease pathogenesis by up-regulating BACE1 gene expression. Proc Natl Acad Sci U S A, 2006. 103(49): p. 18727-32.
16. Acosta-Cabronero,
J., et al., In vivo quantitative
susceptibility mapping (QSM) in Alzheimer's disease. PLoS One, 2013. 8(11): p. e81093.
17. Trapp, B.D.
and P.K. Stys, Virtual hypoxia and
chronic necrosis of demyelinated axons in multiple sclerosis. Lancet
Neurol, 2009. 8(3): p. 280-91.
18. Wisnieff, C., et al., Quantitative susceptibility mapping (QSM) of white matter multiple sclerosis lesions: Interpreting positive susceptibility and the presence of iron. Magn Reson Med, 2015. 74(2): p. 564-70.
19. Kudo, K., et al., Oxygen extraction fraction measurement using quantitative susceptibility mapping: Comparison with positron emission tomography. J Cereb Blood Flow Metab, 2016. 36(8): p. 1424-33.
20. Carpenter, D.A., et al., Cerebral oxygen metabolism after aneurysmal subarachnoid hemorrhage. J Cereb Blood Flow Metab, 1991. 11(5): p. 837-44.
21. Yamauchi, H., et al., Significance of increased oxygen extraction fraction in five-year prognosis of major cerebral arterial occlusive diseases. The Journal of Nuclear Medicine, 1999. 40(12): p. 1992.
22. Michael N. Diringer, et al., No reduction in cerebral metabolism as a result of early moderate hyperventilation following severe traumatic brain injury. Journal of neurosurgery, 2000. 92(1): p. 7-13.
23. Raichle, M.E., et al., A default mode of brain function. Proceedings of the National Academy of Sciences, 2001. 98(2): p. 676-682.
Figures