0177
Interleaved qBOLD: Combining Extravascular R2’ and Intravascular R2 Mapping for Improved Estimation of Brain Hemodynamic Parameters1Radiology, University of Pennsylvania, Philadelphia, PA, United States
Synopsis
In qBOLD, the accuracy of local deoxygenated blood volume (DBV) and hemoglobin oxygen saturation (Yv) maps is impaired because of coupling of these two parameters in the signal model. Here, we introduce an interleaved qBOLD method that combines extravascular R2’ and intravascular R2 mapping in a single pulse sequence. Prior knowledge for DBV and Yv is obtained from the velocity-selective-spin-labeling module in the sequence, subsequently used as priors for qBOLD processing. Data obtained in eight subjects demonstrates significantly improved performance yielding plausible values averaging 60.1±3.3% for Yv and 3.1±0.5% and 2.0±0.4% for DBV in gray and white matter, respectively.
Introduction
Quantitative BOLD (qBOLD)1,2 enables local estimation of deoxygenated blood volume (DBV) and hemoglobin oxygen saturation (Yv) by means of an analytical model for the temporal evolution of the extravascular signal in the presence of blood vessel networks, valid in the static dephasing regime3, described as:
$$S(t)=S_{0}e^{-R_{2,t}t-DBV\cdot f(t/t_{c})} (1) $$
$$f(t/t_{c})=\frac{1}{3}\cdot\int_{0}^{1}u^{-2}\cdot(u+2)\cdot\sqrt{1-u}\cdot(1-J_{0}(1.5\cdot u\cdot t/t_{c}))du (2)$$
$$t_c^{-1}=\frac{4\pi}{3}\gamma\cdot B_{0}\cdot \Delta \chi_{0}\cdot Hct\cdot(1-Y_{v}) (3)$$
Here, $$$\Delta \chi_{0}$$$ is the susceptibility difference between fully oxygenated and deoxygenated red blood cells ($$$\Delta \chi_{0}$$$~ 0.27 ppm in CGS units4). However, DBV and Yv are mutually coupled in the signal model, making the parameter estimation challenging to achieve a unique set of solutions5. To address this issue, we had previously proposed to combine conventional qBOLD (based on extravascular R2’ mapping) with a velocity-selective-spin-labeling (VSSL)-based venous R2 (or Yv upon conversion via R2-Yv calibration) measurement6 to obtain prior information of Yv in the qBOLD parameter estimation7. Here, the method was further developed in that, besides the Yv prior, venous cerebral blood volume (CBVv) was also extracted from the VSSL data acquisition as an initial estimate of DBV in the qBOLD processing.
Methods
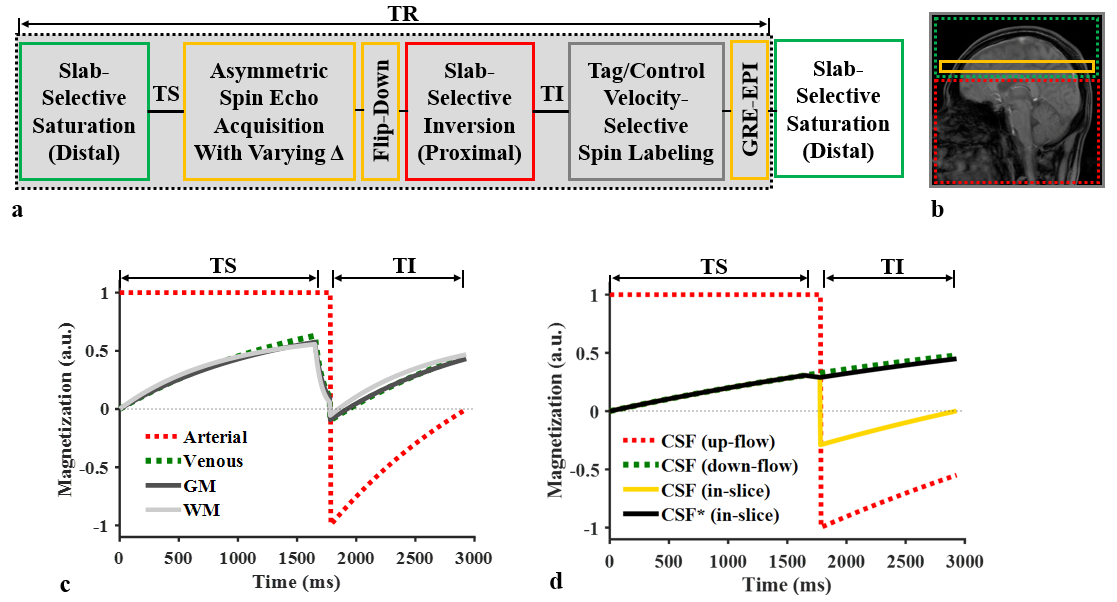
Imaging technique: Figures 1a,b show a schematic of the proposed pulse sequence with six blocks to achieve: 1) sensitivity to deoxyhemoglobin-induced modulations of extravascular R2’ using an asymmetric spin echo (ASE) sequence, and 2) selective labeling of venous blood spins via VSSL. Furthermore, RF pulses for saturation, flip-down, and inversion are applied to pertinent spatial regions judiciously timed so as to suppress both arterial blood and CSF (Fig. 1c, 1d) and thus ensuring exclusive labeling of venous blood in the VSSL module.
Estimation of CBVv and Yv via VSSL: Voxel signals in control (Scon) and tag (Stag) scans with the velocity-encoding gradients turned off and on, respectively, can be expressed as:
$$S_{con}=C\cdot\left((1-CBV_{v})\cdot M_{z,t}^{-1}\cdot e^{-\frac{T_{VSSL}}{T_{2,t}}}+CBV_{v}\cdot M_{z,v}^{-1}\cdot e^{-\frac{T_{VSSL}}{T_{2,v}}}\right) (4)$$
$$S_{tag}=C\cdot(1-CBV_{v})\cdot M_{z,t}^{-1}\cdot e^{-\frac{T_{VSSL}}{T_{2,t}}} (5)$$
where C is the hardware-determined voxel scaling, $$$M_{z,t}^{-1}$$$ and $$$M_{z,v}^{-1}$$$ represent longitudinal magnetization of brain tissue and venous blood, respectively, immediately prior to VSSL, and TVSSL is the duration of the VSSL block. The control/tag difference yields:
$$S_{diff}=S_{con}-S_{tag}=C\cdot CBV_{v}\cdot M_{z,v}^{-1}\cdot e^{-\frac{T_{VSSL}}{T_{2,v}}} (6)$$
Multiple pairs of control/tag scans with varying TVSSL enables estimation of T2,v using Eq. (6) and subsequently Yv via T2,v – Yv calibration6. The normalization of Sdiff to Scon yields CBVv as:
$$\frac{S_{diff}}{S_{con}}=\frac{ CBV_{v}\cdot M_{z,v}^{-1}\cdot e^{-\frac{T_{VSSL}}{T_{2,v}}}}{(1-CBV_{v})\cdot M_{z,t}^{-1}\cdot e^{-\frac{T_{VSSL}}{T_{2,t}}}+CBV_{v}\cdot M_{z,v}^{-1}\cdot e^{-\frac{T_{VSSL}}{T_{2,v}}}}\approx CBV_{v} (7)$$
Here, two approximations were made: 1) $$$T_{2,t} \approx T_{2,v}$$$ valid at a 3 T field strength and 2) $$$M_{z,t}^{-1} \approx M_{z,v}^{-1}$$$ based on the numerical simulation of Bloch equation (Fig. 1c).
Data acquisition: Data were acquired at 3 T (Siemens Tim Trio) in eight healthy subjects (mean age = 31 ± 7 years, 4 females) for an imaging slice locating immediately superior to the corpus callosum. Imaging parameters: TR = 3000 ms, TI = 1150 ms, TS = 1650 ms, FOV = 2402 mm2, slice thickness = 6 mm, matrix size = 642, and phase partial Fourier = 6/8. Twelve sets of ASE signals were acquired with SE temporal offsets (Δ) of 0, 3, 6,…, 33 ms. A pair of tag and control VSSL scans were repeated with TVSSL = 30 ms, 60 ms, 90 ms, 120 ms. Total imaging time was 10 min with two signal averages. Additionally, data were acquired using a 3D dual-echo GRE pulse sequence to obtain high-resolution magnitude images for brain segmentation and a B0 field map for correction of macroscopic field inhomogeneities in ASE signals.
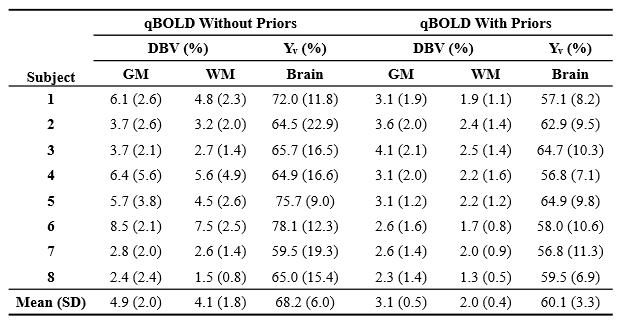
Data Processing: Gaussian smoothing with a 3 x 3 kernel size was applied to all acquired images. CBVv and Yv parameter maps, derived by VSSL, served as priors for DBV and Yv in the qBOLD processing in which acquired ASE signals in the given range of Δ were fitted to the model in Eqs. (1-3). For comparison, conventional qBOLD processing was also performed with no priors. Extracted DBV and Yv in each voxel were averaged over GM and WM masks and over the entire brain, respectively, in the eight study subjects and tabulated.
Results
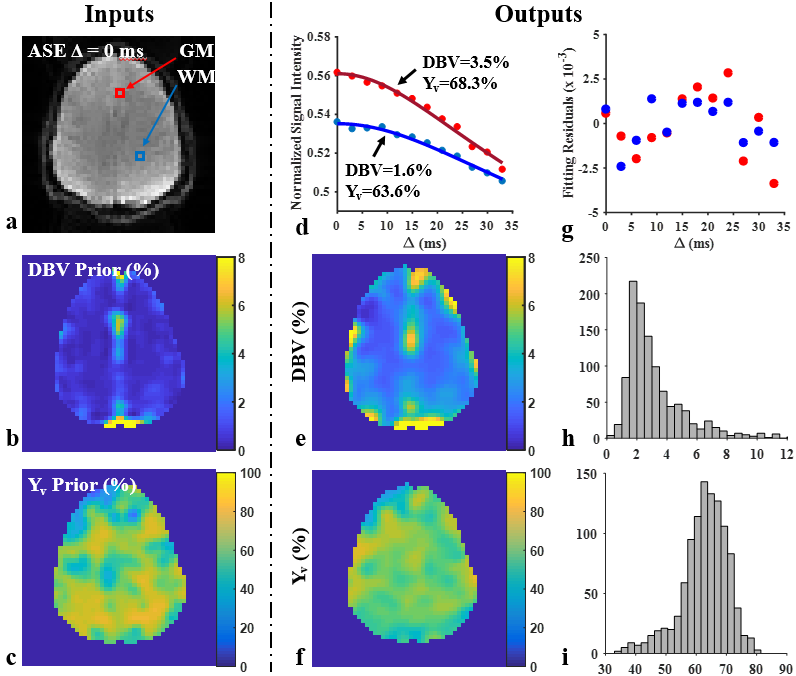
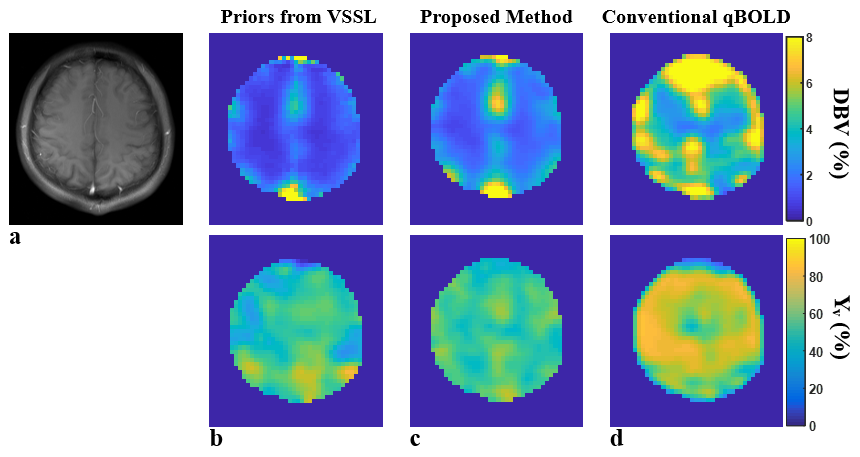
Figures 2 shows input and output data of the proposed qBOLD processing (see details in the legend). Figure 3 displays qBOLD parameter maps from the proposed method (Fig. 3c) that employs priors from the VSSL component (Fig. 3b), in comparison to conventional technique (Fig. 3d). Table 1 lists regional means and standard deviations of the two parameters estimated from conventional and proposed qBOLD methods in the eight subjects.Discussion and Conclusions
The results suggest that the proposed interleaved qBOLD method is a promising alternative to the conventional approach for regional estimation of brain hemodynamic parameters. The method’s current limitation of being single-slice may be overcome via 3D encoding or multi-band MRI techniques8.Acknowledgements
NIH grants RO1-HL122754, RO1-HL109545, R21-NS082953References
1. An HY, Lin WL. Quantitative measurements of cerebral blood oxygen saturation using magnetic resonance imaging. J Cereb Blood Flow Metab 2000; 20:1225-1236.
2. He X, Yablonskiy DA. Quantitative BOLD: mapping of human cerebral deoxygenated blood volume and oxygen extraction fraction: default state. Magn Reson Med. 2007;57:115-126.
3. Yablonskiy DA, Haacke EM, Theory of NMR signal behavior in magnetically inhomogeneous tissues: the static dephasing regime. Magn Reson Med. 1994;32: 749-763.
4. Jain V, Abdulmalik O, Propert KJ, Wehrli FW. Investigating the magnetic susceptibility properties of fresh human blood for noninvasive oxygen saturation quantification. Magn Reson Med. 2012;68:863-867.
5. Sedlacik J, Reichenbach JR. Validation of quantitative estimation of tissue oxygen extraction fraction and deoxygenated blood volume fraction in phantom and in vivo experiments by using MRI. Magn Reson Med. 2010;63:910-921.
6. Lu H, Xu F, Grgac K, Liu P, Qin Q, van Zijl P. Calibration and Validation of TRUST MRI for the Estimation of Cerebral Blood Oxygenation. Magn Reson Med. 2012;67:42-49
7. Lee H, Li C, Englund EK, Wehrli FW. Quantitative BOLD with interleaved acquisitions for estimation of extravascular R2’ and intravascular R2 with phase-sensitive CSF suppression. 25th ISMRM 2017;76
8. Feinberg, DA, Setsompop K, Ultra-fast MRI of the human brain with simultaneous multi-slice imaging. J Magn Reson. 2013;229:90-100
Figures