0167
On pseudo-concomitant fields caused by gradient coil vibrations1Dept. of Radiology, Medical Physics, Medical Center University of Freiburg, Faculty of Medicine, Freiburg, Germany, 2Institute of Biomedical Engineering, National Taiwan University, Taipei, Taiwan
Synopsis
We demonstrate that a negative quadratic phase accrual, which we term a pseudo-concomitant field, is likely to be caused by gradient vibration and has a nearly constant spatial distribution. Accounting for this effect may be of importance for phase-sensitive MR applications utilizing strong gradients, such as flow imaging.
Introduction
In magnetic resonance imaging, three gradient coils are used to create magnetic fields such that their Bz component changes linearly. However, a perfect linearly-varying z-component of a magnetic field without transverse components is physically infeasible1. The inevitable transverse (x,y) components of the magnetic field of a gradient coil cause a quadratic increase of the precession frequency upon the increasing gradient strength. For symmetric gradient coils, the concomitant field can be estimated theoretically2. In this study, we empirically examined the accuracy of the effects predicted by the theory of concomitant field and found a negative quadratic precession frequency trend near the iso-center upon the gradient strength increase. This surprising result was in contradiction to the conventional prediction of the concomitant field effect, which is expected to be always positive. We attribute this observation to gradient coil vibration and term this new phenomenon pseudo-concomitant field. This discovery is important for MR applications relying on accurate and quantitative phase data.Methods
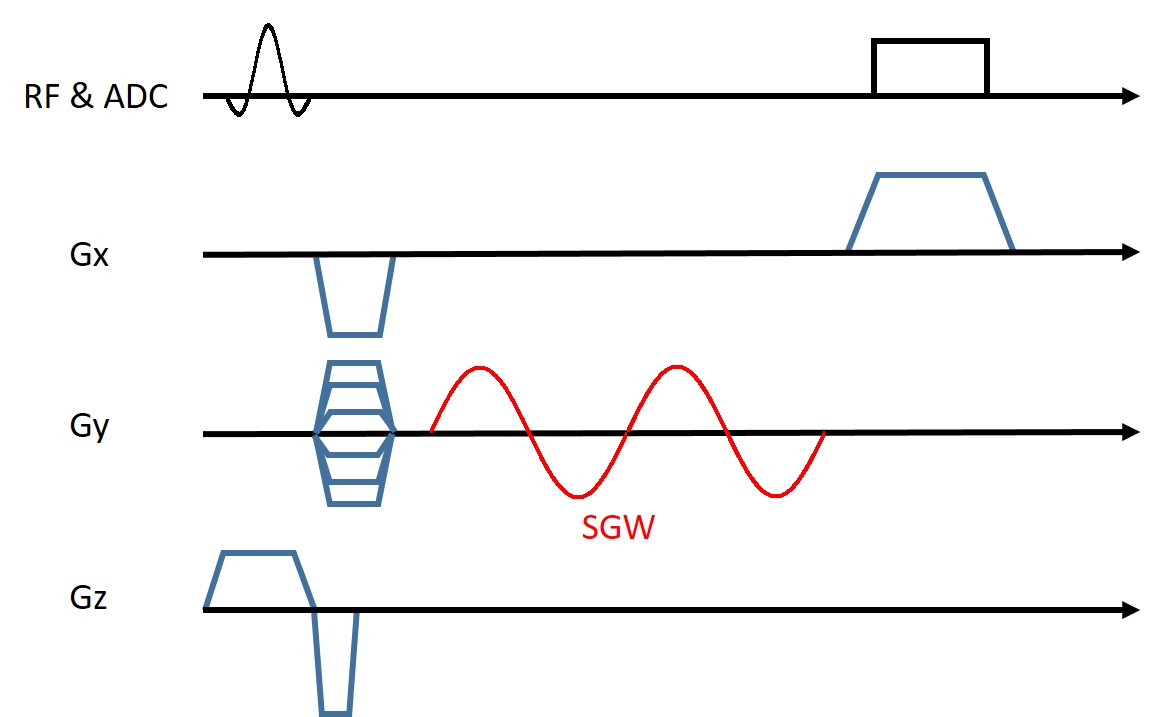
We used a modified gradient echo pulse sequence to measure effects of the transverse magnetic field and gradient coil vibration (Figure1). Sinusoidal gradient waveforms (SGW) with durations of 10ms, 20ms, and 30ms and at frequencies varying between 100Hz to 1500Hz in steps of 100Hz were used to encode the effect. Measurements using two polarities of SGW and without SGW were used and combined to eliminate the effect of eddy current and static off-resonance. The accumulated phase from SGW was estimated by:
$$$Phase_{accumulated}=(Phase_{positiveSGW}+Phase_{negativeSGW}-2\times Phase_{noSGW})/2$$$
The accumulated phases during first, second, and third 10ms interval of the 30ms duration were estimated by the phase difference between 10ms, 20ms and 30ms durations. Separate measurements with homemade field probes3 and a phantom were performed on a 3T scanner (Prisma, Siemens). Field probe was placed near the iso-center and all the measurements were done without image encoding gradients (blue waveforms in Figure 1). For the phantom measurement, the experimental parameters were TR/TE=100ms/15ms,resolution=3mm,flip angle=50o.
Results
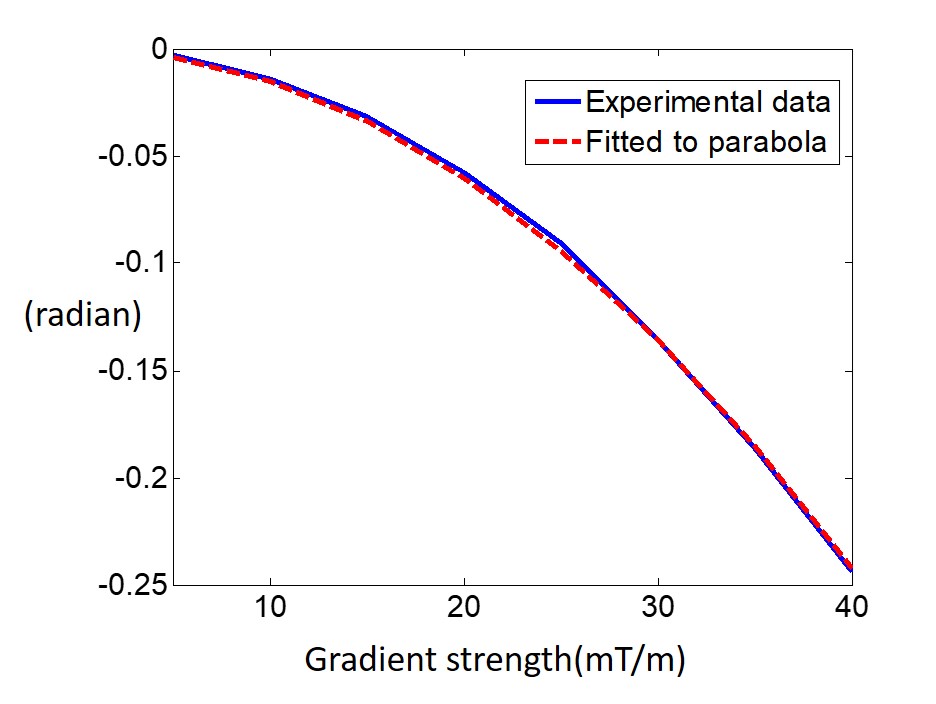
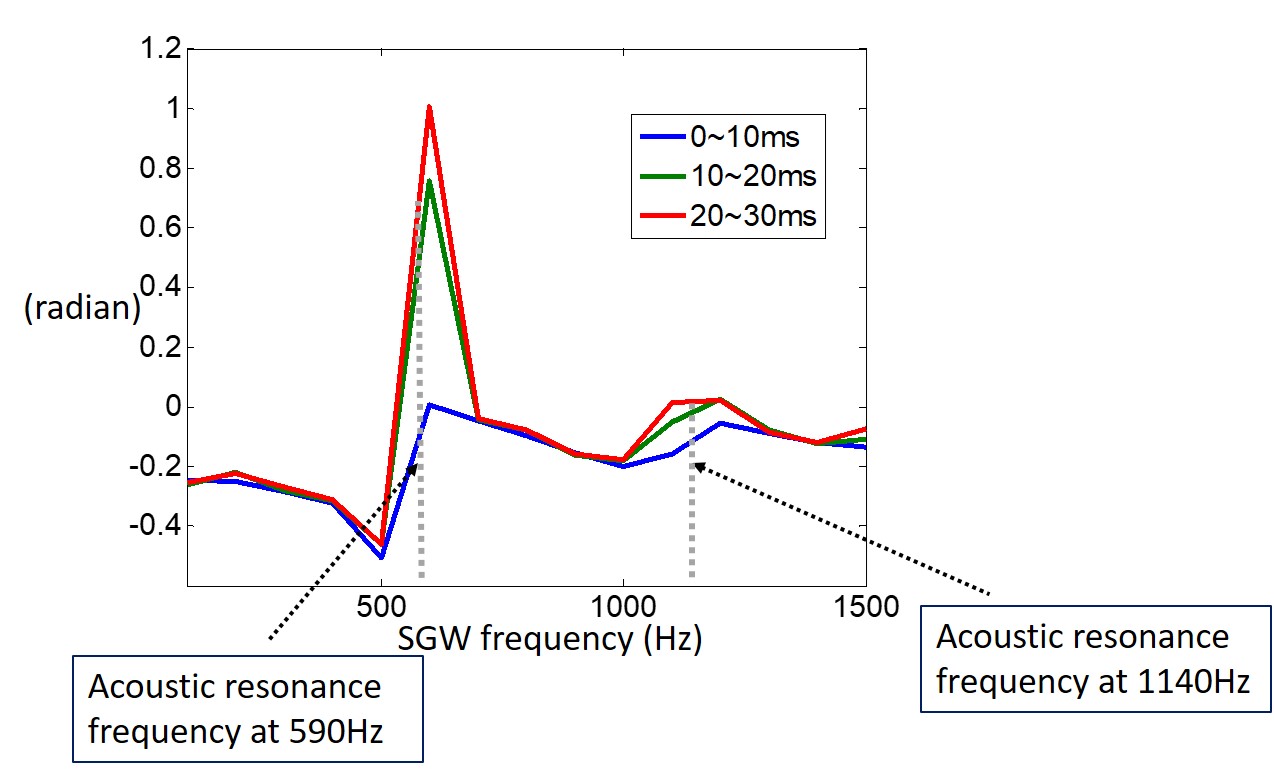
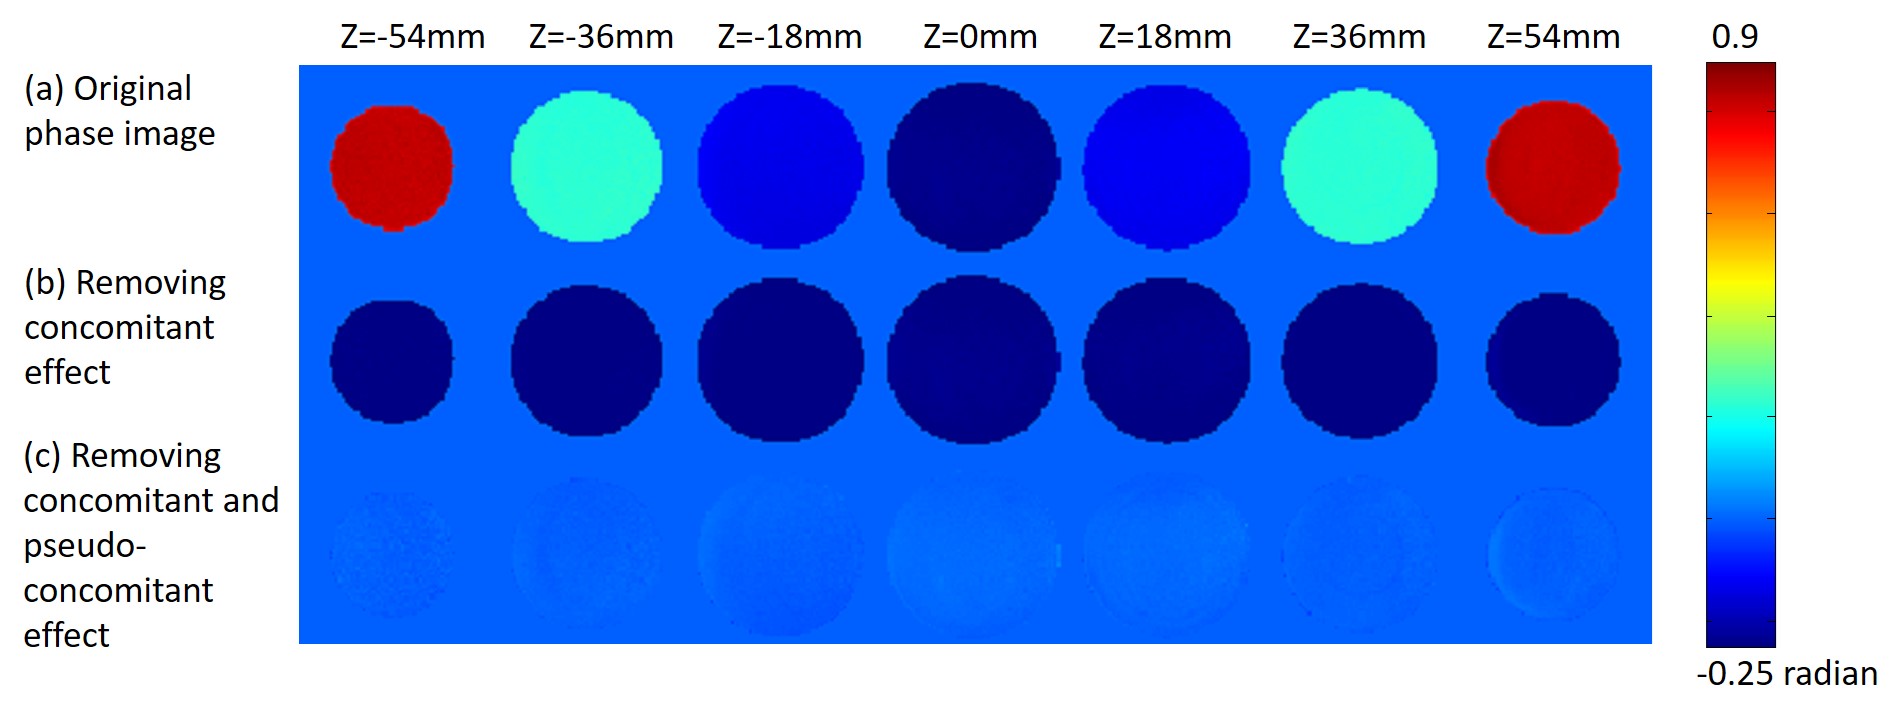
For the measurement with field probes placed near the iso-center, the accumulated phase using the 100Hz SGW decreased quadratically with the gradient strength (Figure 2). The accumulated phase depended on the frequency of SGW (Figure 3). From the lowest frequency, the phase was negative and gradually decreased until 500Hz. After the first acoustic resonance frequency, the phase became large and positive. Furthermore, the accumulated phases during the first, second, and third 10-ms intervals of the 30ms SGW were different near two acoustic resonance frequencies but similar otherwise. Figure 4a shows the phase images encoded with 10ms sinusoidal gradient at 100Hz. The phase was -0.498 on average at the z=0 plane and increased quadratically along the z-direction. After removing the expected effect of concomitant fields, the phase is nearly constantly negative across all slices(Figure4b). The remaining phase caused by pseudo-concomitant field can be further removed by the phase estimated from field probes (Figure 4c).Discussion
The gradient coil displacement is proportional to the change in force, which is proportional to the gradient strength. The phase offset due to gradient coil displacement is the product of gradient coil displacement and the gradient strength. This explains the quadratic relation between the accumulated phase and the gradient strength observed in our experiments. This relation allowed us to estimate the gradient coil displacement. For example, based on the phase estimated using a 100Hz SGW, the gradient coil moved about 4.77 micrometers at 40mT/m gradient strength. The frequency dependent phase accumulation in Figure 3 further demonstrated that this effect is caused by gradient vibration: Around the first acoustic resonance frequency, the accumulated phase was larger and its sign reversed. This can be explained by a simple vibration model, where the object was in phase with the vibration force when driven below the resonance frequency and 180o out of phase when driven higher than the resonance frequency. Furthermore, there was a larger difference between the phase accumulated during the first, second, and third 10 ms intervals of the 30 ms SGW near two acoustic resonance frequencies, because it took longer for the vibration to reach the steady state near the resonance frequency. Correction of pseudo-concomitant field may be important for phase contrast imaging. For the phantom data, SGW was equivalent to a velocity encoding gradient with VENC=1.84cm/s and the velocity bias caused by pseudo-concomitant field was 0.14cm/s, which is 7.6% of VENC.Conclusion
When measuring the concomitant field, the pseudo-concomitant field is also present. This phenomenon, to our best knowledge, has never been explained. We demonstrate that the pseudo-concomitant field is caused by gradient vibration and has nearly a constant distribution. By describing this phase disturbance more accurately, one can improve quantitative phase-contrast imaging.Acknowledgements
This work was partially supported by Ministry of Science and Technology, Taiwan (103-2628-B-002-002-MY3, 105-2221-E-002-104, 106-2911-I-002-502), and the Academy of Finland (No. 298131).References
1. Norris, D. G. & Hutchison, J. M. Concomitant magnetic field gradients and their effects on imaging at low magnetic field strengths. Magnetic resonance imaging 8, 33-37 (1990).
2. Bernstein, M. A. et al. Concomitant gradient terms in phase contrast MR: analysis and correction. Magnetic resonance in medicine 39, 300-308 (1998).
3. Chu, Y.-H., Hsu, Y.-C. & Lin, F.-H. Decoupled dynamic magnetic field measurements improves diffusion-weighted magnetic resonance images. Scientific Reports 7, 11630 (2017).
Figures