0163
Quantification of Phosphatidylcholine in the gall bladder using 31P MRSI suggest differences in biliary disorders: A Pilot Study.1Division of Endocrinology and Metabolism, Department of Medicine III, Medical University of Vienna, Vienna, Austria, 2High-field MR Centre, Department of Biomedical Imaging and Image-guided Therapy, Medical University of Vienna, Vienna, Austria, 3Division of Gastroenterology and Hepatology, Department of Medicine III, Medical University of Vienna, Vienna, Austria, 4Center for Biomedical Imaging, Department of Radiology, New York University School of Medicine, New York, NY, United States, 5Faculty of Healthcare, University of Prešov, Prešov, Slovakia, 6Department of Radiology, General Hospital of Levoča, Levoča, Slovakia, 7Christian Doppler Laboratory for Clinical Molecular MR Imaging, Vienna, Austria
Synopsis
This study focuses on quantification of phosphatidylcholine (PtdC) in the gall bladder and investigates concentration differences between biliary pathologies and healthy subjects. Significant different PtdC content was detected in patients suffering from primary sclerosing cholangitis (PSC). Subjects with primary biliary cholangitis (PBC) showed high variances in PtdC concentration. Even though, the PSC and control group are relatively small our results justify for further ongoing studies on this topic.
Purpose
Phosphatidylcholine (PtdC) is the major component detectable
with 31P MR spectroscopy (MRS) in human bile1. Changes in
its concentration may indicate altered cellular metabolism2.
Disturbed biliary PtdC secretion may point towards pathologies in the bile duct
or liver3. Investigating the PtdC concentration in the gall bladder
and comparing patients suffering from certain diseases such as primary
sclerosing cholangitis (PSC) and primary biliary cholangitis (PBC) with
relationship to a healthy control group may help understanding pathogenesis on
a molecular basis. Spectral enhancement can be achieved by the use of
ultra-high fields for improved spectral resolution and SNR per time unit for
the price of stronger B1 inhomogeneity4. Thus, proper
positioning of the surface coil and robust approach to signal quantification is
very important. This study focuses on quantification of PtdC in the gall
bladder and comparing patient groups (PSC, PBC) with a healthy volunteers.
Subjects/Methods
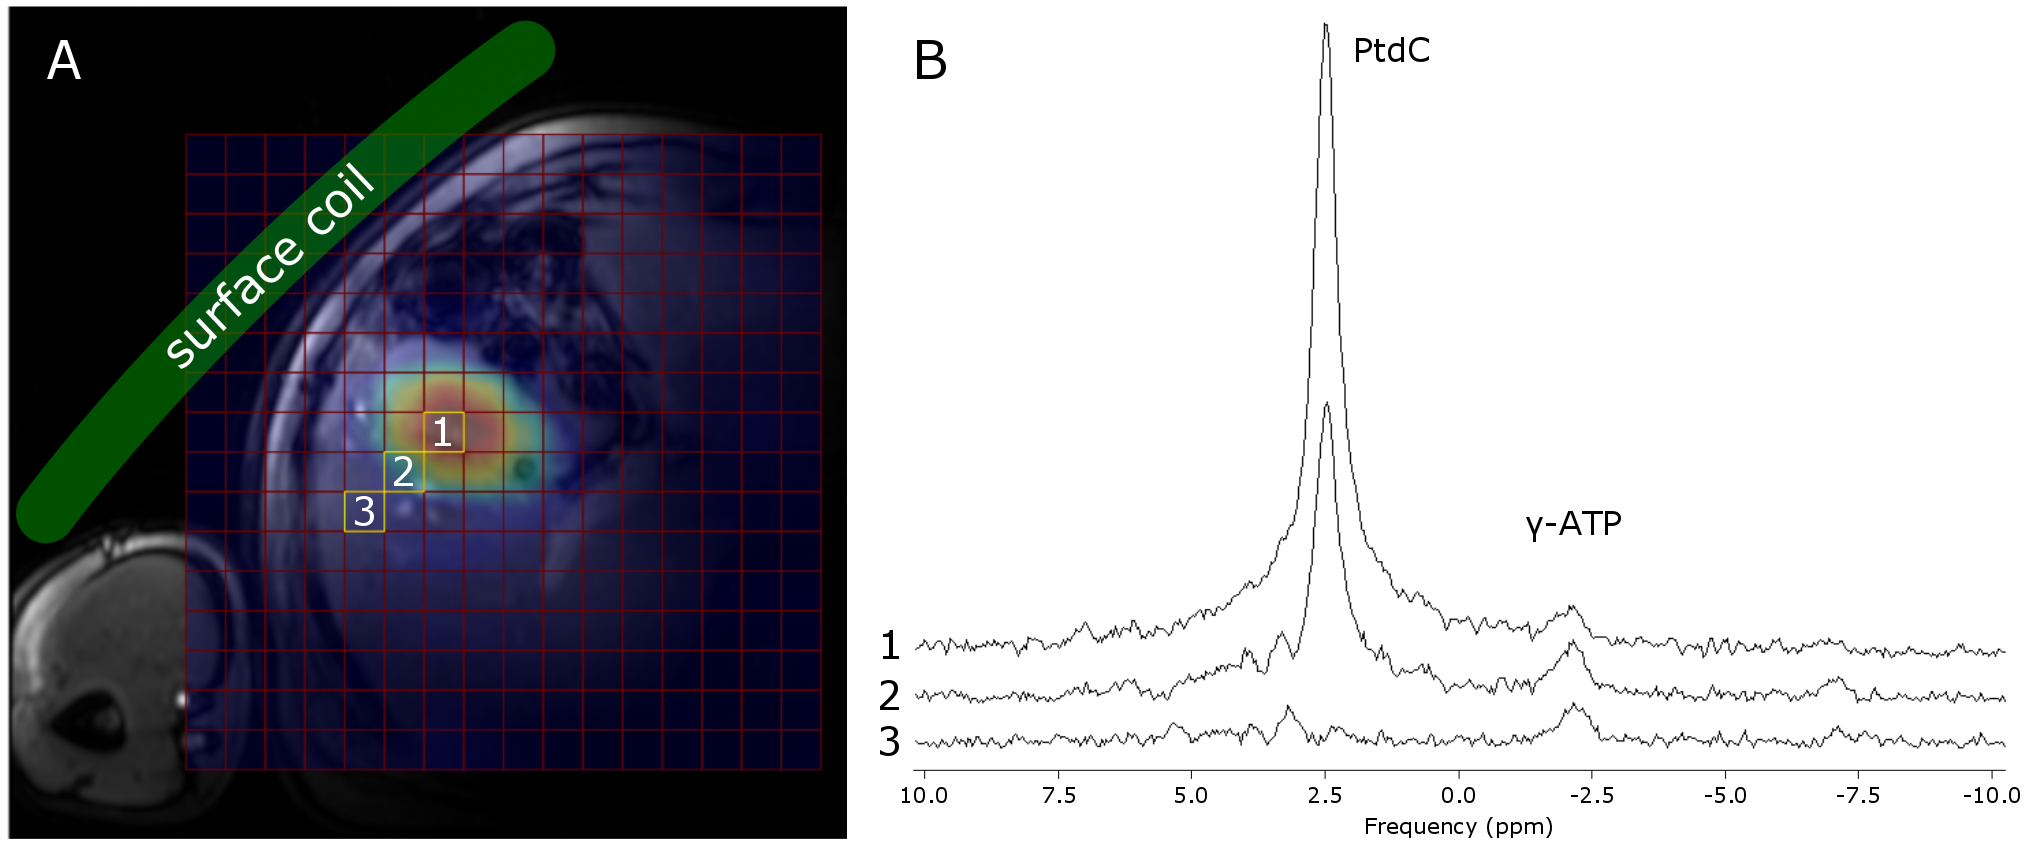
5 healthy volunteers (3m/2f, age: 37.6±6.5y, range: 29—47y, BMI=23.3±2.5kg.m-2) served as control group for comparison with two different groups of patients suffering from PBC (n=8, 4m/4f, age: 51.4±11.4, range: 31—63y, BMI=27.5±3.4kg.m-2) and PSC (n=4, 2m/2f, age: 45.5±1.9y, range: 43—47y, BMI=23.6±1.1kg.m-2). MR measurements were performed on a 7T MR System (Siemens Healthineers, Erlangen, Germany) with a double-tuned 1H/31P surface coil (31P-loop: 14cm, Rapid Biomedical, Rimpar, Germany). The subjects were measured after overnight fast in supine position with the coil strapped down to the chest (Fig.1A). The signal quantification was based on a 3D-MRSI sequence using FID-based acquisition (TE=1ms, TR=1.8s, FOV: 20x20x20cm³, 12x12x12 matrix zero-filled to 16x16x16, 600µs block pulse). OVS slabs were applied in order to suppress signals from abdominal muscle tissue. Hamming filter was applied to reduce voxel bleeding. Total measurement time was about 40min. PtdC maps were created by fitting a single Lorentzian line in the expected frequency of about 2.1ppm with jMRUI using AMARES5. The signal distribution of PtdC was then referenced to the corresponding localizer images to crosscheck the position of the gall bladder (Fig.1A). The voxel with maximum signal was used for quantification. Saturation correction was applied with the assumption of similar T1 of PtdC in the liver and gall bladder. As internal reference, signal from gamma-adenosine triphosphate (γ-ATP) was measured from several voxels located in the liver ([γ –ATP]=2.65mmol/L) according to Purvis et al.6. These voxels were chosen in the same distance from the coil as those for the gallbladder to balance out the B1 field. The grouped data were analyzed using SPSS (v24, IBM, New York, USA) with significance level of 0.05.Results
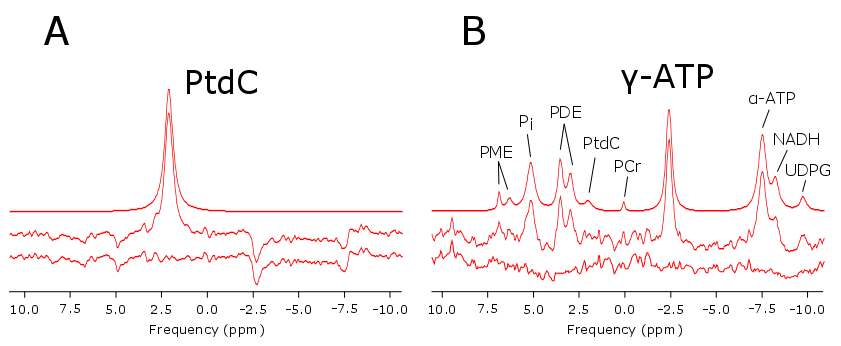
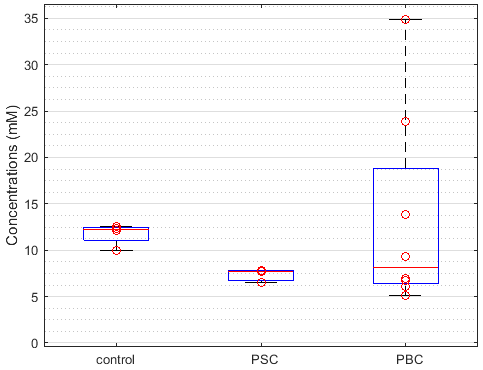
Typical spectra from gall bladder and surrounding region are shown in Figure 1B. Figure 2 depicts spectral fitting of both gall bladder and liver voxels used for quantification. Two MRSI data sets (healthy and PSC patient) had to be discarded from further analysis due to very low volume of gall bladder during examination, which was most probably caused by digesting breakfast prior the measurement. Calculated PtdC concentration of the healthy volunteers was 11.77±1.18mmol/L (n=4). The PSC group’s PtdC content was calculated to 7.34±0.76mmol/L (n=3), and PtdC concentration of the PBC group averaged at 13.35±10.66mmol/L (n=8). We found significant difference (t-test, p<0.0025) between the healthy controls and the PSC group (Fig.3). Although large variation of PtdC values in PBC group resulted in no significant differences of means between control and PBC group, the Levene’s test uncovered a significant difference in the variances.Discussion/Conclusion
The different PtdC concentrations in patients suffering from PSC and healthy volunteers might suggest PtdC as biomarker for certain biliary pathologies. Although the PBC group showed no such differences in its mean value, the high variation within the group and the skewed or possible bimodal distribution of individual values might support this suggestion. A critical point in the quantification is the selection of liver voxels for the signal of concentration reference: due to high B1 inhomogeneity it is not certain that the hepatic voxels perceive equal B1 as voxels located in the gall bladder. The selection of multiple liver voxels and averaging could lower the risk caused by potential selection of outliers. Even though, the PSC and the control group are relatively small our results justify for further ongoing studies on this topic.Acknowledgements
The study was supported by the Anniversary Fund of the
Austrian National Bank #15363.
References
- Chmelik M, Valkovič L, Wolf P, et al. Phosphatidylcholine contributes to in vivo 31P MRS signal from the human liver. Eur. Rad. 2015;25(7):2059-2066
- Kahn S, Cox I, Hamilton G, et al. In vivo and in vitro nuclear magnetic resonance spectroscopy as a tool for investigating hepatobiliary disease: a review of 1H and 31P MRS applications. Liver International. 2005;25(2):273-281
- Valkovič L, Chmelík M, Krššák M. In-vivo 31P-MRS of skeletal muscle and liver: A way for non-invasive assessment of their metabolism. Anal. Biochem. 2017;529:193–215.
- Chmelik M, Považan M, Krššák M, et al. In vivo 31 P magnetic resonance spectroscopy of the human liver at 7 T: an initial experience. NMR Biomed. 2014;27(4):478–485.
- Vanhamme, van den Boogaart A, Van Huffel S. Improved method for accurate and efficient quantification of MRS data with use of prior knowledge. J. Magn. Reson. 1997;129(1):35–43.
- Purvis LAB, Clarke WT, Valkovič L, et al. Phosphodiester content measured in human liver by in vivo 31 P MR spectroscopy at 7 tesla. Magn. Reson. Med. 2017;0:00–00.
Figures