0161
Towards in vivo neurochemical profiling of multiple sclerosis with MR spectroscopy at 7 Tesla: Apparent increase in frontal cortex water T2 in aged patients with progressive multiple sclerosis stabilizes in biexponential model constrained by tissue and CSF partial volumes1Department of Radiology and Biomedical Imaging, Yale University School of Medicine, New Haven, CT, United States, 2Department of Biomedical Engineering, Columbia University School of Engineering and Applied Science, New York, NY, United States, 3Department of Neurology, Yale University School of Medicine, New Haven, CT, United States, 4Mandell Multiple Sclerosis Center, Saint Francis Hospital, Hartford, CT, United States, 5Department of Radiology, Columbia University Medical Center, New York, NY, United States
Synopsis
Water is a common internal reference for metabolite quantification by 1H-MRS. We investigate potential influences on water-referenced metabolite quantification by differences in frontal cortex water T2 in individuals with relapsing-remitting, progressive, and no multiple sclerosis. Water T2 differed in monoexponential models, exhibiting highest values in progressive multiple sclerosis only when analyses were not age-controlled. Groupwise T2 did not differ in biexponential models constrained by tissue and CSF partial volumes, suggesting that monoexponential T2 differences reflected disparate proportions of water in tissue and CSF rather than differential behavior within them. Our results suggest stability of water T2 within frontal cortex tissue and CSF with multiple sclerosis and emphasize the superiority of metabolite quantification with group-specific T2 values when voxel composition may differ.
Purpose
Tissue water is a common internal reference for metabolite quantification by in vivo proton magnetic resonance spectroscopy (1H-MRS).1 The usefulness of water as an internal reference depends, however, on the validity of assumptions made about the uniformity of its key properties across individuals, or, alternatively, on detailed knowledge of differences among them. For example, water-to-metabolite signal ratios are commonly corrected without explicit examination of group-specific transverse relaxation time constant T2.2-5 But multiple lines of evidence suggest that this practice may not always, so to speak, hold water. Age6 and brain irradiation,7 for instance, may lengthen cortex water T2 while preserving or reducing cortical N-acetyl aspartate and creatine T2.7,8 Such evidence reinforces the notion that T2 values used in metabolite quantification should empirically consider the populations at hand.
One such population is individuals with multiple sclerosis (MS), an autoimmune disorder that damages the central nervous system. Previously, we reported progressive MS- and age-related decreases in creatine-referenced N-acetyl aspartate and glutamate in frontal cortex.9 Here, to enable accurate water-referenced quantification of these and other metabolites in individuals with relapsing-remitting (RR-MS), progressive (P-MS), and no MS, we assess potential differences in frontal cortex water T2 relaxivity, both in bulk and within tissue- and cerebrospinal fluid (CSF)-specific compartments.
Methods
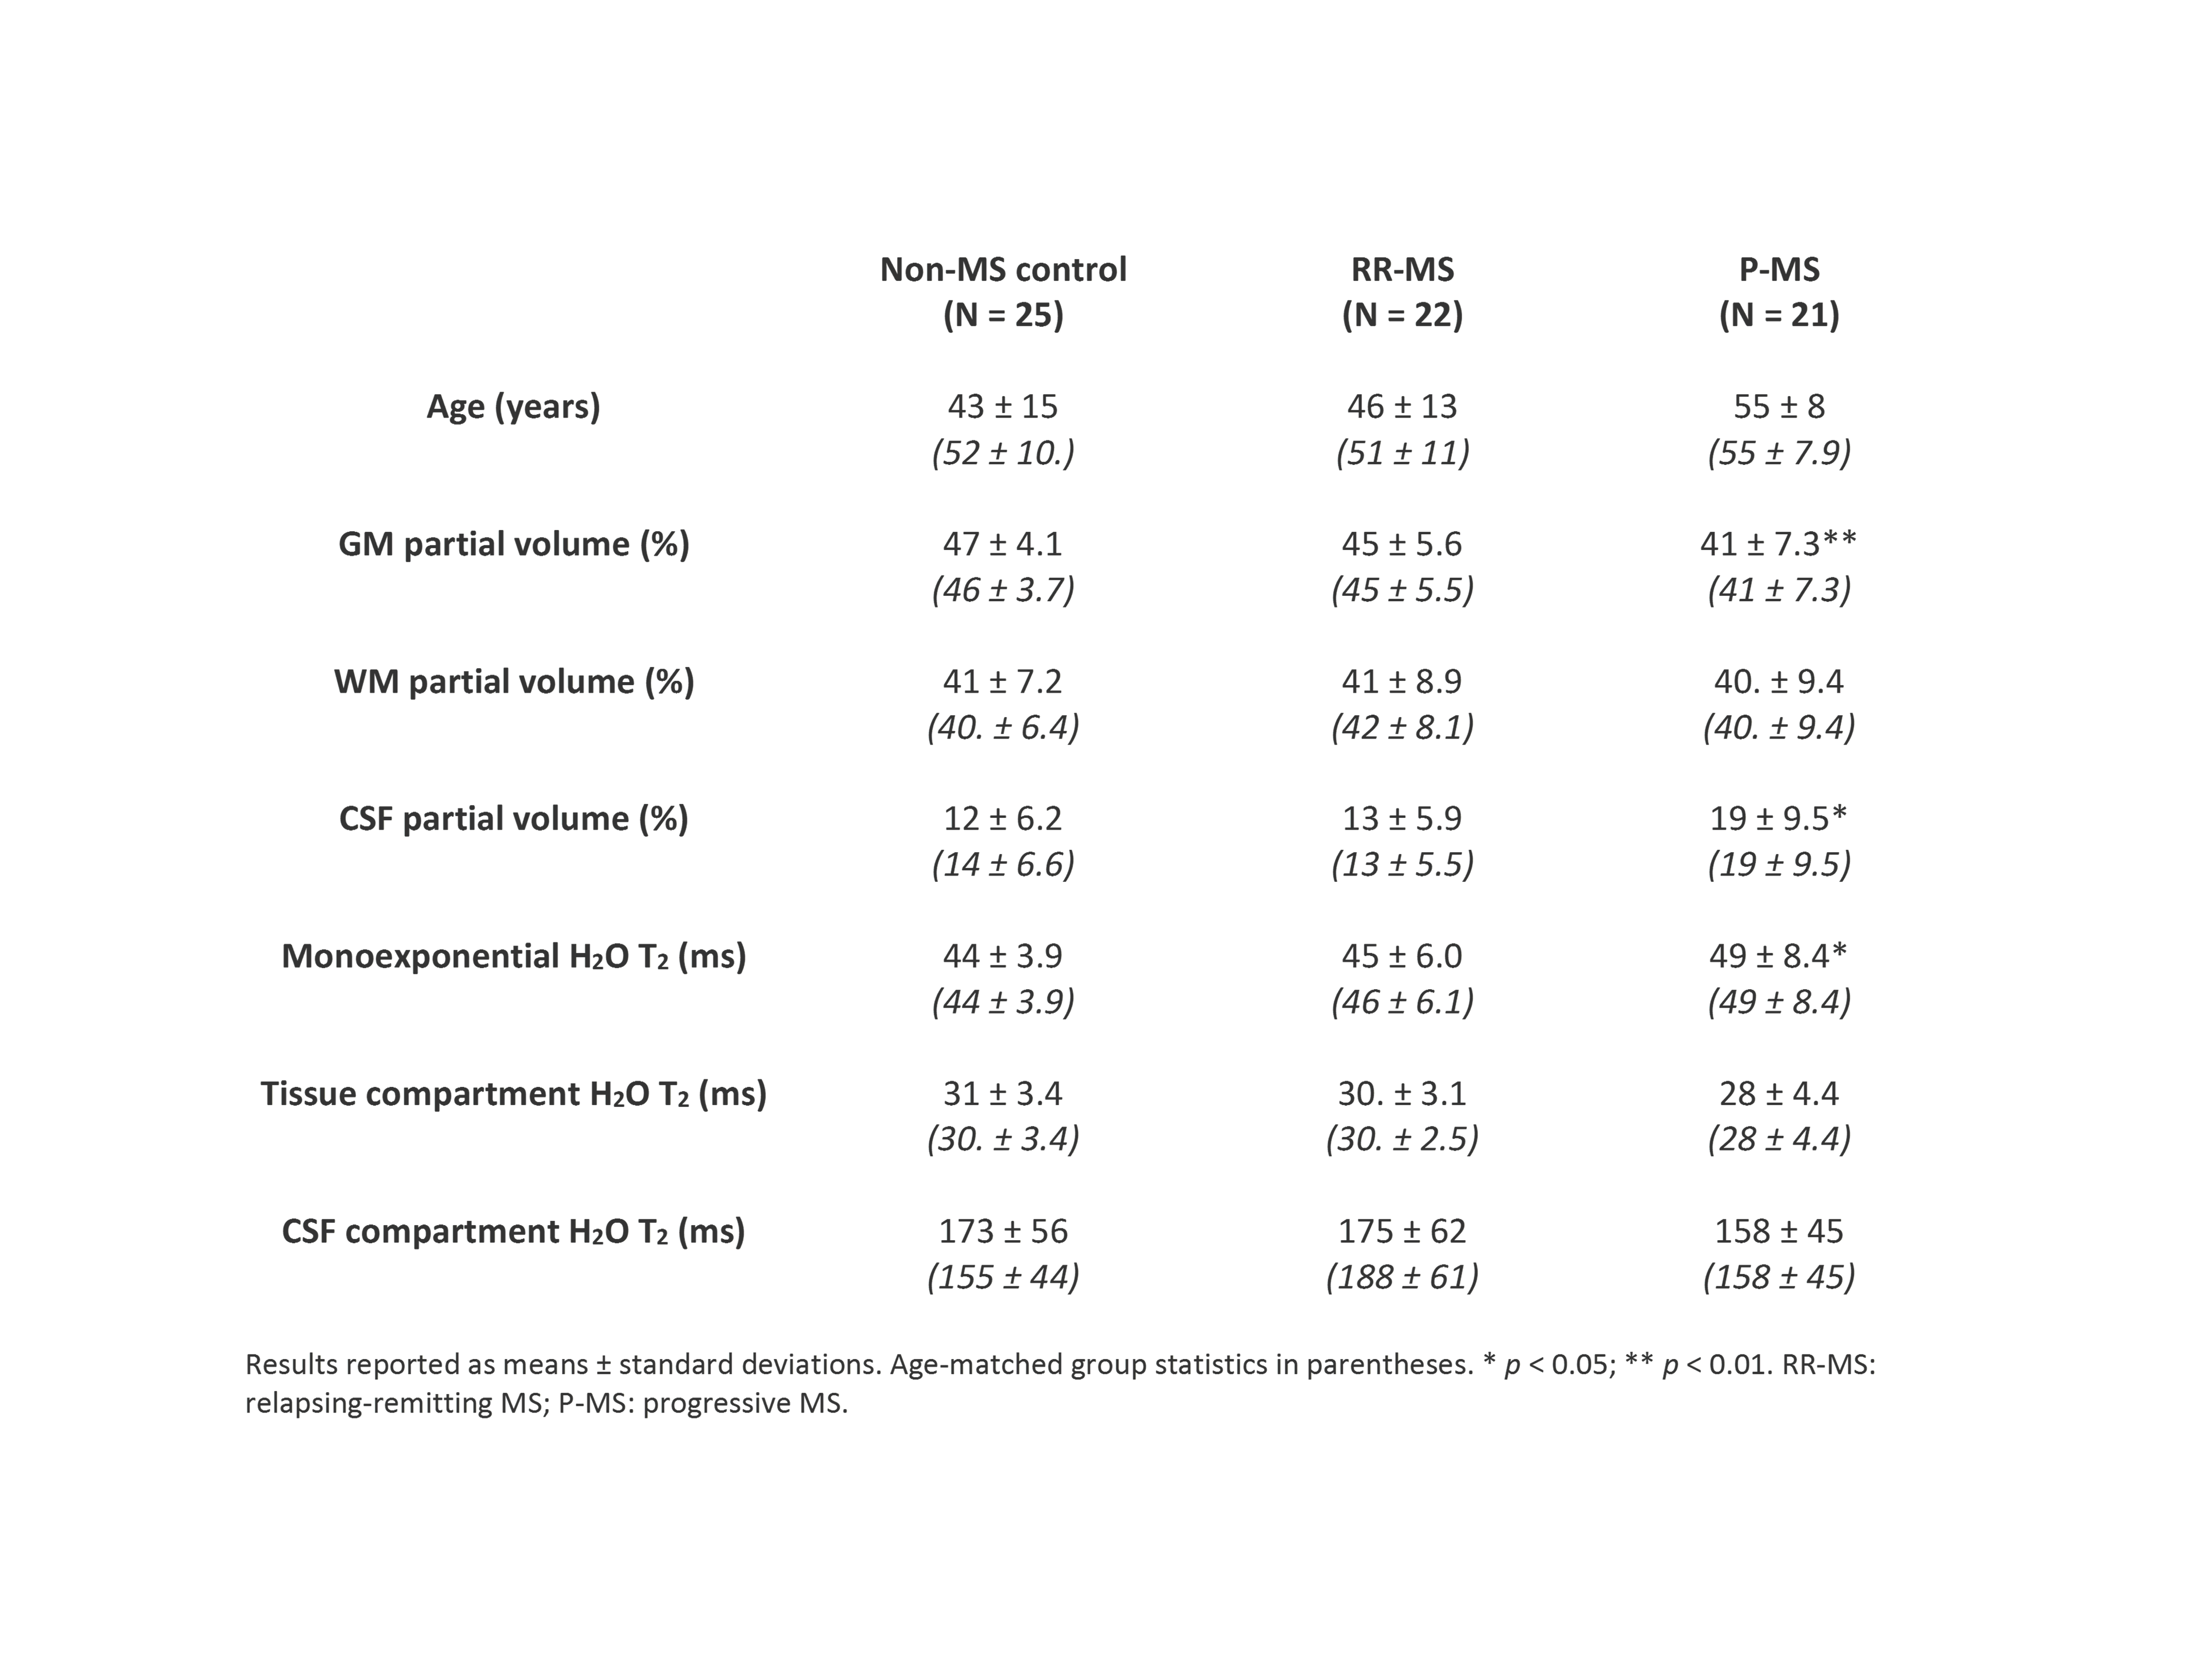
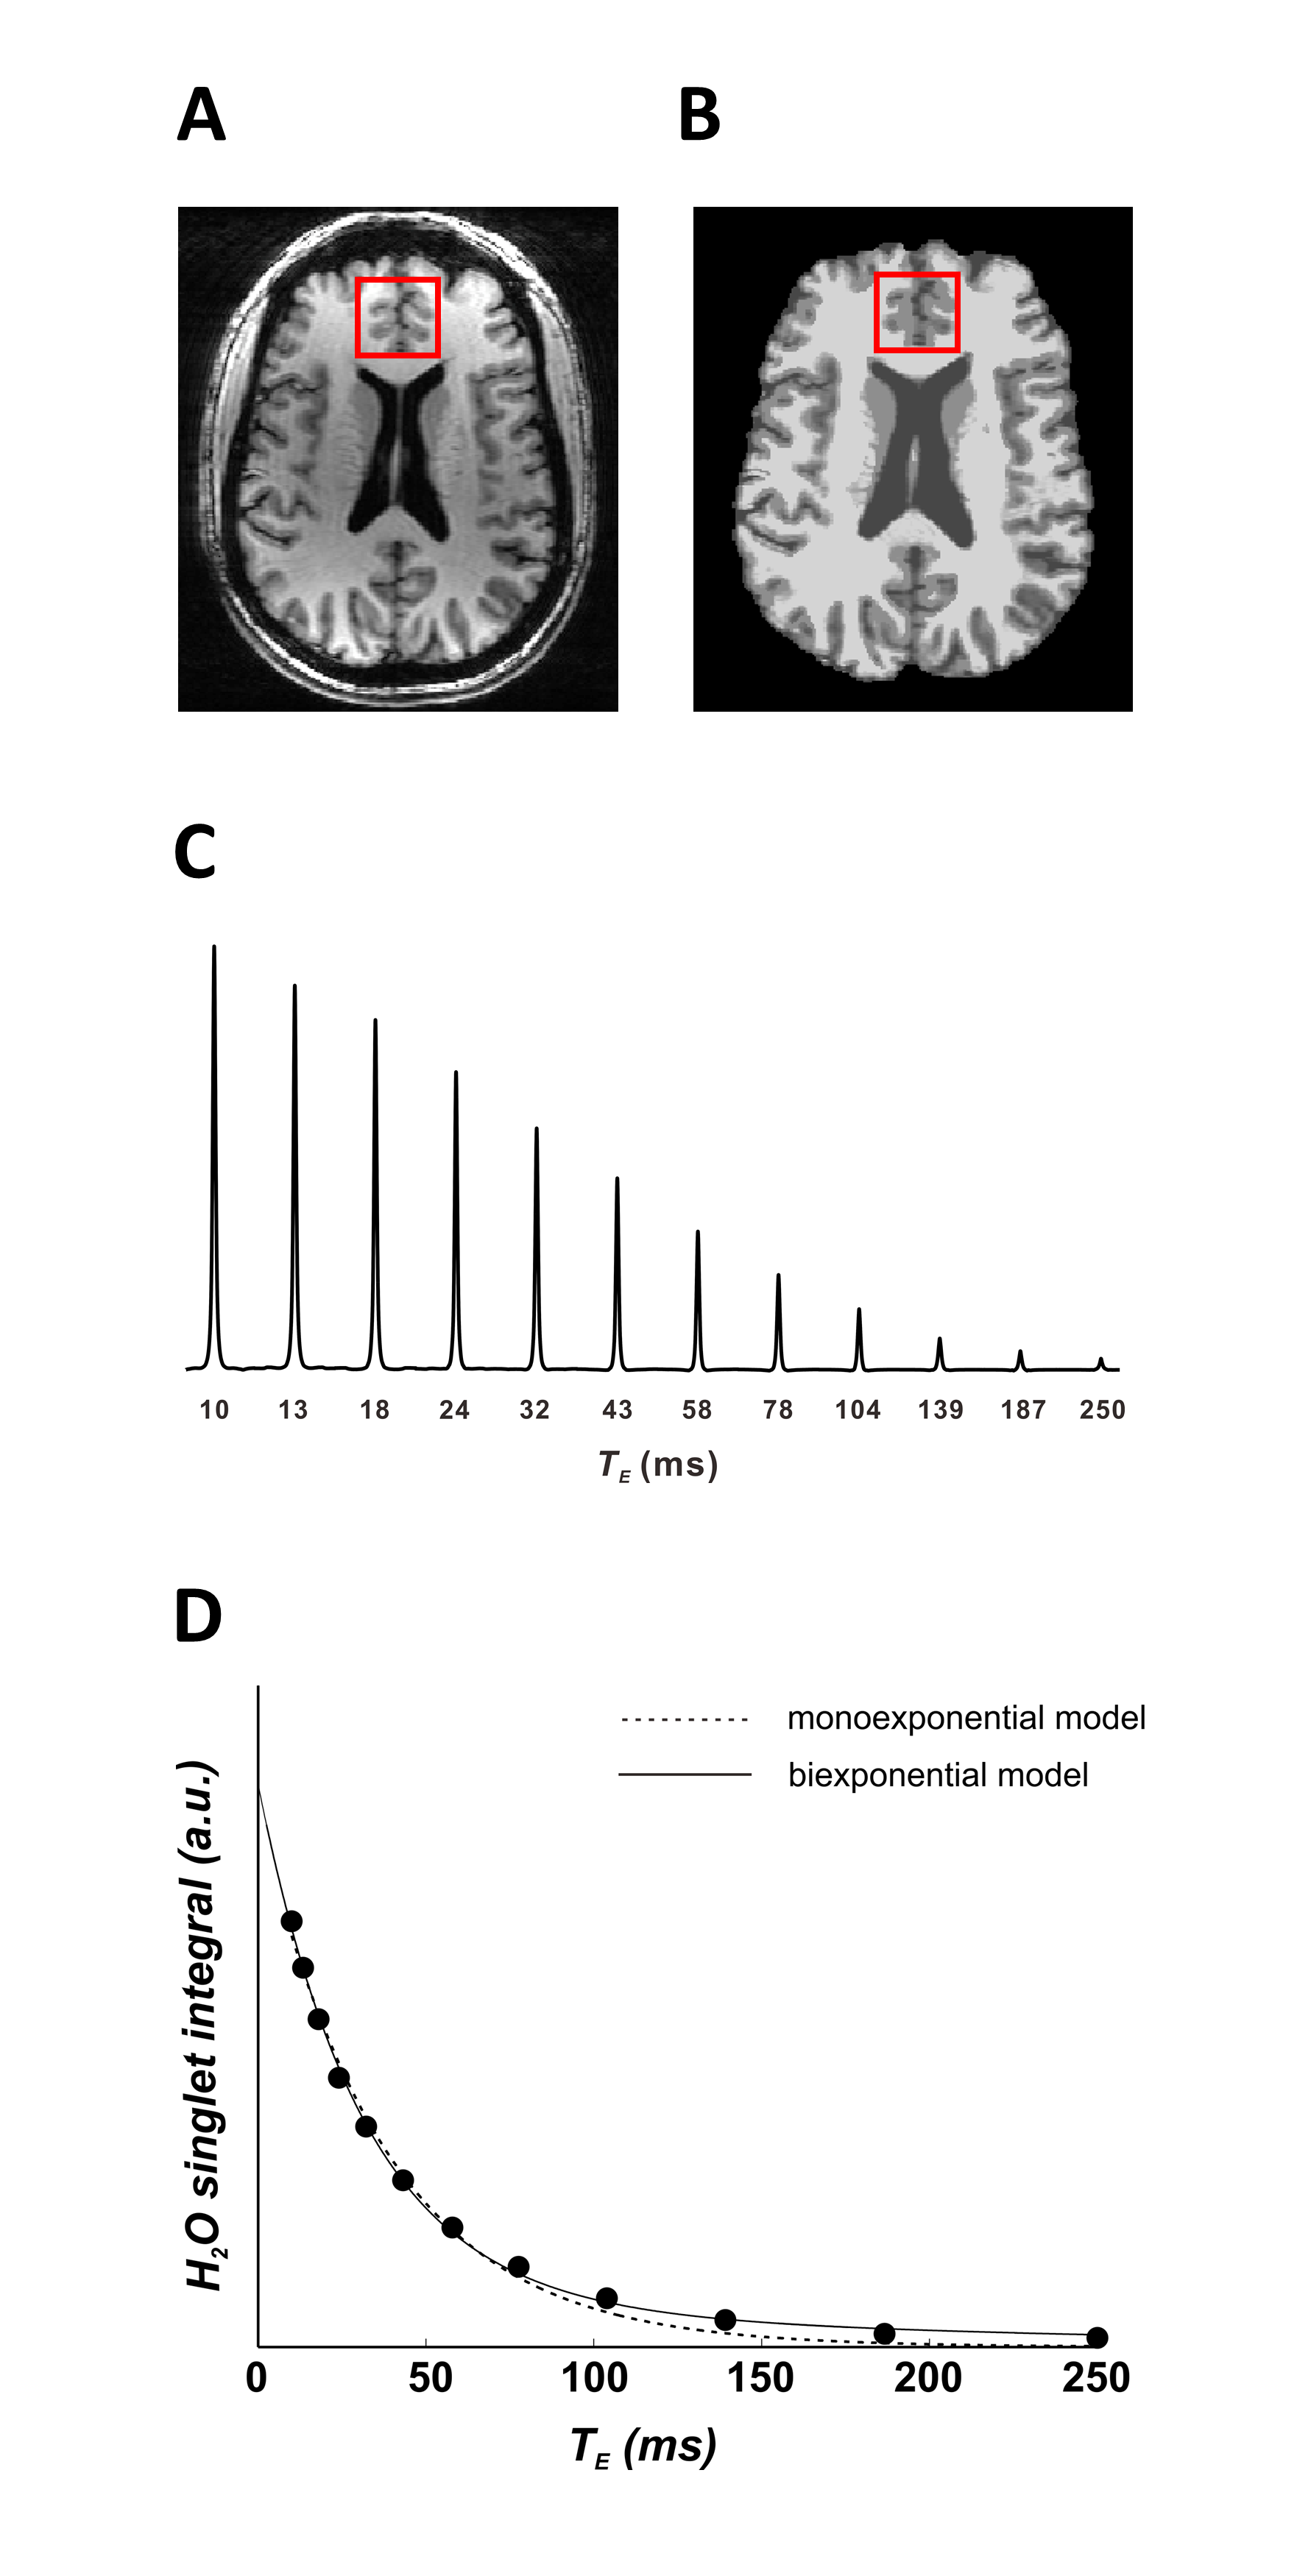
Scan routines coincided with metabolite signal acquisitions previously reported9 in a 7-Tesla MR scanner (Varian Medical Systems, Inc., Palo Alto, CA, USA) on twenty-five (12 female; 43 ± 15 y.o.) controls without multiple sclerosis, twenty-six (18 female; 44 ± 13 y.o.) participants with RR-MS, and twenty-one (12 female; 55 ± 8 y.o.) participants with P-MS. Water T2 from a 27-cc cubic prefrontal cortex voxel shimmed with static third-order spherical harmonics was examined with a STEAM (TM 50 ms, TR 15 s)2 array with one repetition each of 12 interleaved echo times (TE) from 10 to 250 ms (Figure 1). Spectra were phase-corrected10 and real peaks integrated from baseline using INSPECTOR.11 Water T2 was estimated by trust-region-reflective least-squares curve fitting to signal integral values at each TE according to:
$$M_{TE} = M_0e^{\frac{-T_E}{T_2}}$$
where M represents water signal integral.12 To account for disparate proportions of water protons in tissue versus CSF compartments by voxel composition differences, we then applied a biexponential model:
$$M_{TE} = M_0\left(\chi_te^{\frac{-T_E}{T_{2t}}} + \chi_fe^{\frac{-T_E}{T_{2f}}}\right)$$
with tissue (white matter plus grey matter) $$$T_{2t}$$$ and CSF $$$T_{2f}$$$. Variables $$$\chi_t$$$ and $$$\chi_f$$$ represent compartmental water fractions in tissue and CSF, respectively, as:
$$\chi_{t/f} = \frac{PV_{t/f}[H_2O]_{t/f}}{PV_{gm}[H_2O]_{gm} + PV_{wm}[H_2O]_{wm} + PV_{csf}[H_2O]_{csf}}$$
where $$$PV_{gm}$$$, $$$PV_{wm}$$$, and $$$PV_{csf}$$$ are voxel partial volumes of grey matter, white matter, and CSF, respectively, calculated by custom MATLAB software using skull-stripped (FMRIB's Brain Extraction Tool; BET)13 and segmented14 T1-weighted images (Figure 1A). The variables $$$[H_2O]_{gm/wm/csf}$$$ denote published tissue water concentration estimates.3,15
Group differences were assessed in SPSS 20 (IBM, Armonk, NY) with α = 0.05. Age-controlled analyses included only participants over 35 years old.
Results
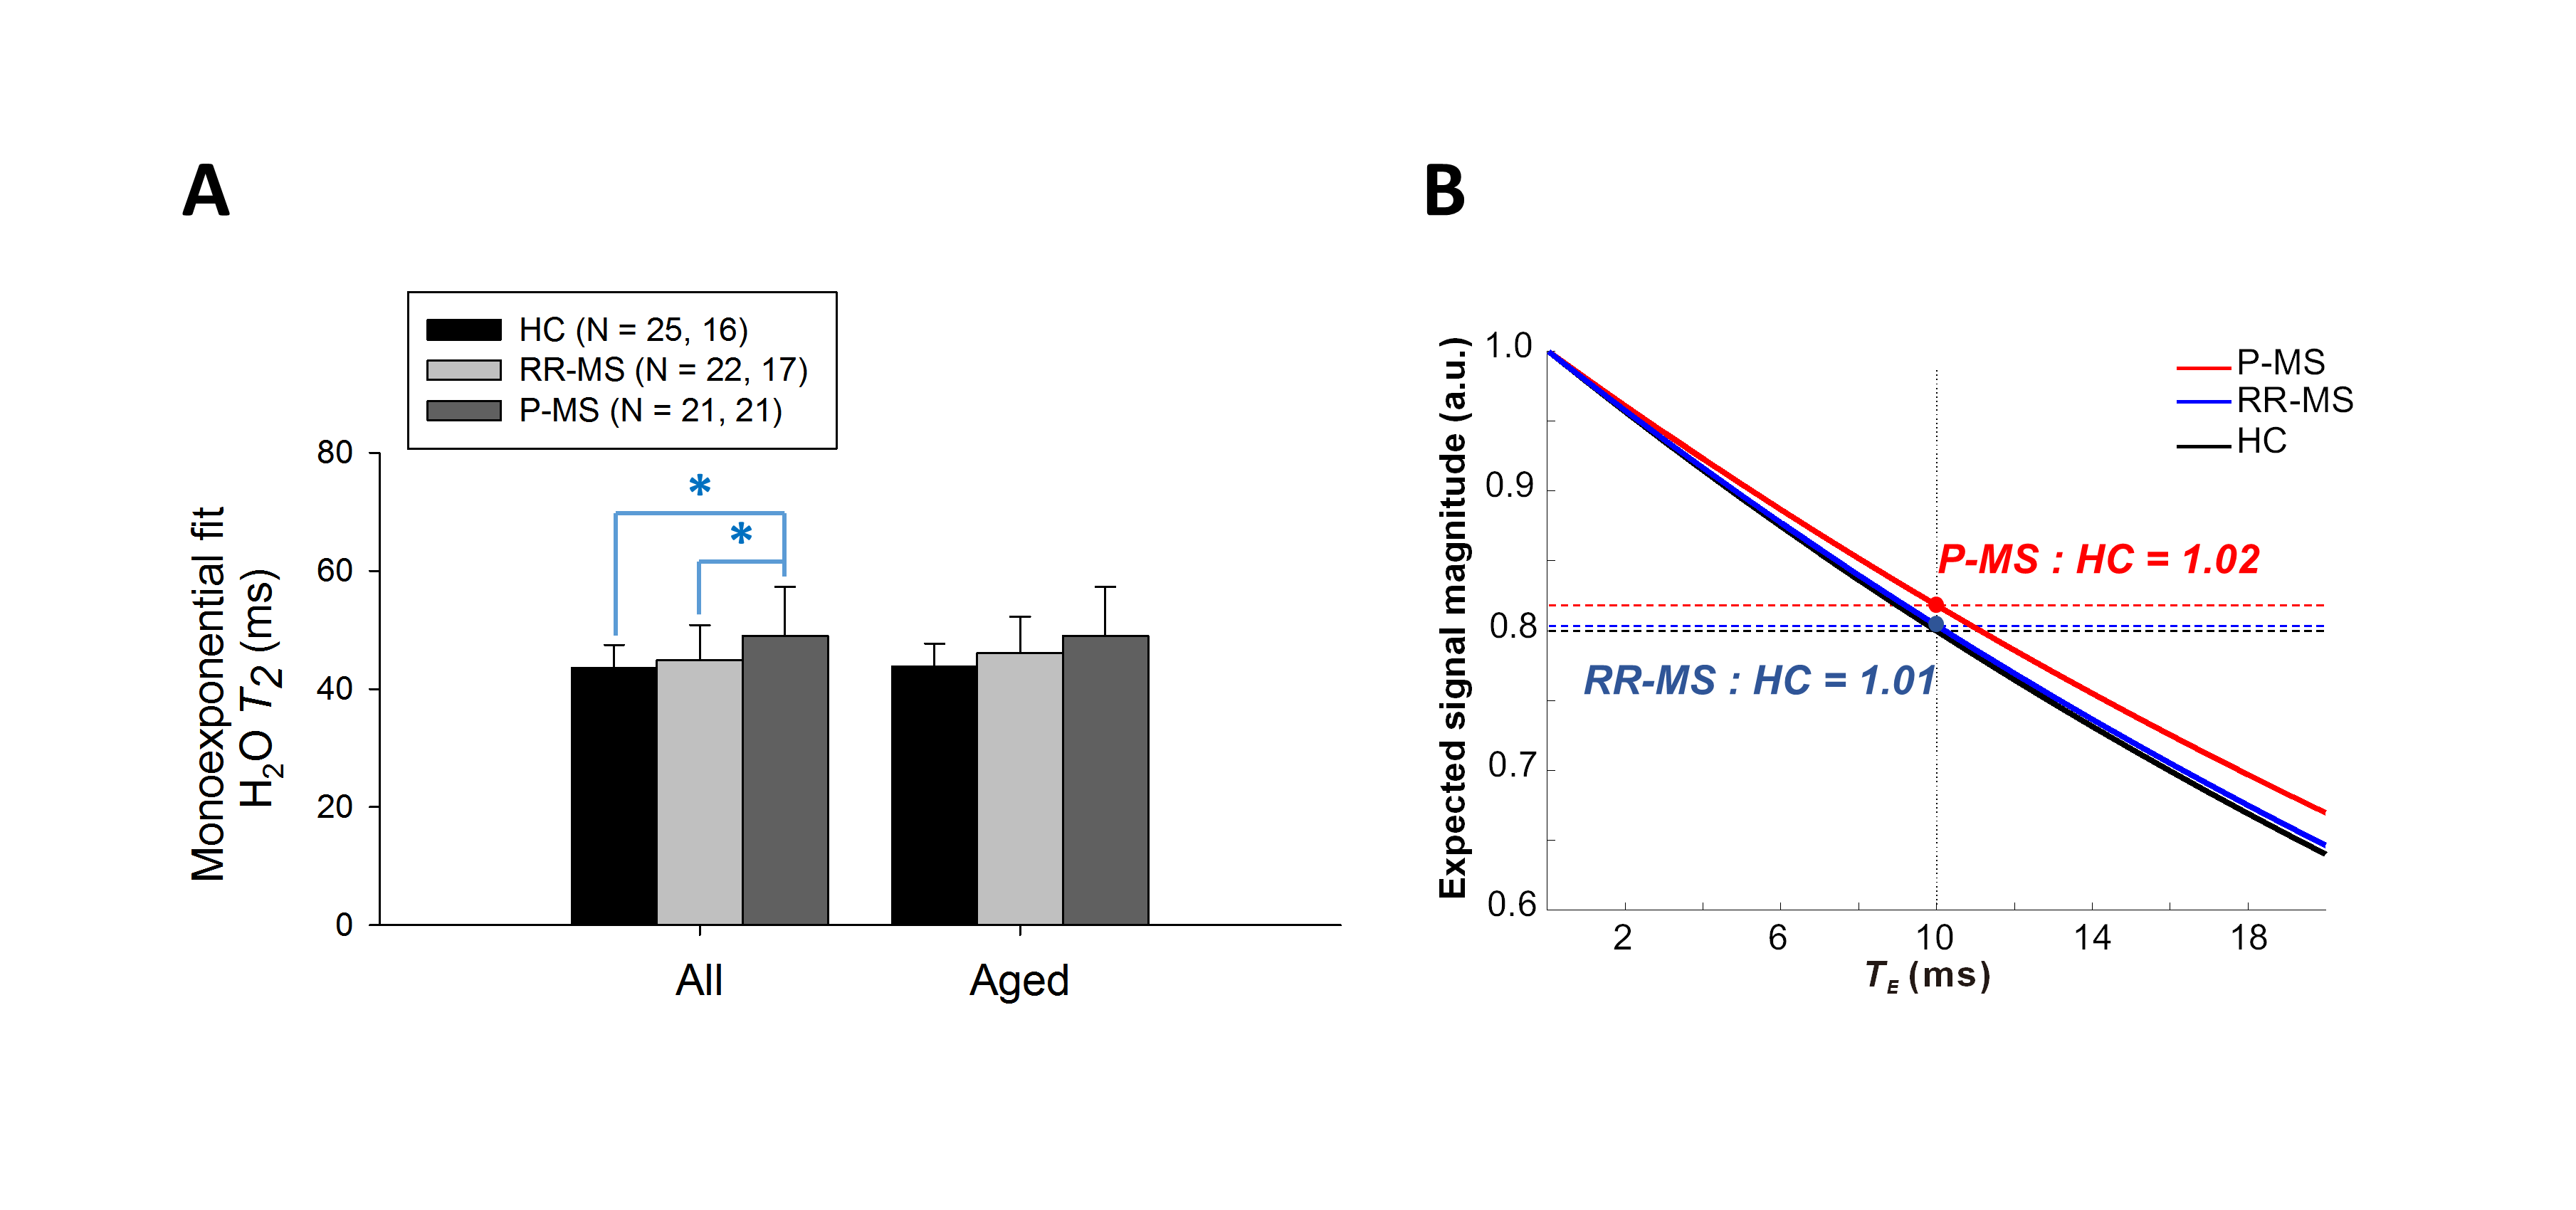
T2 models yielded visually satisfactory fits in all participants. Four RR-MS cases with outlying CSF T2 were excluded from analysis. Kruskal-Wallis test demonstrated a significant group effect on water T2 (7.772, p = 0.021); Mann-Whitney test demonstrated increases in P-MS relative to control (2.724, p = 0.006) and RR-MS (2.041, p = 0.041) (Figure 2A). Uniform application of control T2 to water signal quantification would overestimate P-MS water concentration by 2% at TE = 10 ms (Figure 2B).
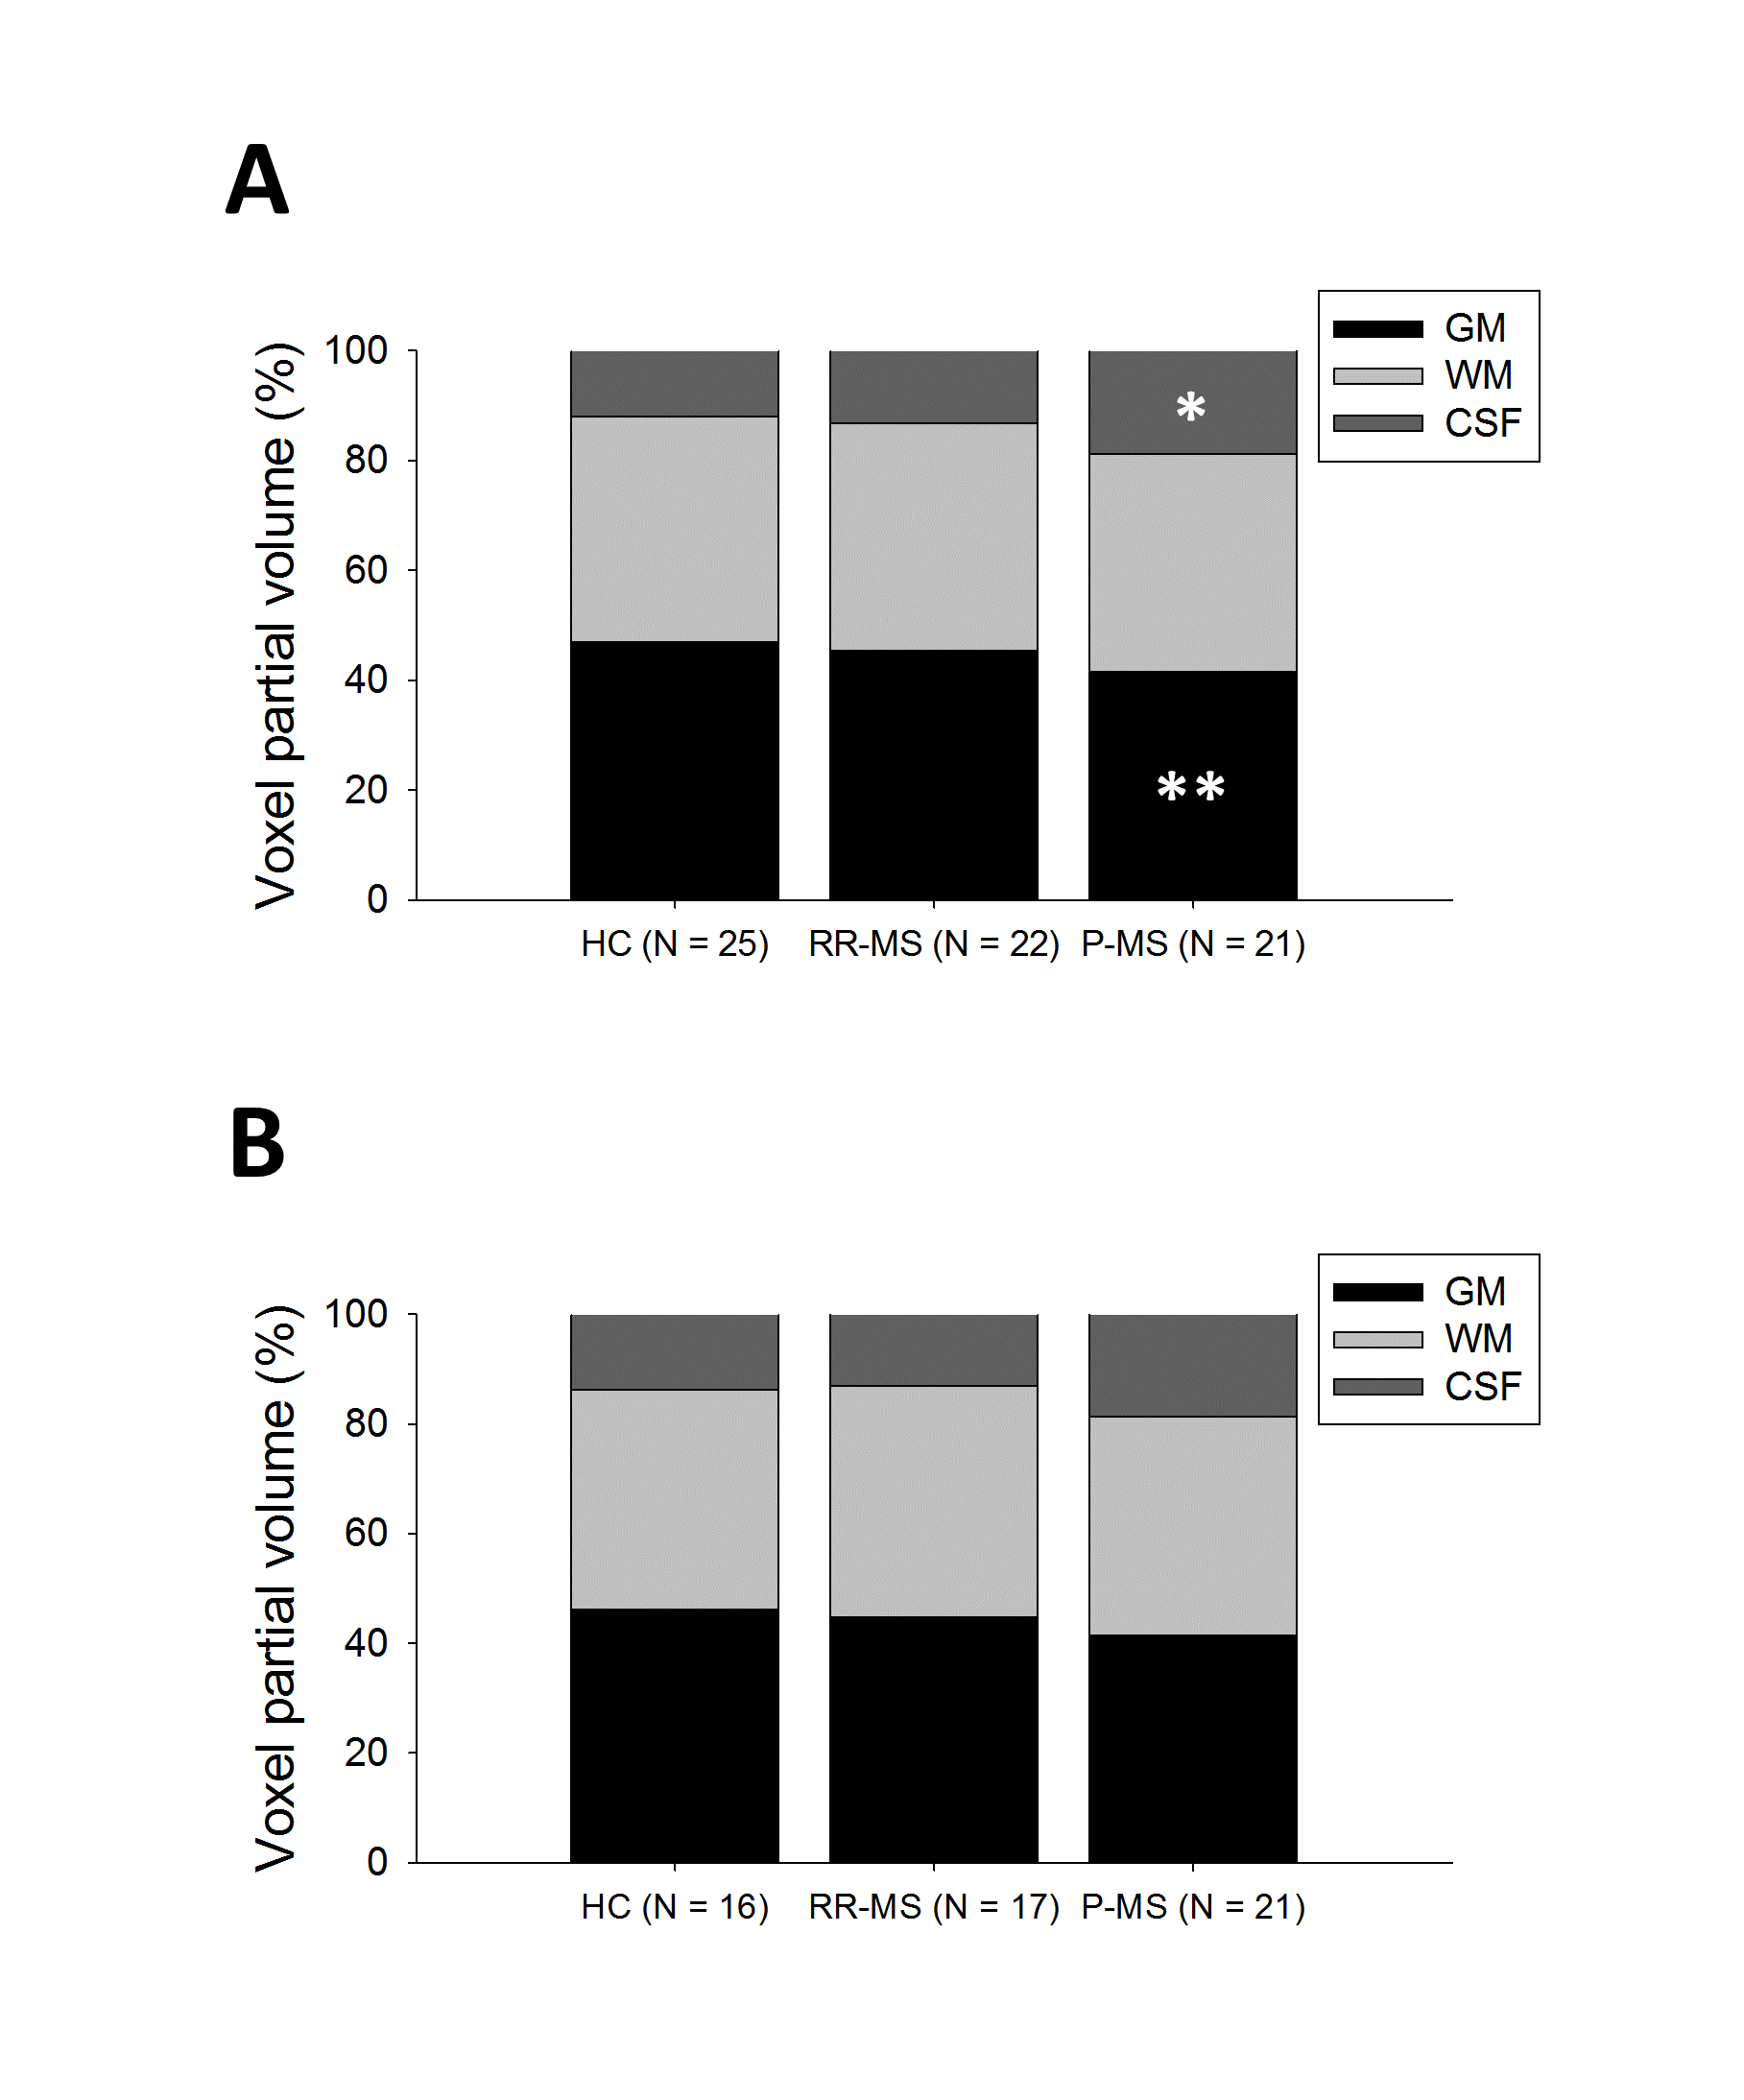
Similar analysis demonstrated a group effect on grey (7.745, p = 0.021) but not white matter partial volumes, with lower grey matter in P-MS relative to control (-2.746, p = 0.006); an effect was also found in CSF (6.266, p = 0.044), higher in P-MS than control (2.327, p = 0.020) (Figure 3).
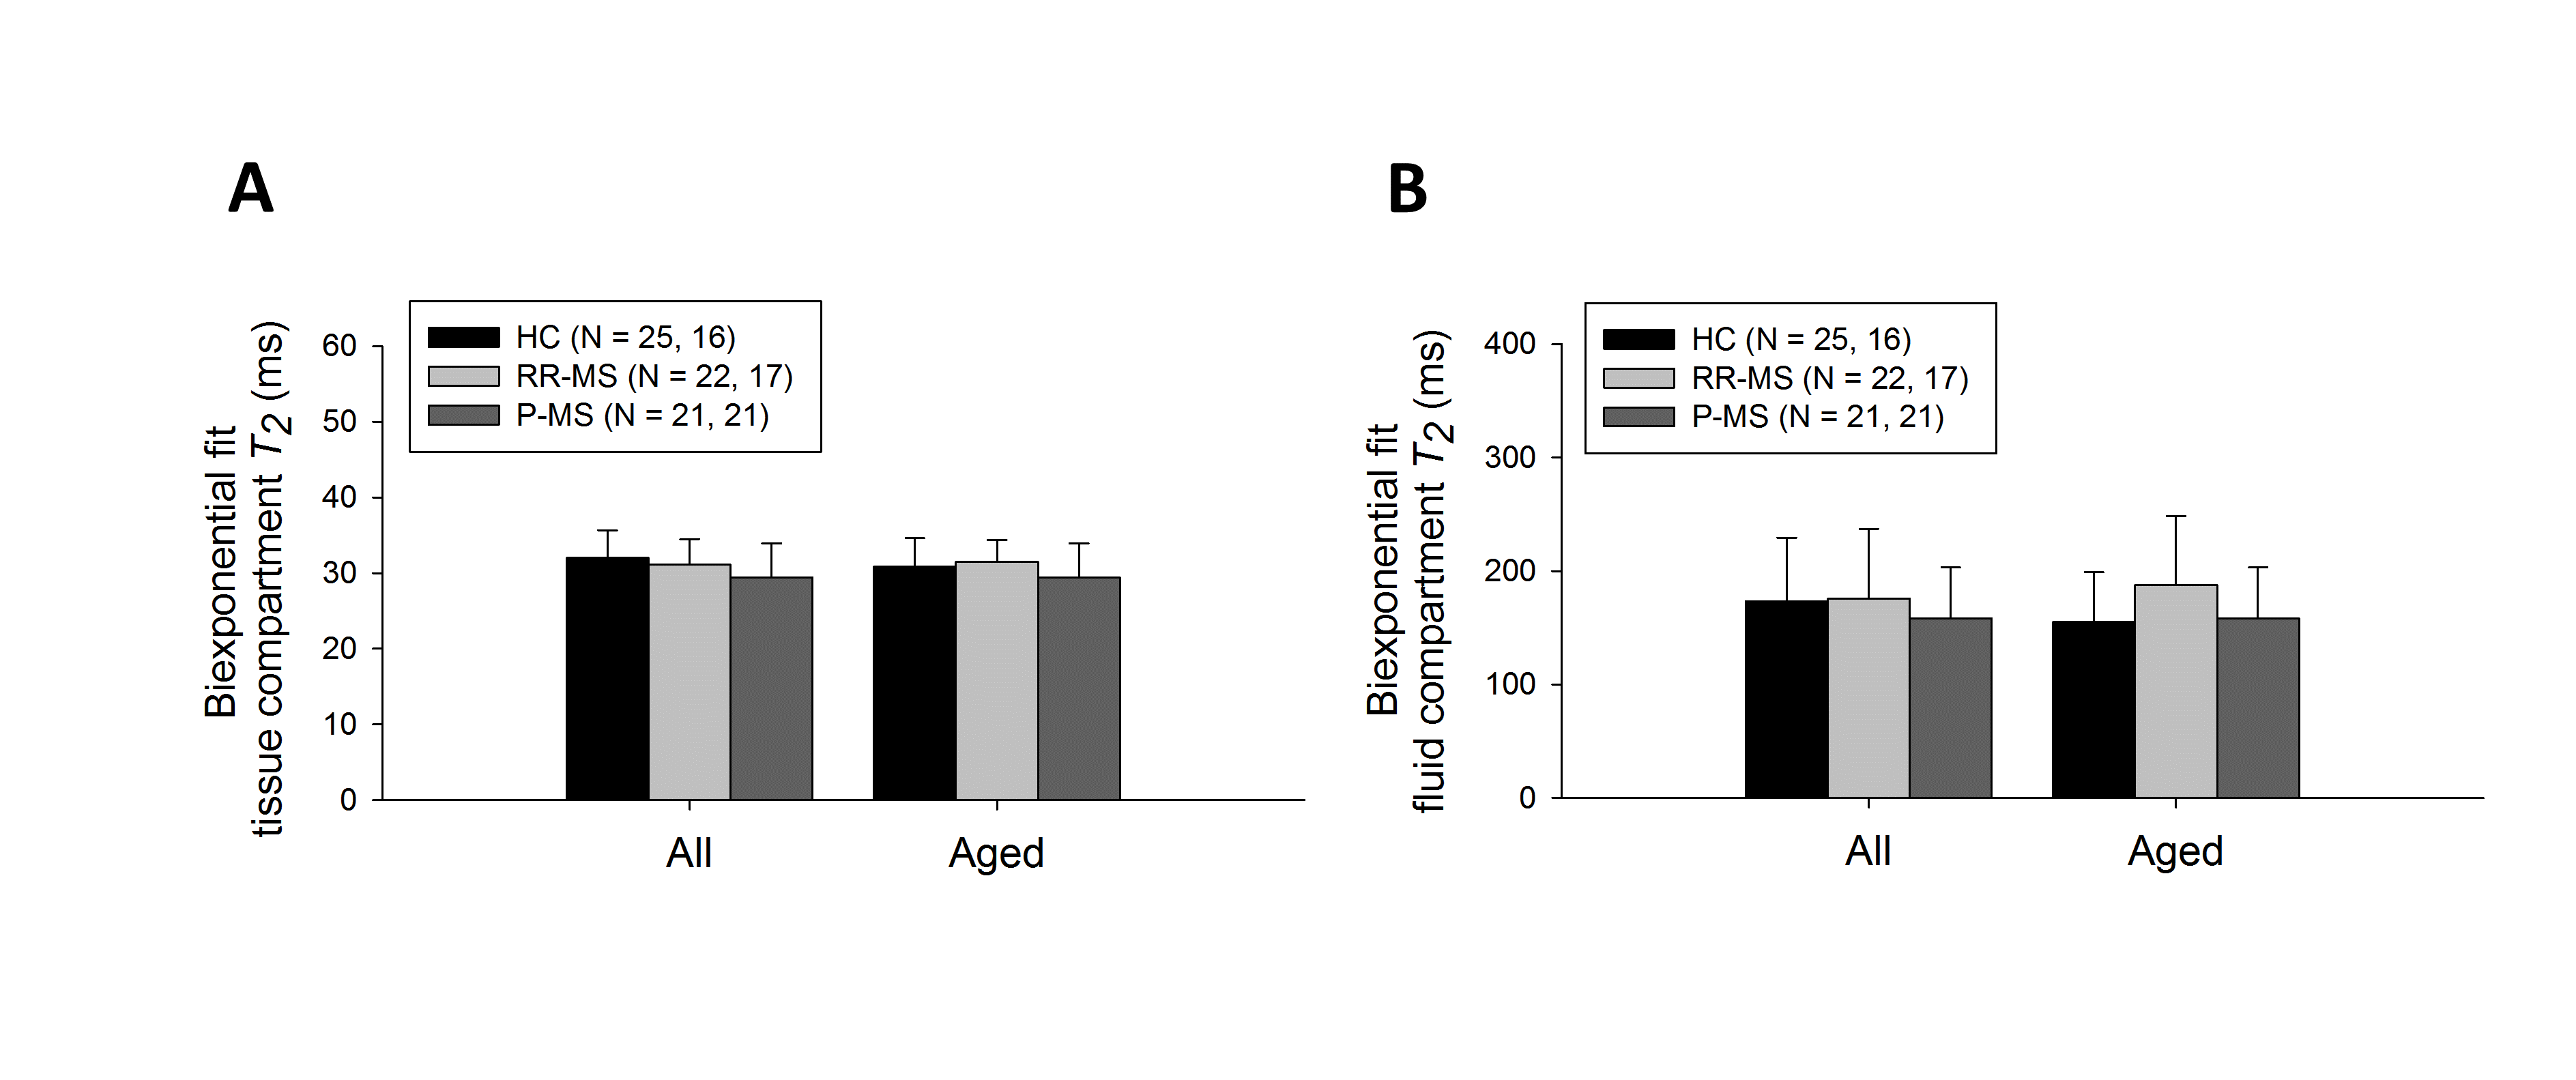
Groupwise T2 differences disappeared with biexponential modeling (Figure 4) and became marginally significant (0.05 < p < 0.1) upon controlling for age (Figures 2A, 3B, 4B).
Conclusions
Frontal cortex water T2 differences in aged individuals with progressive multiple sclerosis disappeared when considering disparate voxel composition in a biexponential model constrained by tissue and CSF partial volumes and when matching group ages. These results suggest that water T2 within tissue and CSF remains stable with multiple sclerosis disease state and emphasize the superiority of metabolite quantification with group- or voxel-specific T2 values when voxel composition may differ, as recently implemented.16 Further refinement to voxel compartment-specific T2 estimates may be achieved by empirically controlling for potential MS-related differences in tissue water concentration, here assumed equivalent across groups. Finally, that our results notably demonstrated stability in tissue compartment T2 with multiple sclerosis disease state suggests similar stability in predominantly tissue-bound metabolite T2, but this is a question that begs continued empirical investigation.Acknowledgements
Special thanks are due to Ms. Yvette Strong at the Yale Center for Clinical Investigation as well as the Yale-New Haven Hospital Interventional Immunology Clinic nursing staff for their tireless support in participant recruitment. This research was enabled by the National Multiple Sclerosis Society (NMSS) grant “In Vivo Metabolomics of Oxidative Stress with 7 Tesla Magnetic Resonance Spectroscopy“ (RG 5319) under the jurisdiction of Yale School of Medicine Human Investigation Committee protocol #1107008743 and Columbia University Institutional Review Board protocol AAAQ9795.References
1. Near J. Spectral quantification and pitfalls in interpreting magnetic resonance spectroscopic data: What to look out for. In: Stagg CJ and Rothman DL, eds. Magnetic Resonance Spectroscopy: Tools for Neuroscience Research and Emerging Clinical Applications. (Elsevier, London, 2014), pp. 49-67.
2. Prinsen H, de Graaf RA, Mason GF, Pelletier D, Juchem C. Reproducibility measurement of glutathione, GABA, and glutamate: Towards in vivo neurochemical profiling of multiple sclerosis with MR spectroscopy at 7T. Journal of Magnetic Resonance Imaging 2017; 45(1): 187-188.
3. Provencher S. LCModel and LCMgui2 User’s Manual. 2005.
4. Cawley N, Solanky BS, Muhlert N, Tur C, Edden RA, Wheeler-Kingshott CA, Miller DH, Thompson AJ, Ciccarelli O. Reduced gamma-aminobutyric acid concentration is associated with physical disability in progressive multiple sclerosis. Brain 2015; 138: 2584-2595.
5. Wilson M, Reynolds G. Tarquin User Guide Version 4.3.5. 2015.
6. Kumar R, Delshad S, Woo MA, Macey PM, Harper R. Age-related regional brain T2-relaxation changes in healthy adults, Journal of Magnetic Resonance Imaging 2012; 35: 300-308.
7. Usenius T, Usenius JP, Tenhunen M, Vainio P, Johansson R, Soimakallio S, Kauppinen R. Radiation-induced changes in human brain metabolites as studied by 1H nuclear magnetic resonance spectroscopy in vivo, International Journal of Radiation Oncology, Biology, Physics 1995; 33(3): 719-724.
8. Jiru F, Skoch A, Wagnerova D, Dezortova M, Viskova J, Profant O, Syka J, Hajek M. The age dependence of T2 relaxation times of N-acetyl aspartate, creatine and choline in the human brain at 3 and 4T, NMR in Biomedicine 2016; 29, 284-292.
9. Swanberg KM, Prinsen H, Fulbright RK, Pitt D, DeStefano K, Bailey M, Juchem C. Towards in vivo neurochemical profiling of multiple sclerosis with MR spectroscopy at 7 Tesla: Cross-sectional assessment of frontal-cortex glutathione, GABA, and glutamate in individuals with relapsing-remitting and progressive multiple sclerosis. International Society for Magnetic Resonance in Medicine 25th Annual Meeting, Honolulu, Hawaii, United States, April 2017.
10. Klose U. In vivo proton spectroscopy in presence of eddy currents. Magnetic Resonance in Medicine 1990; 14(1): 26-30.
11. Juchem C. INSPECTOR - Magnetic Resonance Spectroscopy Software. Columbia TechVenture (CTV), license CU17130. http://innovation.columbia.edu/technologies/cu17130_inspector (2016).
12. de Graaf R. Magnetic Resonance Spectroscopy, Stagg CJ and Rothman D, eds. (Elsevier, London, 2014), p. 40.
13. Smith SM. Fast robust automated brain extraction. Human Brain Mapping 2002; 17(3): 143-155.
14. Shattuck D, Leahy RM. Brainsuite: An automated cortical surface identification tool, Medical Image Analysis 2002; 6(2): 129-142.
15. Ernst T, Kreis R, Ross BD. Absolute quantitation of water and metabolites in the human brain. I. Compartments and water. Journal of Magnetic Resonance 1993; 102(1): 1-8.
16. Marjanska M, McCarten J, Hodges J, Hemmy LS, Grant A, Deelchand DK, Terpstra M. Region-specific aging of the human brain as evidenced by neurochemical profiles measured noninvasively in the posterior cingulate cortex and the occipital lobe using 1H magnetic resonance spectroscopy at 7T. Neuroscience 2017; 23: 168-177.
Figures