0160
Multi-vendor, multi-site comparison of 1H-MRS PRESS data acquired at 25 research sites1Russell H. Morgan Department of Radiology and Radiological Science, The Johns Hopkins University, School of Medicine, Baltimore, MD, United States, 2F. M. Kirby Research Center for Functional Brain Imaging, Kennedy Krieger Institute, Baltimore, MD, United States, 3Imaging Institute, Cleveland Clinic Foundation, Cleveland, OH, United States, 4Radiology, Cleveland Clinic Lerner College of Medicine of Case Western Reserve University, Cleveland, OH, United States, 5Department of Radiology, Haukeland University Hospital, Bergen, Norway, 6Department of Clinical Medicine, University of Bergen, Bergen, Norway, 7Spinoza Centre for Neuroimaging, Amsterdam, Netherlands, 8Department of Radiology, Cincinnati Children’s Hospital Medical Center, Cincinnati, OH, United States, 9Department of Biomedical Engineering, The Johns Hopkins University, School of Medicine, Baltimore, MD, United States, 10Department of Radiology, Taipei Medical University Shuang Ho Hospital, New Taipei City, Taiwan, 11Department of Biological and Medical Psychology, University of Bergen, Bergen, Norway, 12NORMENT – Norwegian Center for Mental Disorders Research, University of Bergen, Bergen, Norway, 13Department of Kinesiology, KU Leuven, Leuven, Belgium, 14REVAL Rehabilitation Research Center, Hasselt University, Diepenbeek, Belgium, 15Department of Radiology, Medical Physics, Medical Center - University of Freiburg, Faculty of Medicine, Freiburg, Germany, 16Brain and Consciousness Research Centre, Taipei Medical University, Taipei, Taiwan, 17School of Health Sciences, Purdue University, West Lafayette, IN, United States, 18Department of Neuroimaging, Central Institute of Mental Health, Mannheim, Germany, 19Department of Clinical Engineering, Haukeland University Hospital, Bergen, Norway, 20Shandong Medical Imaging Research Institute, Shandong University, Jinan, China, 21Helen Wills Neuroscience Institute, University of California, Berkeley, Berkeley, CA, United States, 22Department of Radiology, University of Calgary, Calgary, AB, Canada, 23Department of Radiology, Ruijin Hospital, Shanghai Jiao Tong University, School of Medicine, Shanghai, China, 24Department of Neurology, BG University Hospital Bergmannsheil, Bochum, Germany, 25Academic Unit of Radiology, University of Sheffield, Sheffield, United Kingdom, 26Department of Radiology, Taipei Veterans General Hospital, National Yang-Ming University, School of Medicine, Taipei, Taiwan, 27Department of Radiology, Maastricht University Medical Center, Maastricht, Netherlands, 28Department of Psychiatry, Columbia University, New York, NY, United States, 29New York State Psychiatric Institute, New York, NY, United States, 30GE Healthcare, Calgary, AB, Canada, 31GE Healthcare, Taipei, Taiwan, 32Department of Psychology, University of Washington, Seattle, WA, United States, 33GE Healthcare, Berlin, Germany, 34Department of Electrical and Computer Engineering, McMaster University, Hamilton, ON, Canada, 35Department of Psychiatry and Behavioral Sciences, Medical University of South Carolina, Charleston, SC, United States, 36Department of Radiology, Children’s Hospital of Philadelphia, Philadelphia, PA, United States, 37Research Imaging Centre, Centre for Addiction and Mental Health, Toronto, ON, Canada, 38Department of Psychiatry, University of Toronto, Toronto, ON, Canada, 39School of Biomedical Engineering, McMaster University, Hamilton, ON, Canada, 40Leuven Research Institute for Neuroscience & Disease (LIND), KU Leuven, Leuven, Belgium, 41Department of Diagnostic and Interventional Radiology, Medical Faculty, Heinrich-Heine-University, Duesseldorf, Germany, 42Department of Functional Neurosurgery, Ruijin Hospital, Shanghai Jiao Tong University School of Medicine, Shanghai, China, 43Department of Biostatistics, Johns Hopkins Bloomberg School of Public Health, Baltimore, MD, United States, 44Institute of Clinical Neuroscience and Medical Psychology, Medical Faculty, Heinrich-Heine-University, Duesseldorf, Germany
Synopsis
In vivo 1H MR spectroscopy (MRS) provides valuable information regarding various brain disorders. In order to enable further clinical acceptance of MRS, this technique needs to be robust across multiple sites and MR vendors. Therefore, we analyzed data from 288 healthy subjects from 25 research sites across the three major vendors and examined vendor-, site- and participant-related effects on metabolites detected by PRESS 1H-MRS at 3T. Within-site and inter-site coefficients of variation were between 2-16%. Significant effects of vendor were found for Ins/tCr and Glx/tCr. Effect of sites contributed ~30% to total variance of all quantified metabolites.
Purpose
Widespread uptake of 1H MR spectroscopy (1H-MRS) in clinical routine has been hindered by the lack of a clear consensus on parameters and the diversity of vendor implementations1 of a given localization sequence, such as PRESS2. The purpose of this study was to investigate the degree of agreement between short-TE MRS data acquired across multiple sites and vendors. Vendor-, site- and participant-related effects on PRESS-localized 1H-MRS data from 25 research sites across the three major vendors were examined.Methods
Data from 288 healthy adults (mean age: 26.5±4.7 years; F/M: 146/142) were collected at 25 sites equipped with GE(8), Philips(10), and Siemens(7) 3T scanners. 5-14 volunteers were scanned at each site. Data were acquired using vendor-specific 1H-MRS PRESS sequence with following common acquisition parameters: TE/TR = 35/2000 ms; 2048 or 4096 data points; 64 total averages; 2, 4 or 5 kHz spectral width; 30x30x30 mm3 mid-parietal voxel. Water-unsuppressed spectra were acquired with similar parameters and 8 or 16 averages. All datasets were pre-processed using an automated pipeline with minimal user interaction based on FID-A3 consisting of coil combination and frequency-and-phase correction. Subsequently, data were quantified with LCModel 6.34 modeling the spectrum from 0.5 to 4.2 ppm. Basis sets consisted of 20 metabolites generated using custom-built fully localized 2D density matrix simulations with real refocusing pulse information5. Eight macromolecular peaks from 0.9 to 3 ppm were simulated in LCModel. Based on different sequence timings, four vendor-specific basis sets were used to fit the data (two for GE, one for Philips and one for Siemens). Metabolite ratios of total NAA (tNAA), total choline (tCho), glutamine+glutamate (Glx) and myo-inositol (Ins) to total creatine (tCr) were reported together with corresponding Cramér-Rao lower bounds (CRLBs), linewidths at full-width half-maximum (FWHM), and signal to noise ratios (SNRs). Each participant was scanned at one site and each site had a scanner manufactured by one vendor. Therefore, 3-level linear mixed-effects modeling6 was used to test for vendor-, site-, and participant-related effects on the quantified metabolites. Significance was determined using chi-square likelihood ratio tests, which were bootstrapped 2,000 times.Results
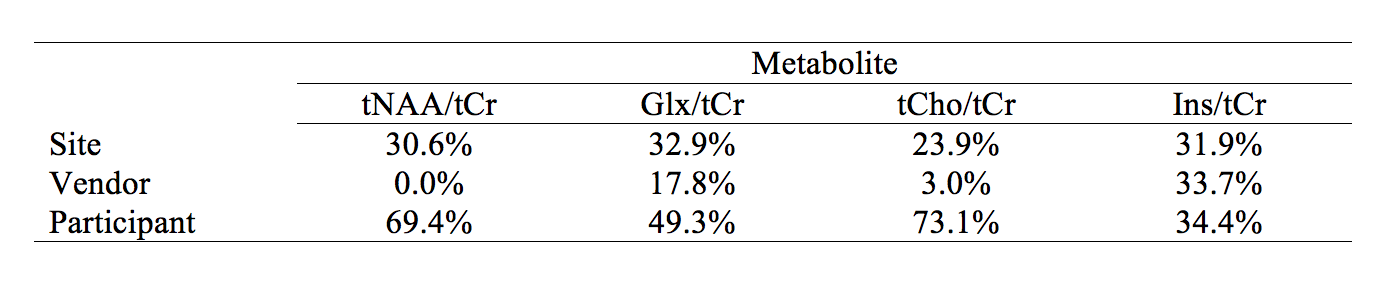
Fig.1 shows the mean spectrum for each vendor. Mean CRLBs across all sites and vendors were (%mean±SD) tNAA; 1.85±0.43, Glx; 4.77±1.06, tCho; 2.91±0.65, tCr; 1.68±0.48, and Ins; 6.70±2.68 (Fig. 2). Mean (± SD) metabolite ratios of tNAA/tCr, Glx/tCr, tCho/tCr and Ins/tCr for every site together with mean within-site and inter-site coefficients of variations (CVs) are shown (Table.3 and Fig.4). Mean LCModel estimated FWHM (Hz) of singlets was 4.79±0.84 for GE, 4.56±1.01 for Philips and 4.16±0.53 for Siemens. Mean SNR was 49.23±9.93 for GE, 50.39±9.52 for Philips and 63.60±10.58 for Siemens. SNR values at the vendor level were significantly higher only for Siemens compared to either GE or Philips (both p=0.003, Holm-Bonferroni-corrected). There were no significant differences in FWHM at the vendor level. The linear mixed-effects modeling revealed significant effects of vendor on Glx/tCr (pboot=0.005) and Ins/tCr (pboot=0.001), but not on tNAA/tCr or tCho/tCr (pboot>0.1). There were significant effects of site on all metabolites (pboot≤0.001). The vendor, site and, participant contributions to total variance are summarized in Table.5.Discussion
Averaged spectra confirm the overall high quality of the data and reveal subtle inter-vendor linewidth and lineshape differences. Noteworthy is the difference in the Ins peak at 4.05ppm between vendors presumably due to differences in water suppression, as well as a higher variance of macromolecular signals in Siemens’ mean spectrum. The accuracy of models used for fitting was manifested by low CRLBs. The reported metabolite ratios were in good agreement with the literature7–9. Observed within-site and inter-site CVs were lower than previous 1H-MRS multi-site studies that reported within-site CVs between 2-30% and inter-site CVs between 2-35%8,10. The effects of site on total variation were similar for all four metabolite ratios and might be affected by site-specific sequence methodology such as different water suppression, outer volume suppression techniques or the common denominator tCr signal. The statistical effect of vendor on J-coupled metabolites (Ins, Glx) (see Table. 5) are likely caused by differences in sequence timings and basis sets across the vendors. Further analysis is needed to examine all the confounding factors that contribute to the overall variation.Conclusion
To our knowledge, this is the largest multi-vendor, multi-site 1H-MRS study conducted in the human brain to date, showing that between vendor differences (at least for the major metabolites) are encouragingly small. The preliminary results presented here may facilitate the understanding of the various factors influencing the high variability of MRS data and thus promote application of 1H-MRS in clinical routine.Acknowledgements
This work was supported by NIH grants R01 EB016089 and P41 EB015909.References
1. G, Ö., JR, A., Barker, P. B., et al. Clinical Proton MR Spectroscopy in Central Nervous System Disorders. Radiology 270, 658–679 (2014).
2. Bottomley, P. Selective volume method for performing localized NMR spectroscopy. US patent 4,480,228 (1984).
3. Simpson, R. et al. Advanced processing and simulation of MRS data using the FID appliance (FID-A) - An open source, MATLAB-based toolkit. Magn. Reson. Med. 77, 23–33 (2017).
4. Provencher, S. W. Automatic quantitation of localized in vivo 1H spectra with LCModel. NMR Biomed. 14, 260–4 (2001).
5. Berrington, A. et al. Improved localisation for 2-hydroxyglutarate detection at 3T using long-TE semi-LASER. Tomogr. 2, 94–105 (2016).
6. Hayes, A. F. A primer on multilevel modeling. Hum. Commun. Res. 32, 385–410 (2006).
7. Baker, E. H. et al. Regional apparent metabolite concentrations in young adult brain measured by 1H MR spectroscopy at 3 Tesla. J. Magn. Reson. Imaging 27, 489–99 (2008).
8. Träber, F. et al. A multicenter reproducibility study of single-voxel 1H-MRS of the medial temporal lobe. Eur. Radiol. 16, 1096–1103 (2006).
9. Komoroski, R. A. et al. Brain metabolite concentration ratios in vivo: Multisite reproducibility by single-voxel 1H MR spectroscopy. Magn. Reson. Imaging 22, 721–725 (2004).
10. Deelchand, D. K. et al. Two-site reproducibility of cerebellar and brainstem neurochemical profiles with short-echo, single-voxel MRS at 3T. Magn. Reson. Med. 1725, 1718–1725 (2014).
Figures