0159
To which extent the Cramér-Rao bound (CRB) is a reliable benchmark in quantitative MRS?1AgroResonance - UR370 QuaPA, INRA, Saint Genès Champanelle, France
Synopsis
Following MRS data fitting, absolute or relative Cramér-Rao bounds (CRB and rCRB, respectively) are often computed as indices of parameter uncertainties. However, the unknown true values of parameters are required to compute CRB. Here, we studied the effect of substituting the true values by the noisy estimates on the bounds (noted CRB* and rCRB*). We showed by simulations that both CRB* and rCRB* are particularly sensitive to noise. Also, the mode of rCRB* distribution is left-shifted, which leads to a significant false positive risk when rCRB* is thresholded. A threshold not exceeding 20% is recommended to limit this risk.
Introduction
Quantification of complex mixtures from noisy NMR spectra is generally based on the fit of a parametric model to the data. A popular indicator of quantification reliability is the Cramér-Rao bound (CRB) and its relative expression rCRB. CRB provides the minimal variances obtained by the best estimator. However, as parameter true values are required to compute CRB, only an estimate of CRB, i.e. CRB* (and its relative counterpart rCRB*), can be obtained from noisy data. Here, we analyzed by computer simulations the consequences of substituting parameter true values by estimates on CRB* and rCRB* of peak amplitudes.
Methods
FID
signals mimicking spectra of various complexities were computed. For each
condition, 105 noisy FIDs were generated by adding zero-mean complex
Gaussian noise to the FID. Parameter estimates were then fitted in the least
squares sense using the exact model (i.e. sum of exponentially damped sinusoids).
CRB* and rCRB* were computed from each of the 105 sets of estimates.
These Monte-Carlo simulations allowed obtaining smooth probability density
functions (pdfs) for (r)CRB* at different noise levels, i.e. which correspond
to different level of true rCRB. Because rCRB* is currently compared to a
threshold for accepting or rejecting an estimate of metabolite concentration, the
probabilities to wrongly accept or reject a fitted spectrum were also
calculated.Results
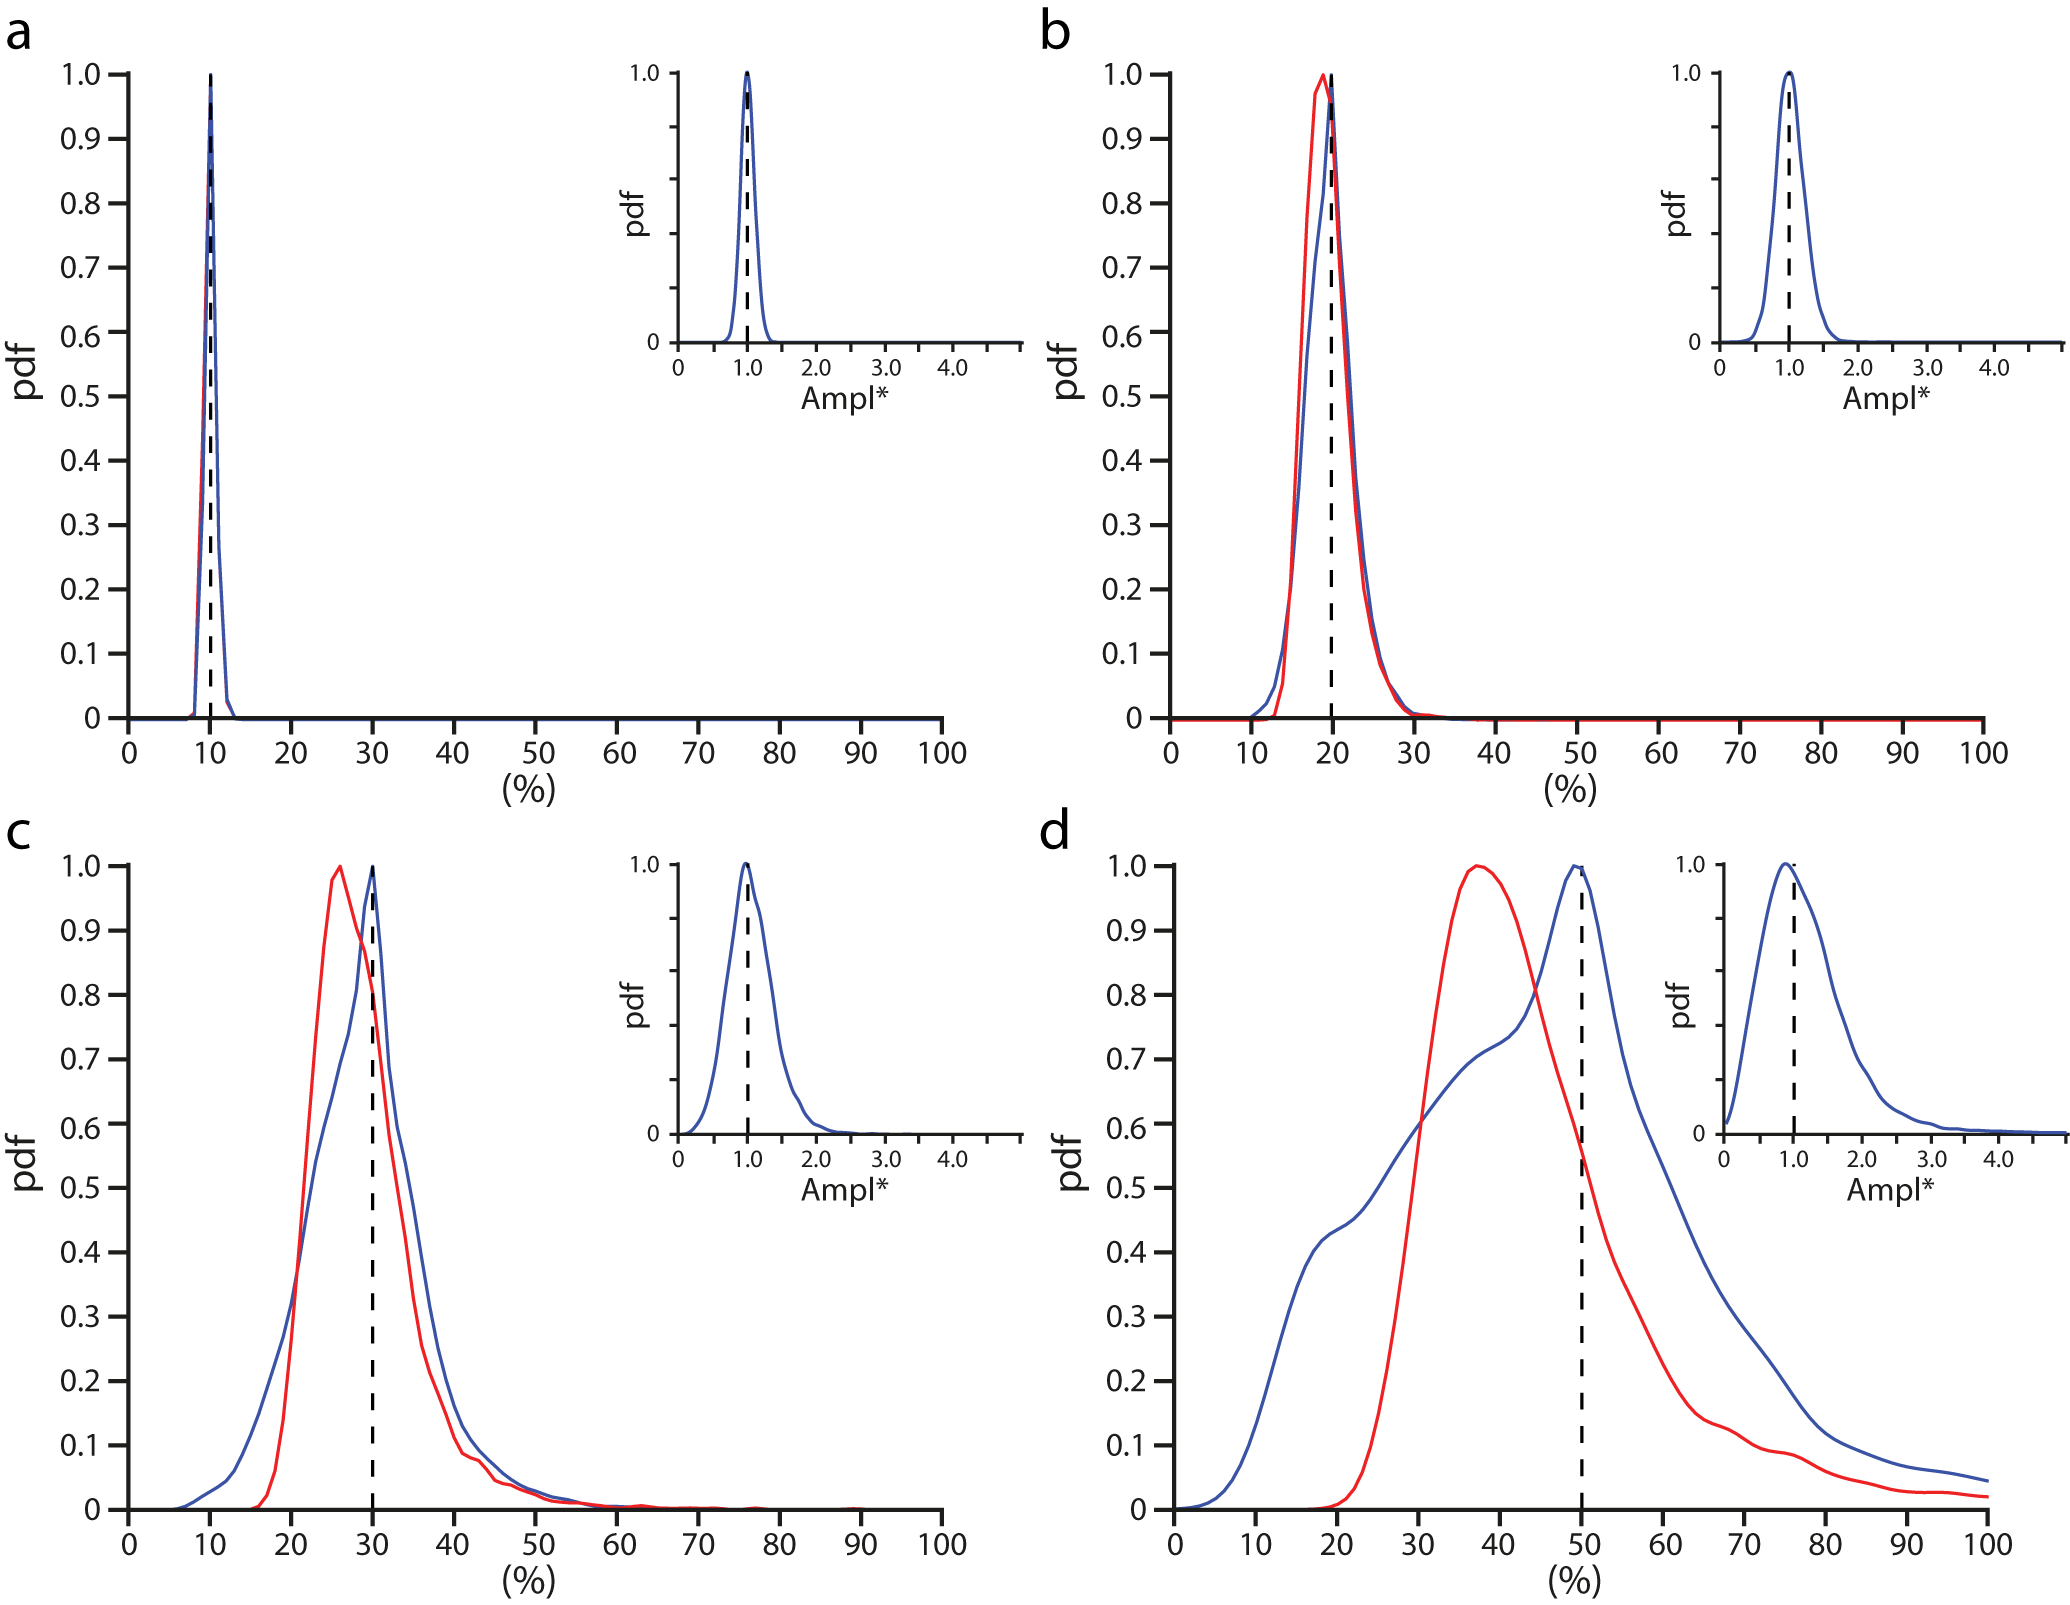
Figure
1 represents the evolution of the CRB* and rCRB* pdfs for the peak amplitude
parameter as function of rCRB values, i.e. several noise levels. Because of
noise propagation, the width of CRB* and rCRB* pdfs rapidly increases with
rCRB. rCRB* distribution has the specificity of showing a left asymmetry. It
thus tends to indicate a lower value than the ground truth. The insets in Fig.
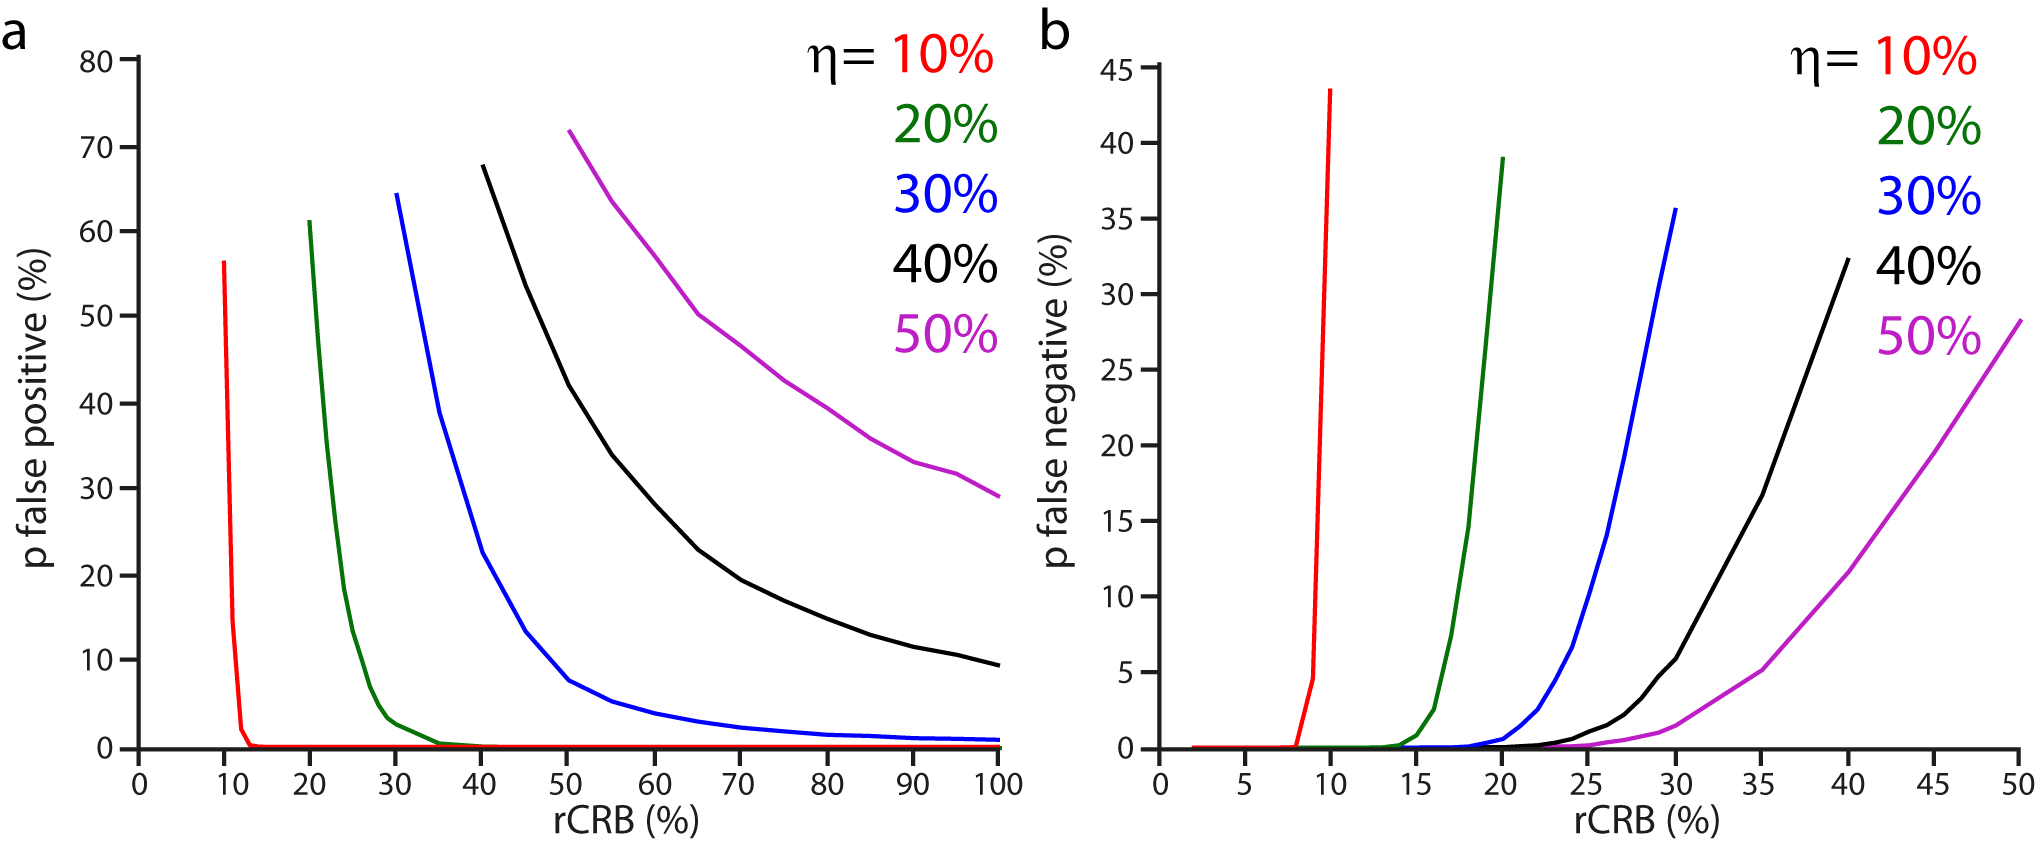
1 display the pdfs for the peak amplitude estimates. Besides, both false positive
and negative risks were calculated for several thresholds η as shown on Fig. 2. It can be noted that the
curves are steeper for lower η. It indicates that, by keeping η small, incorrect rejection and false acceptance
errors are likely to occur only when rCRB is close to the threshold.Discussion
Recently, several papers warned on the use of rCRB* as fitting quality
indicator.1,2 We show here that, beyond a noise level corresponding
to an rCRB of around 10%, the uncertainties on both CRB* and rCRB* cannot be
neglected. In other words, substituting the true values of parameters by noisy estimates
lead to CRB* which are likely to be far from the minimal variances. As expected,
how CRB* deviates from its true value increases with noise level (Fig. 1). Besides,
Kreis recently suggested to use the CRB* instead of the rCRB*.2 Our
data show that the modes of the CRB* distributions well match to the CRBs. However,
the width of the CRB* pdf is larger than the one of rCRB*.
rCRB* is currently used as an
acceptance/rejection criterion when compare to a threshold. To limit the false
positive and negative risks, the threshold should be set with caution. For
example, for a true rCRB of 80%, almost one time out of two noisy rCRB* were
below 50% (purple curve in Fig. 2a). Reducing the threshold to 20% limits this
risk to nearly zero (Fig. 2a, green curve).Conclusion
Both CRB* and rCRB* of peak amplitudes are spoiled by noise. In accordance with the well-known compromise between precision and accuracy, CRB* provides more accurate indications than rCRB*, but less precise. Notably, rCRB* is prone to the underestimation of the variance. Consequently, when an amplitude estimate is accepted or rejected according to its rCRB* in MRS, a conservative threshold cutoff level of 20% should not be exceeded to limit the risk of false positives.Acknowledgements
References
1. Tisell A, Leinhard OD, Warntjes JBM, Lundberg P. Procedure for quantitative 1H magnetic resonance spectroscopy and tissue characterization of human brain tissue based on the use of quantitative magnetic resonance imaging. Magn Reson Med. 2013;70(4):905-915.
2. Kreis R. The trouble with quality filtering based on relative Cramér-Rao lower bounds. Magn Reson Med. 2016;75(1):15-18.
Figures