0158
A novel structured low-rank framework for ghost removal and denoising of EPSI data1Electrical and Computer Engineering, The University of Iowa, Iowa City, IA, United States, 2GE Healthcare, Postdam, Germany, 3GE Global Research, Munich, Germany
Synopsis
Spectral interleaving is often used in echoplanar spectroscopic imaging (EPSI) sequences to achieve high spatial and spectral resolution, especially on high field scanners with larger chemical shift dispersion. Unfortunately, a major roadblock is the spurious Nyquist ghost artifacts, resulting from phase errors between interleaves. We introduce a novel framework, that simultaneously capitalizes on annihilation relation between the interleaves introduced by phase relations, as well as a linear predicability of the spectra, to remove the phase errors and to provide spectral denoising of the spectra. In addition, we also exploit on the low-rank structure of the EPSI data to provide additional spatial denoising, which will further improve the signal to noise ratio of the datasets.
Introduction
Echo-planar spectroscopic imaging (EPSI) [1,2], which relies on echo-planar readouts to simultaneously encode one spectral and one spatial dimension, is a popular approach for rapid MRSI. Spectral interleaving is often used to simultaneously achieve high spectral and spatial resolution, which is an important need on high field systems that offer higher signal to noise ratio(SNR) and higher chemical shift dispersion. Specifically, multiple datasets are acquired with low temporal sampling rate, but with different temporal shifts between the readouts (see Fig. 1 for details); the interleaves are later interlaced to construct the final spectrum. A challenge in this approach is the phase inconsistencies between the interleaves, resulting from timing errors in the applied gradient trains, drifts in the magnetic field, and field inhomogeneity distortions. These errors manifest as spurious Nyquist ghost peaks in the spectral domain; associated line-shape variations and baseline fluctuations make the quantification of relatively weak metabolites rather challenging. We introduce a novel correction strategy, which exploits the annihilation relations resulting from phase relations between the interleaves and linear predictability of exponential signals.Methods
We consider the recovery of two MRSI datasets $$$\mathbf{P_o}$$$ and $$$\mathbf{P_e}$$$, corresponding to odd and even interleaves from their interleaved measurements $$$\mathcal{A_o}(\mathbf{P_o})=\mathbf{G_o}$$$ and $$$\mathcal{A_e}(\mathbf{P_e})=\mathbf{G_e}$$$, respectively, where $$$\mathcal{A}$$$ is the undersampling operator. We aim to recover the rows of the datasets, which are the FID signals. Note that $$$\mathbf{G_o}$$$ and $$$\mathbf{G_e}$$$ are uniformly undersampled in time. Our focus is to fill in the missing FID samples, while compensating for phase errors. The FID signal of a specific pixel $$$\rho^{(i)}[n]=\mathbf{P[i,n]}$$$ can be safely modeled as a multi-exponential: $$\rho[n]=\sum_{k=1}^K c_k \;\nu_k^n; ~~ n=0,..,N-1,~~~~~(1)$$ where $$$\nu_k=\exp\left\{-\left(1/T_{2,k}^* + j 2\pi f_k \right)T\right\}$$$ are the exponential parameters. Such exponential signals satisfy an annihilation relation $$$\rho*h=0$$$,[3,4] where $$$h$$$ is an finite impulse response(FIR) filter of the form $$$h(z)=\prod_{i=1}^{K}\left(1- \nu_k z^{-1}\right)$$$. This annihilation relation can be expressed as $$\mathcal{T}(\boldsymbol\rho)~\mathbf{h}=0,~~~~~(2)$$ where $$$\mathcal{T}(\boldsymbol{\rho})$$$ is a Toeplitz convolution matrix. We model the phase distortions in the odd and even interleaves as convolutions by FIR filters $$$g_{\rm{e}}$$$ and $$$g_{\rm{o}}$$$, respectively. Specifically, we assume that $$$\rho_{o}=\rho*g_{o}$$$ and $$$\rho_{e}=\rho*g_{e}$$$. In this case, there exists annihilation relations $$$\rho_{o}*g_{e}-\rho_{e}*g_{o}=0$$$. These relations, along with eq(2), can be compactly expressed in the matrix form as $$\underbrace{\begin{bmatrix}\mathcal{T}(\boldsymbol\rho_o)&\mathcal{T}(\boldsymbol\rho_e)\end{bmatrix}}_{\mathcal{H}(\boldsymbol \rho_o,\boldsymbol\rho_e)}\begin{bmatrix}\mathbf{h} & \mathbf{0} & \mathbf{g_e}\\ \mathbf{0} & \mathbf{h} &-\mathbf{g_o}\end{bmatrix}=0~~~~~(3)$$. The above relations imply that the matrix $$$\mathcal{H}(\boldsymbol{\rho_o},\boldsymbol{\rho_e})$$$ is low-rank. We use the above low-rank property to jointly recover the odd and even datasets: $$\{\mathbf{P_{o}},\mathbf{P_{e}}\}=\arg \min_{\mathbf{P_{o}},\mathbf{P_{e}}}\|\mathcal{A_o}(\mathbf{P_{o}})-\mathbf{G_o}\|^2+\|\mathcal{A_e}(\mathbf{P_{e}})-\mathbf{G_e}\|^2+\lambda_{1}\sum_{i=1}^{N_{\rm{pixels}}}\left\|\mathcal{H}(\boldsymbol\rho_o^{(i)},\boldsymbol\rho_e^{(i)})\right\|_{*}+\lambda_{2}\left[\|\underbrace{\mathbf{P_{o}}\|_{*}+\|\mathbf{P_{e}}}_{\text{Casortai low-rank}}\|_{*}\right]~~~~~(4)$$. The third term synergistically uses the spectral & phase-induced annihilation relations, enables the removal of phase errors and provides spectral denoising. The combination of priors also eliminates the trivial solution introduced by structured sampling[5]. The last term is the sum of nuclear norms of the Casorati matrices $$$\mathbf{P_{o}}$$$ and $$$\mathbf{P_{e}}$$$, which facilitates in further spatial denoising high resolution MRSI data.Results
We perform experiments on two datasets. The first dataset is a 13C hyperpolarized mouse kidney MRSI data, collected using a 9.4T small animal imaging scanner (Bruker BioSpin MRI GmbH, Germany)[6]. Axially oriented slice containing mouse kidney of 3 mm thickness was selected. EPSI data of matrix size 64×64 was collected using a bipolar gradient with 64 spectral points. Combination of odd and even echoes achieved a spectral bandwidth of 1562.5Hz. The second data was acquired from a volunteer on a GE MR750W 3T scanner at the University of Iowa using a 32-channel head coil. A press-box based EPSI acquisition scheme with flyback trajectory was used to collect a 64×64 sampled data with 8 averages for an axial slice of FOV=22×22×10cm3. The readout bandwidth is 600Hz and 256 spectral points was achieved using two interleaves. The scan time was about 8 mins and the residual water was removed in the post-processing stage. For Dataset 1, which had high signal only the annihilation relations are used by assigning $$$\lambda_{2}=0$$$ in eq(4).
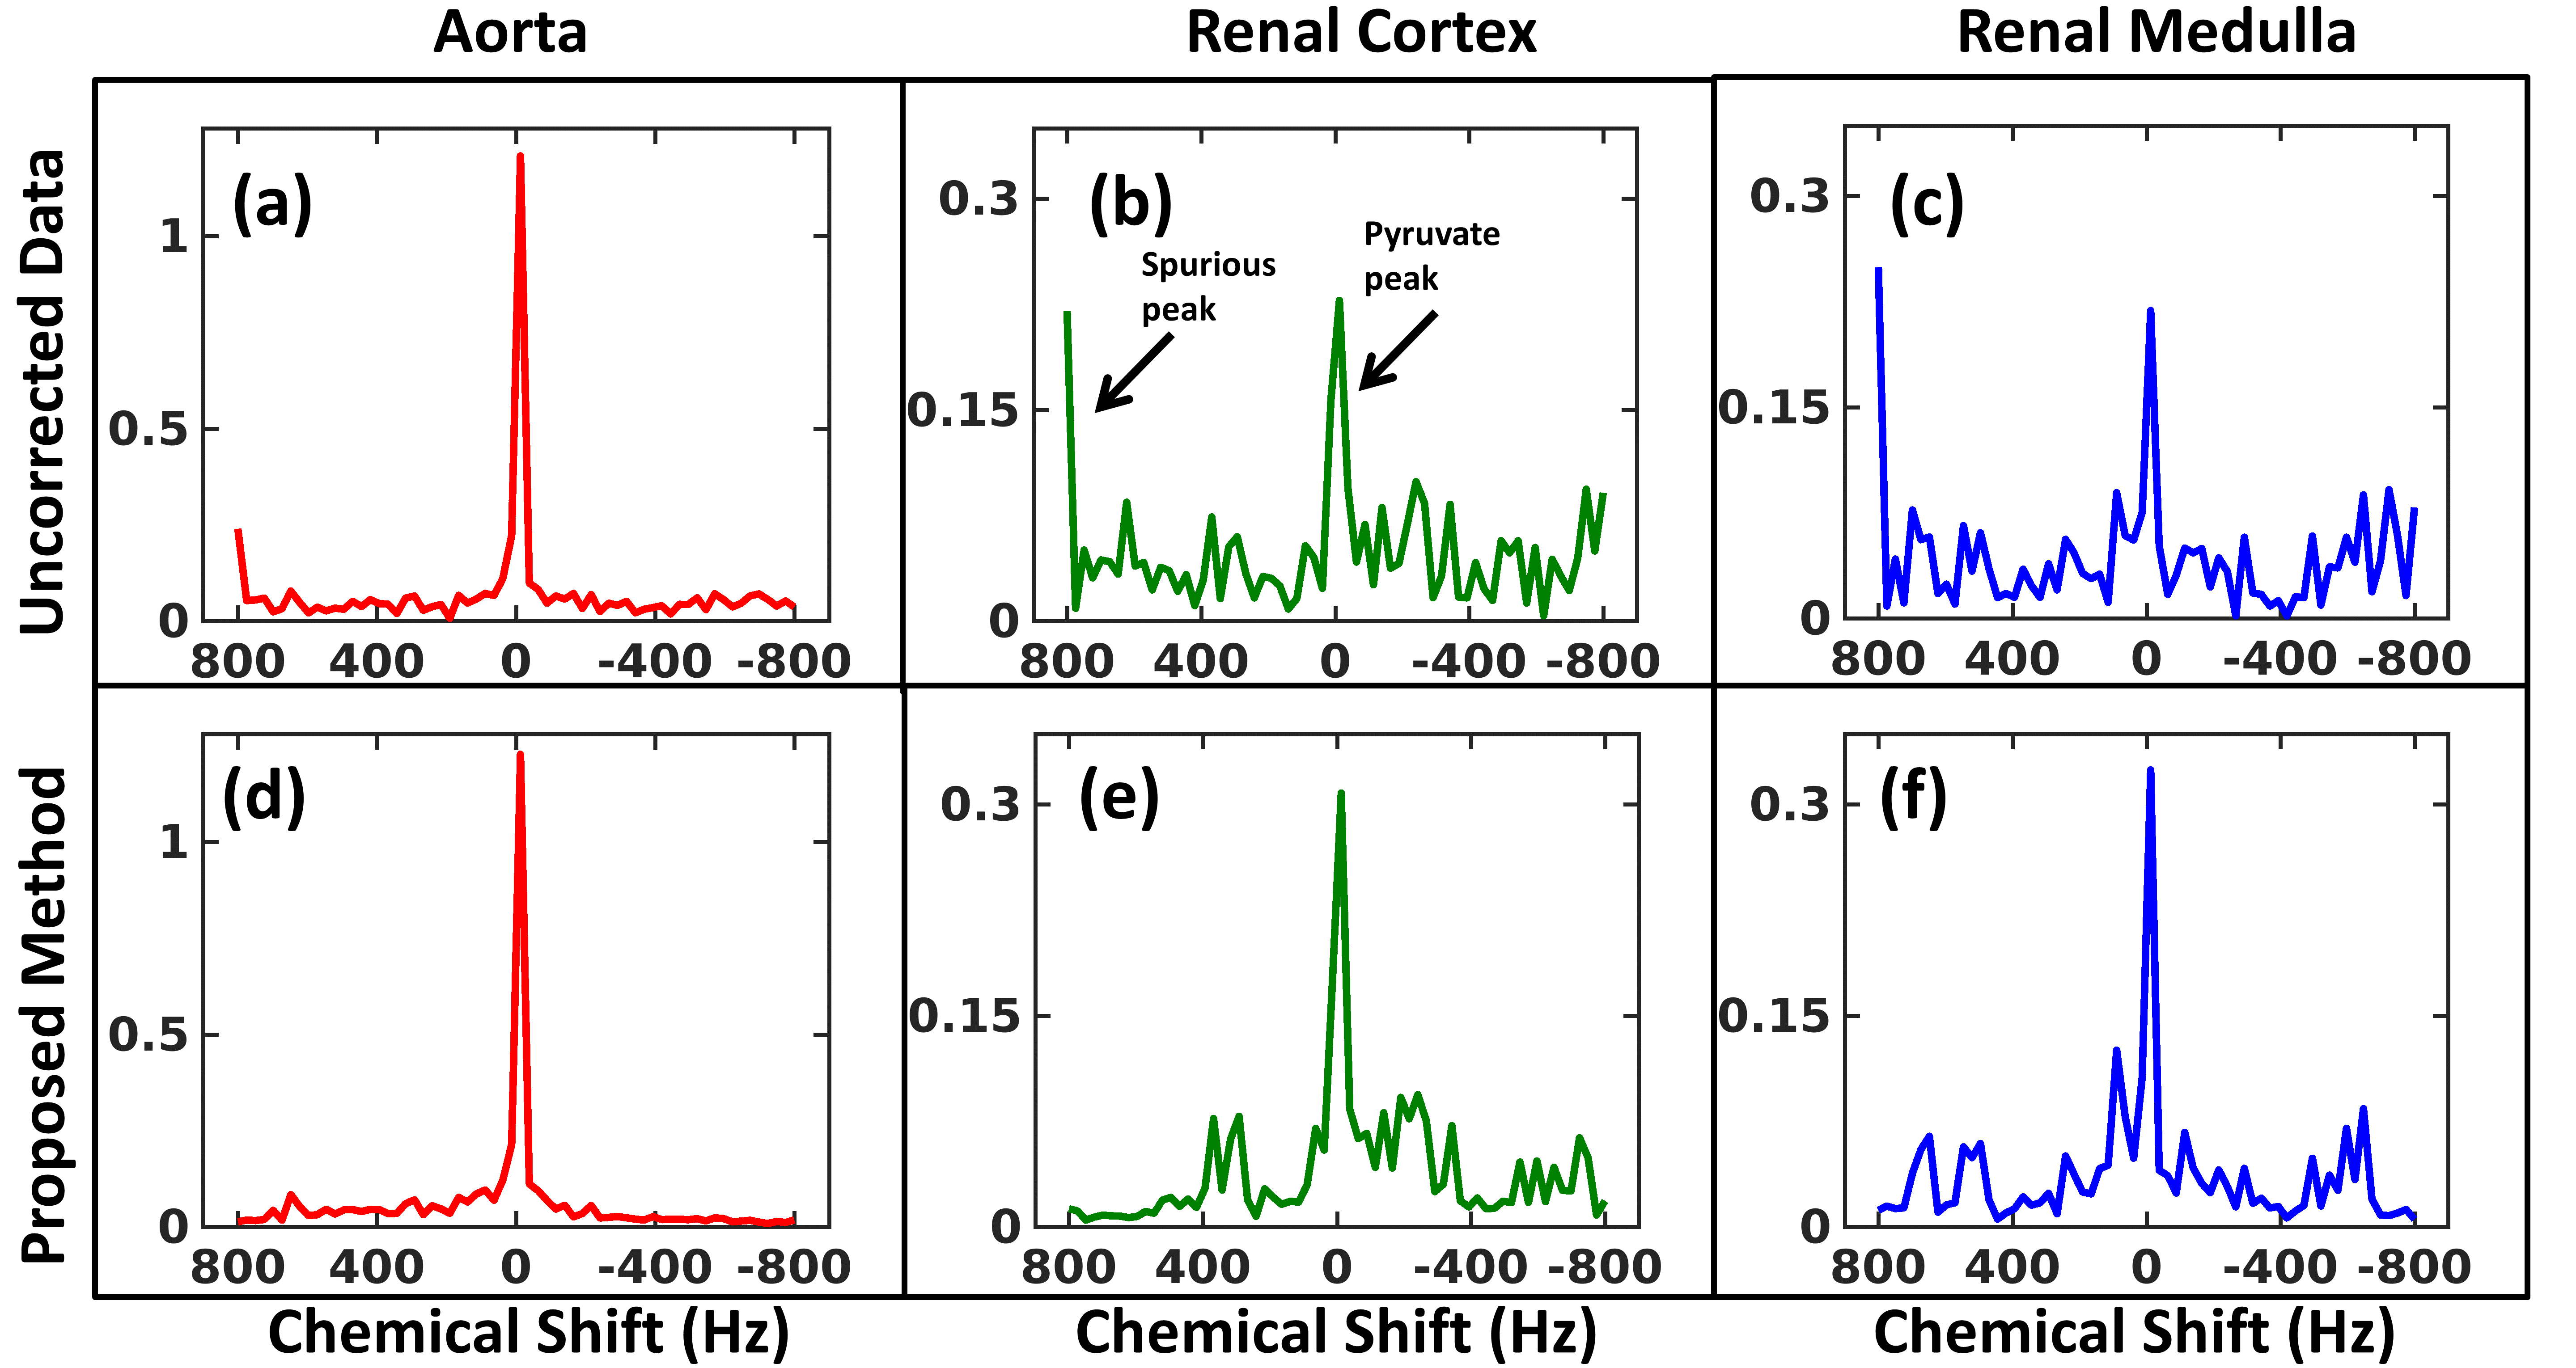
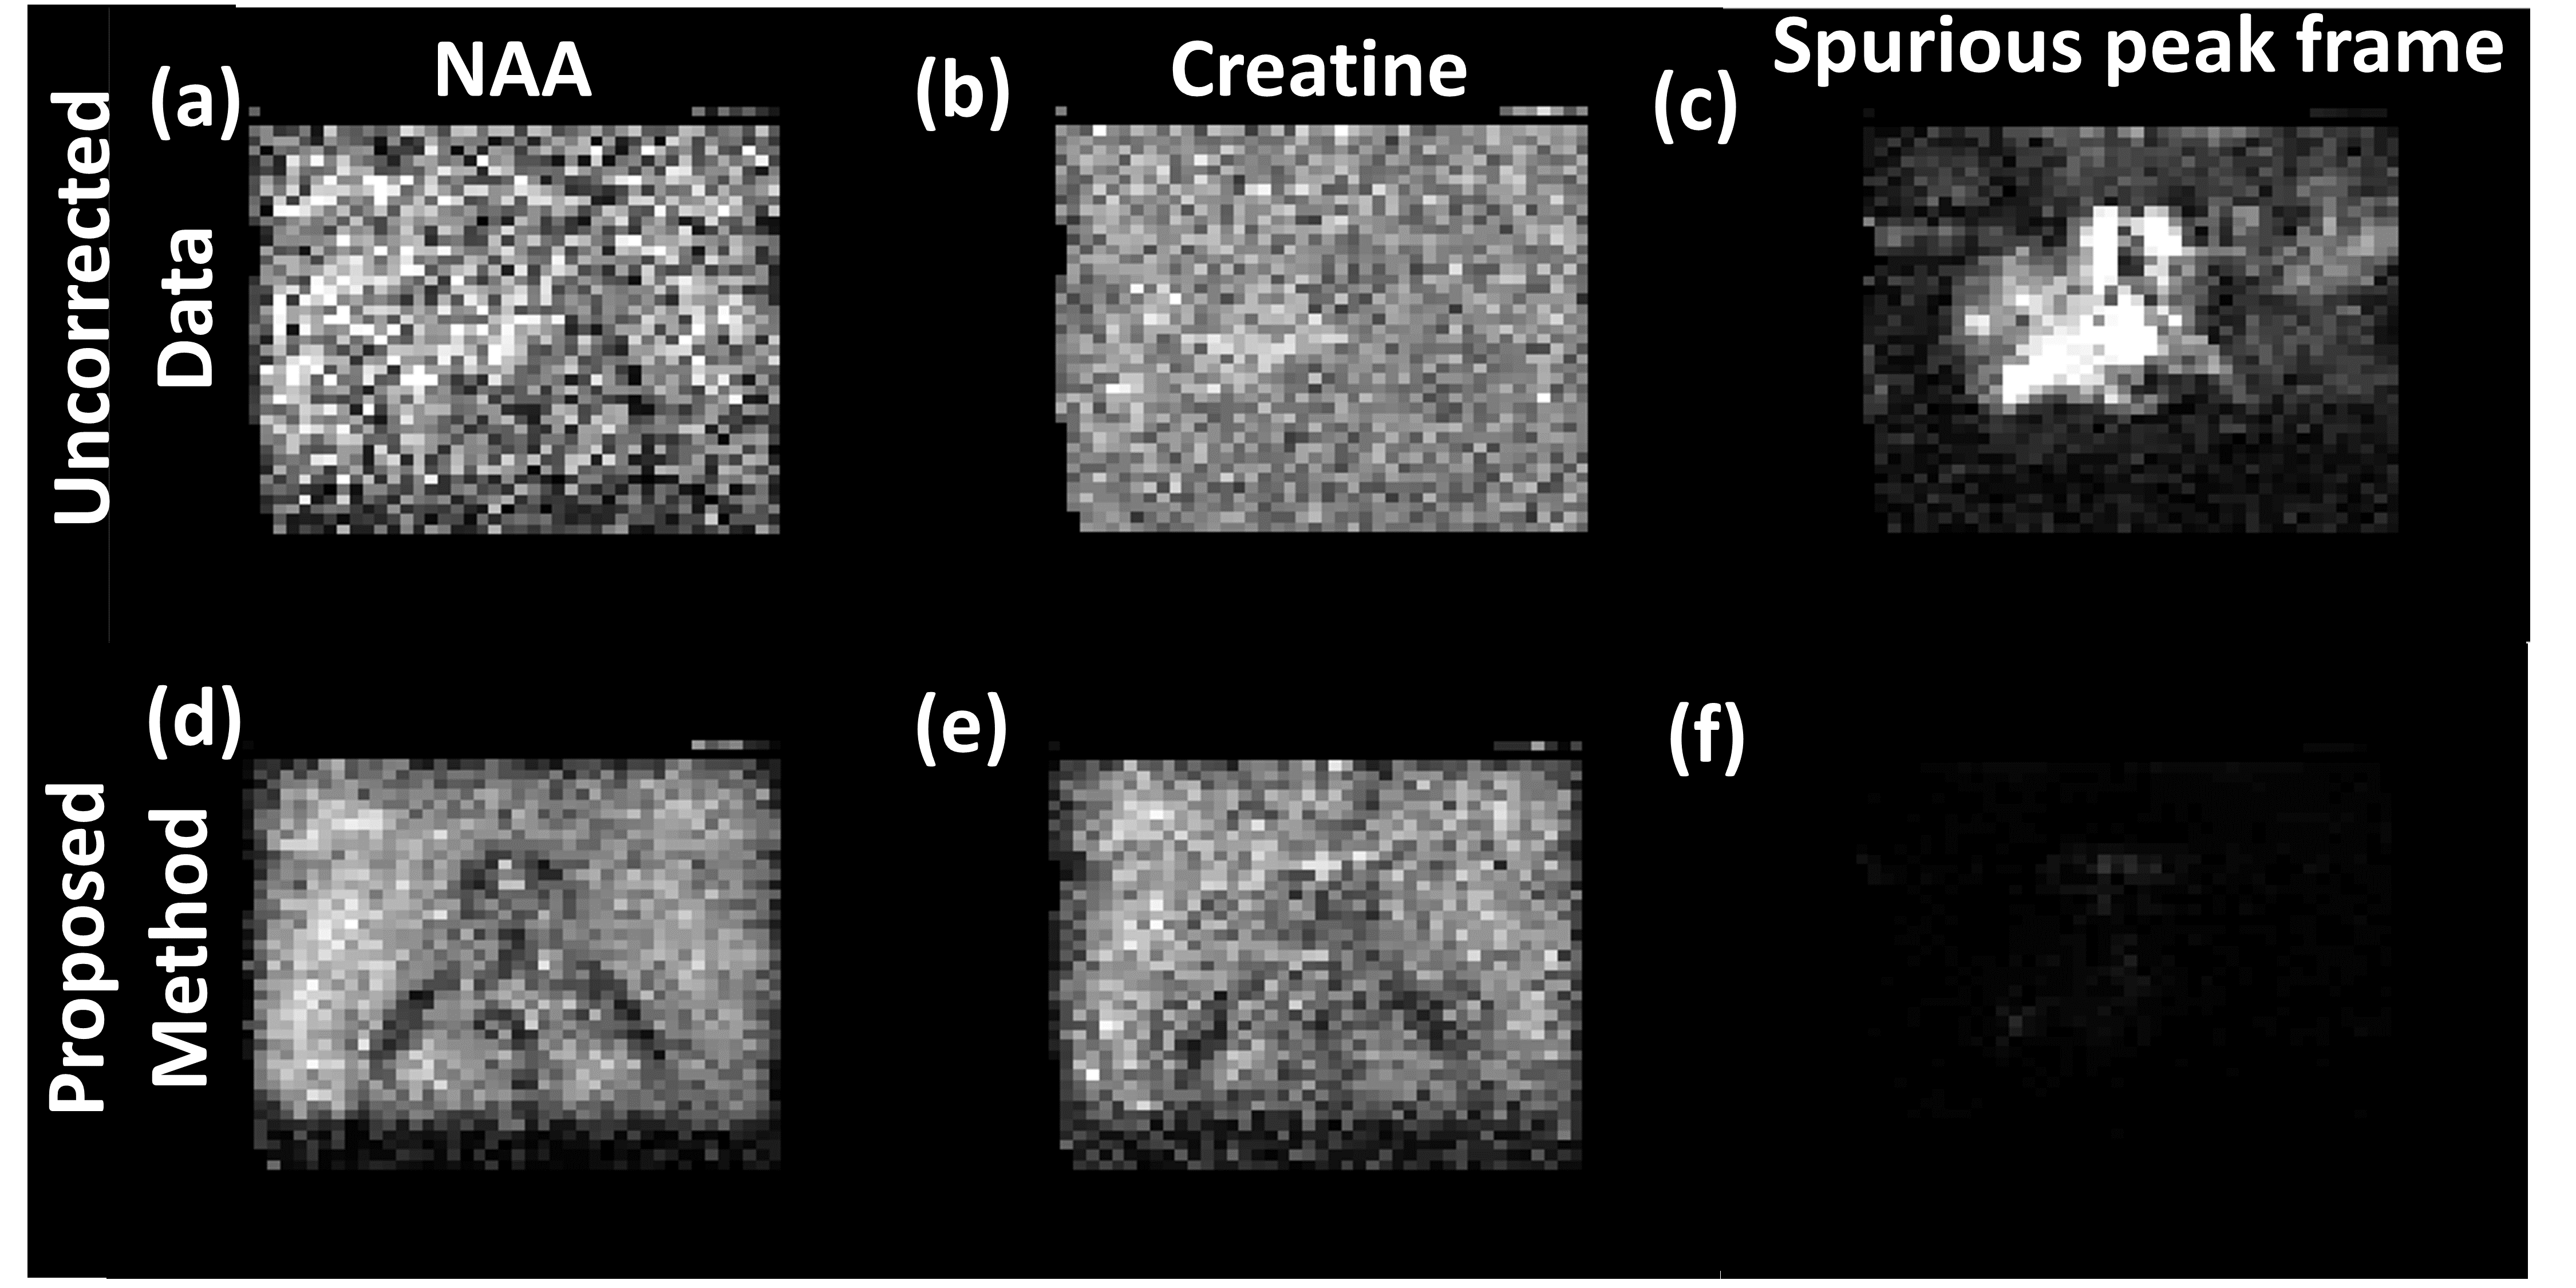
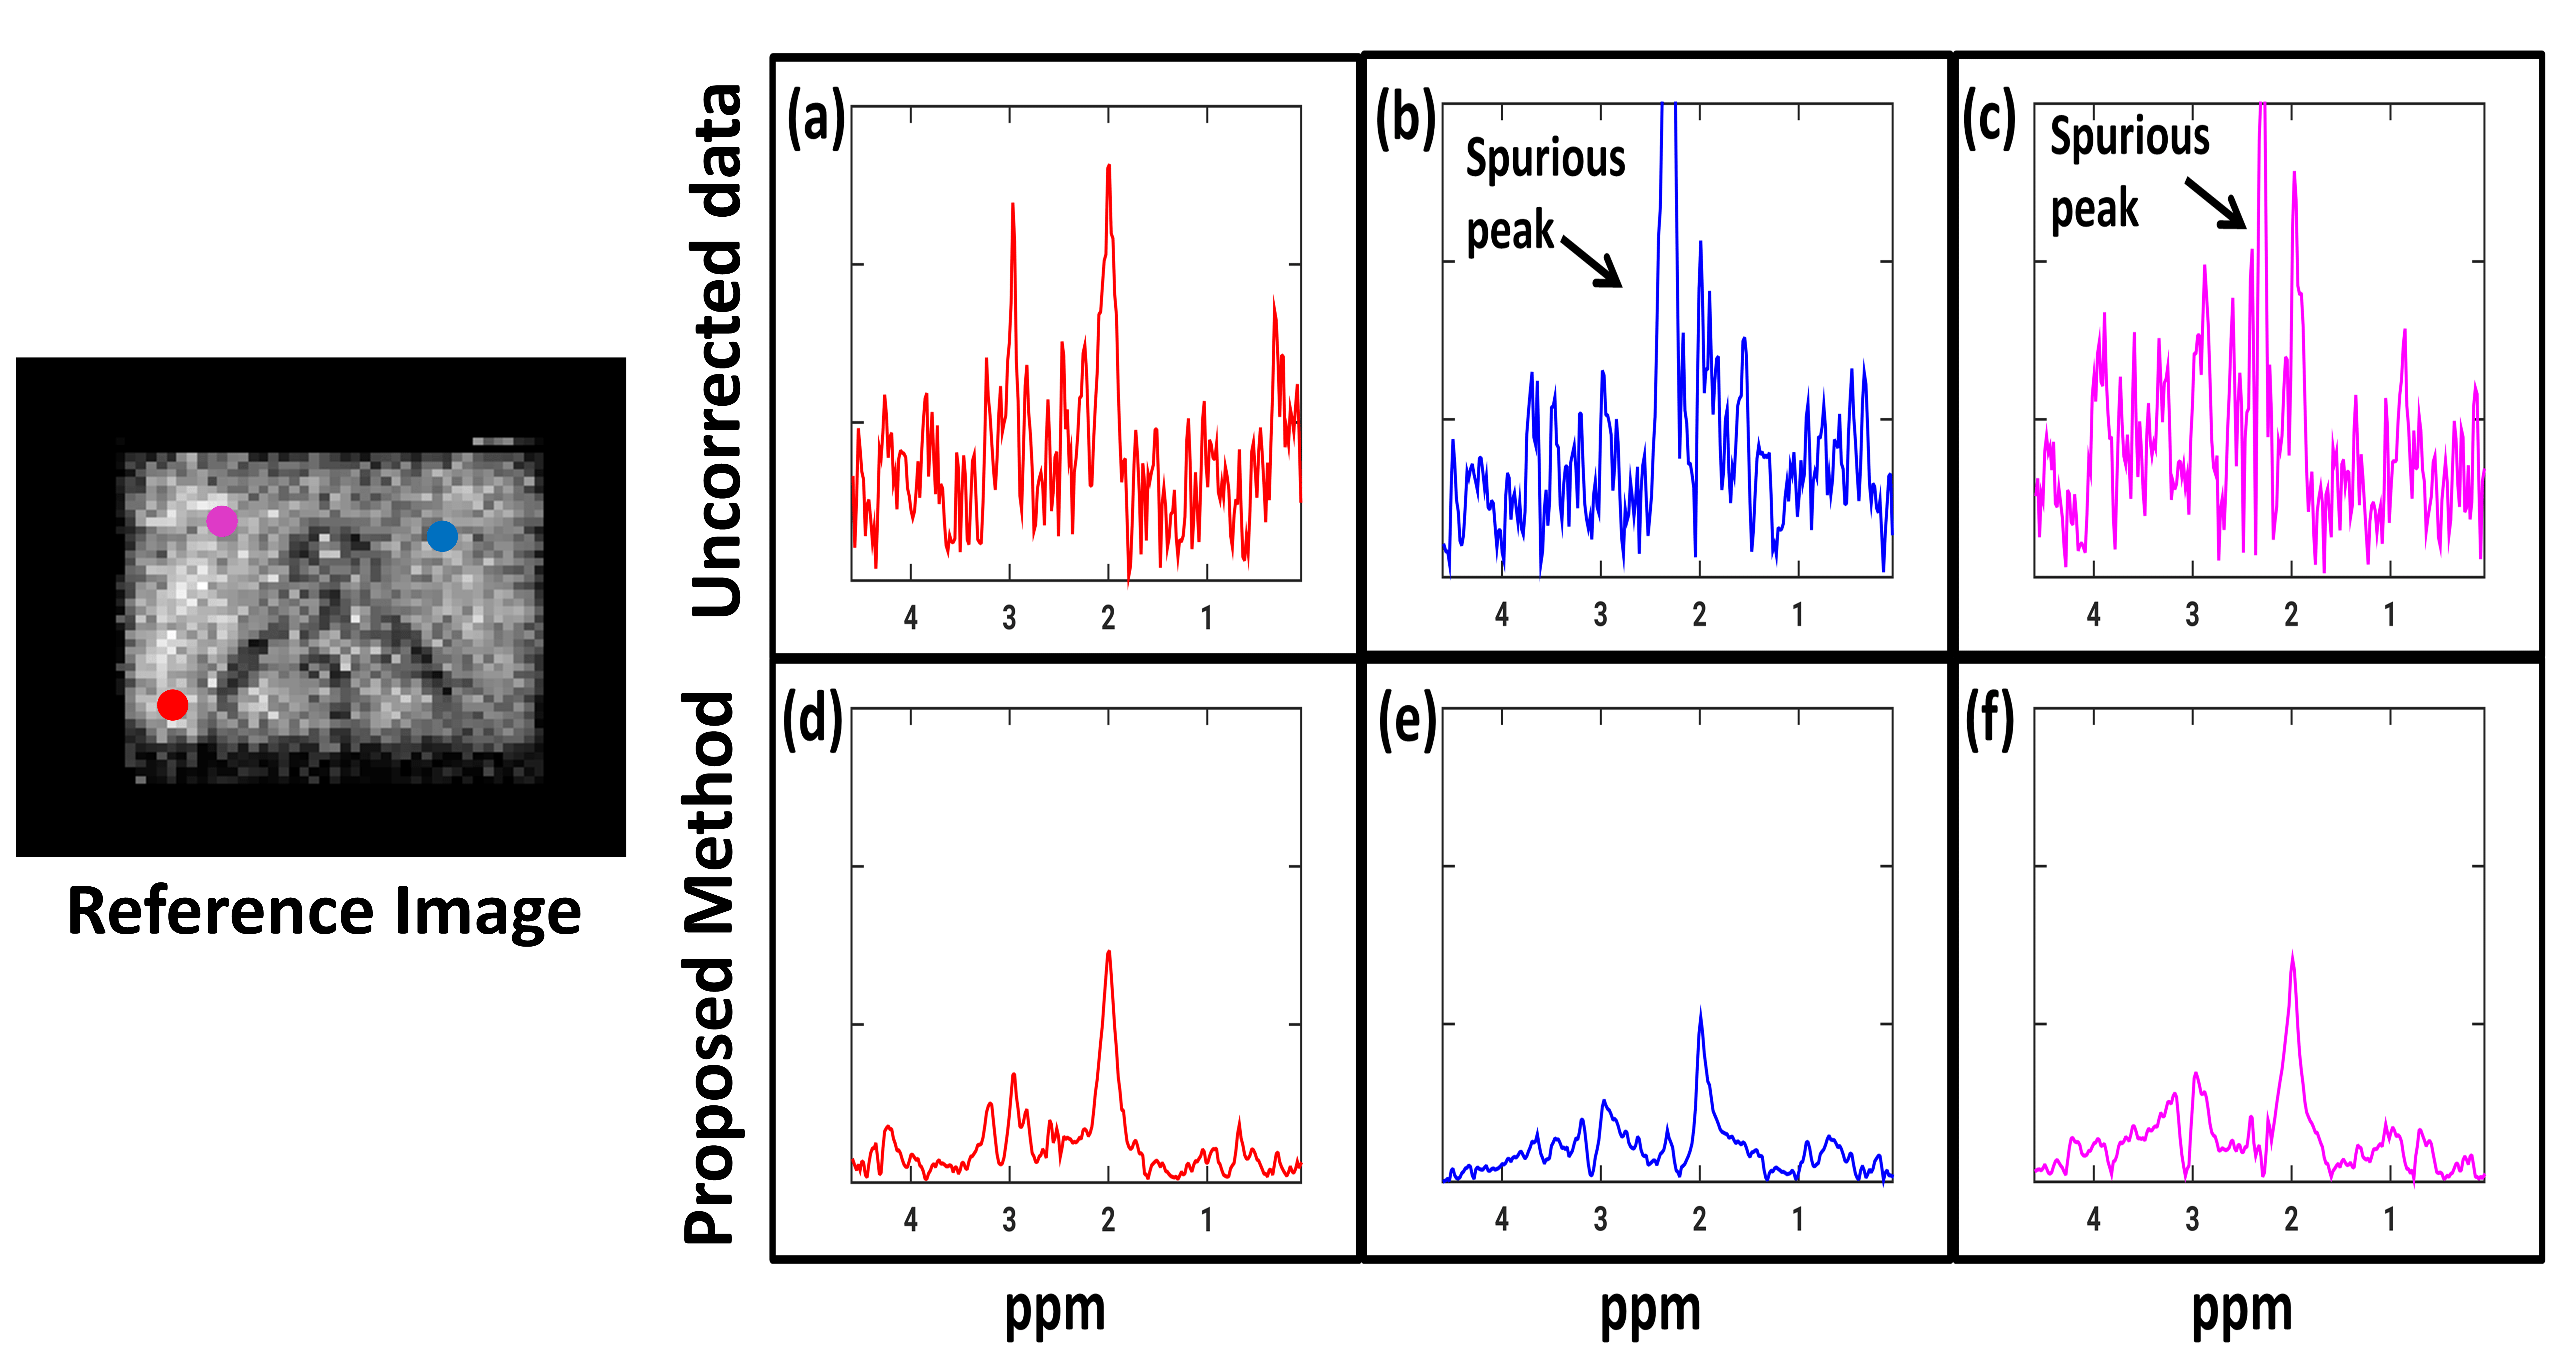
The pyruvate maps exhibit increased SNR as shown by the arrows in Fig. 2(f) whereas the spurious peak frame shows reduced intensity after reconstruction signifying removal of spurious peaks. The spectra in Fig.3 from three regions of the kidney (aorta, cortex & medulla) show complete removal of spurious peaks and also exhibits denoising. For dataset 2 we added the Casorati based denoising as the dataset had poor signal. The results(Fig.4) show increased Creatine and NAA signal where we can see the ventricles after reconstruction. The spurious peak frame shows removal of artifacts. The spectra(Fig.5) also exhibit improved SNR and is devoid of artifacts.
Conclusion
We demonstrated a novel algorithm for denoising and deinterleaving of EPSI data without directly estimating phase or relying on theoretical k-space trajectory. The proposed scheme is highly beneficial for addressing this common problem for the MRSI community and especially useful for high field magnets.Acknowledgements
This work is supported by grants NIH 1R01EB019961-01A1 and ONR- N000141310202. The 13C Hyperolarized MRSI data used in the study was provided by Hansol Lee and Dong-Hyun Kim of Yonsei University College of Medicine, Seoul, Republicof Korea.References
1 Stefan Posse, Gioacchino Tedeschi, Robert Risinger, Robert Ogg, and Denis Le Bihan, “High speed 1H spectroscopic imaging in human brain byecho planar spatial-spectral encoding,” Magnetic resonance in medicine, vol. 33, no. 1, pp. 34–40, 1995.
2 Stefan Posse, Stephen R Dager, Todd L Richards, Chun Yuan, Robert Ogg, Alan A Artru, Hans-Wilhelm M¨uller-G¨artner, and Cecil Hayes, “In vivomeasurement of regional brain metabolic response to hyperventilation using magnetic resonance: proton echo planar spectroscopic imaging (pepsi),”Magnetic resonance in medicine, vol. 37, no. 6, pp. 858–865, 1997.
3 Arvind Balachandrasekaran, Vincent Magnotta, and Mathews Jacob, “Recovery of damped exponentials using structured low rank matrix completion,”arXiv preprint arXiv:1704.04511, 2017.
4 Petre Stoica and Randolph L Moses, Introduction to spectral analysis, vol. 1, Prentice hall Upper Saddle River, New Jersey, USA, 1997.
5 Rodrigo A Lobos, Tae Hyung Kim, W Scott Hoge, and Justin P Haldar, “Navigator-free epi ghost correction using low-rank matrix modeling:Theoretical insights and practical improvements,” in Proc. ISMRM, 2017, p. 0449.
6 Hansol Lee, Jae E Song, Jaewook Shin, Eunhae Joe, Young-suk Choi, Ho-Taek Song, and Dong-Hyun Kim, “High resolution hyperpolarized 13cmrsi acquired by applying spice in mouse kidney,” in Proc. ISMRM, 2017, p. 3698.
Figures
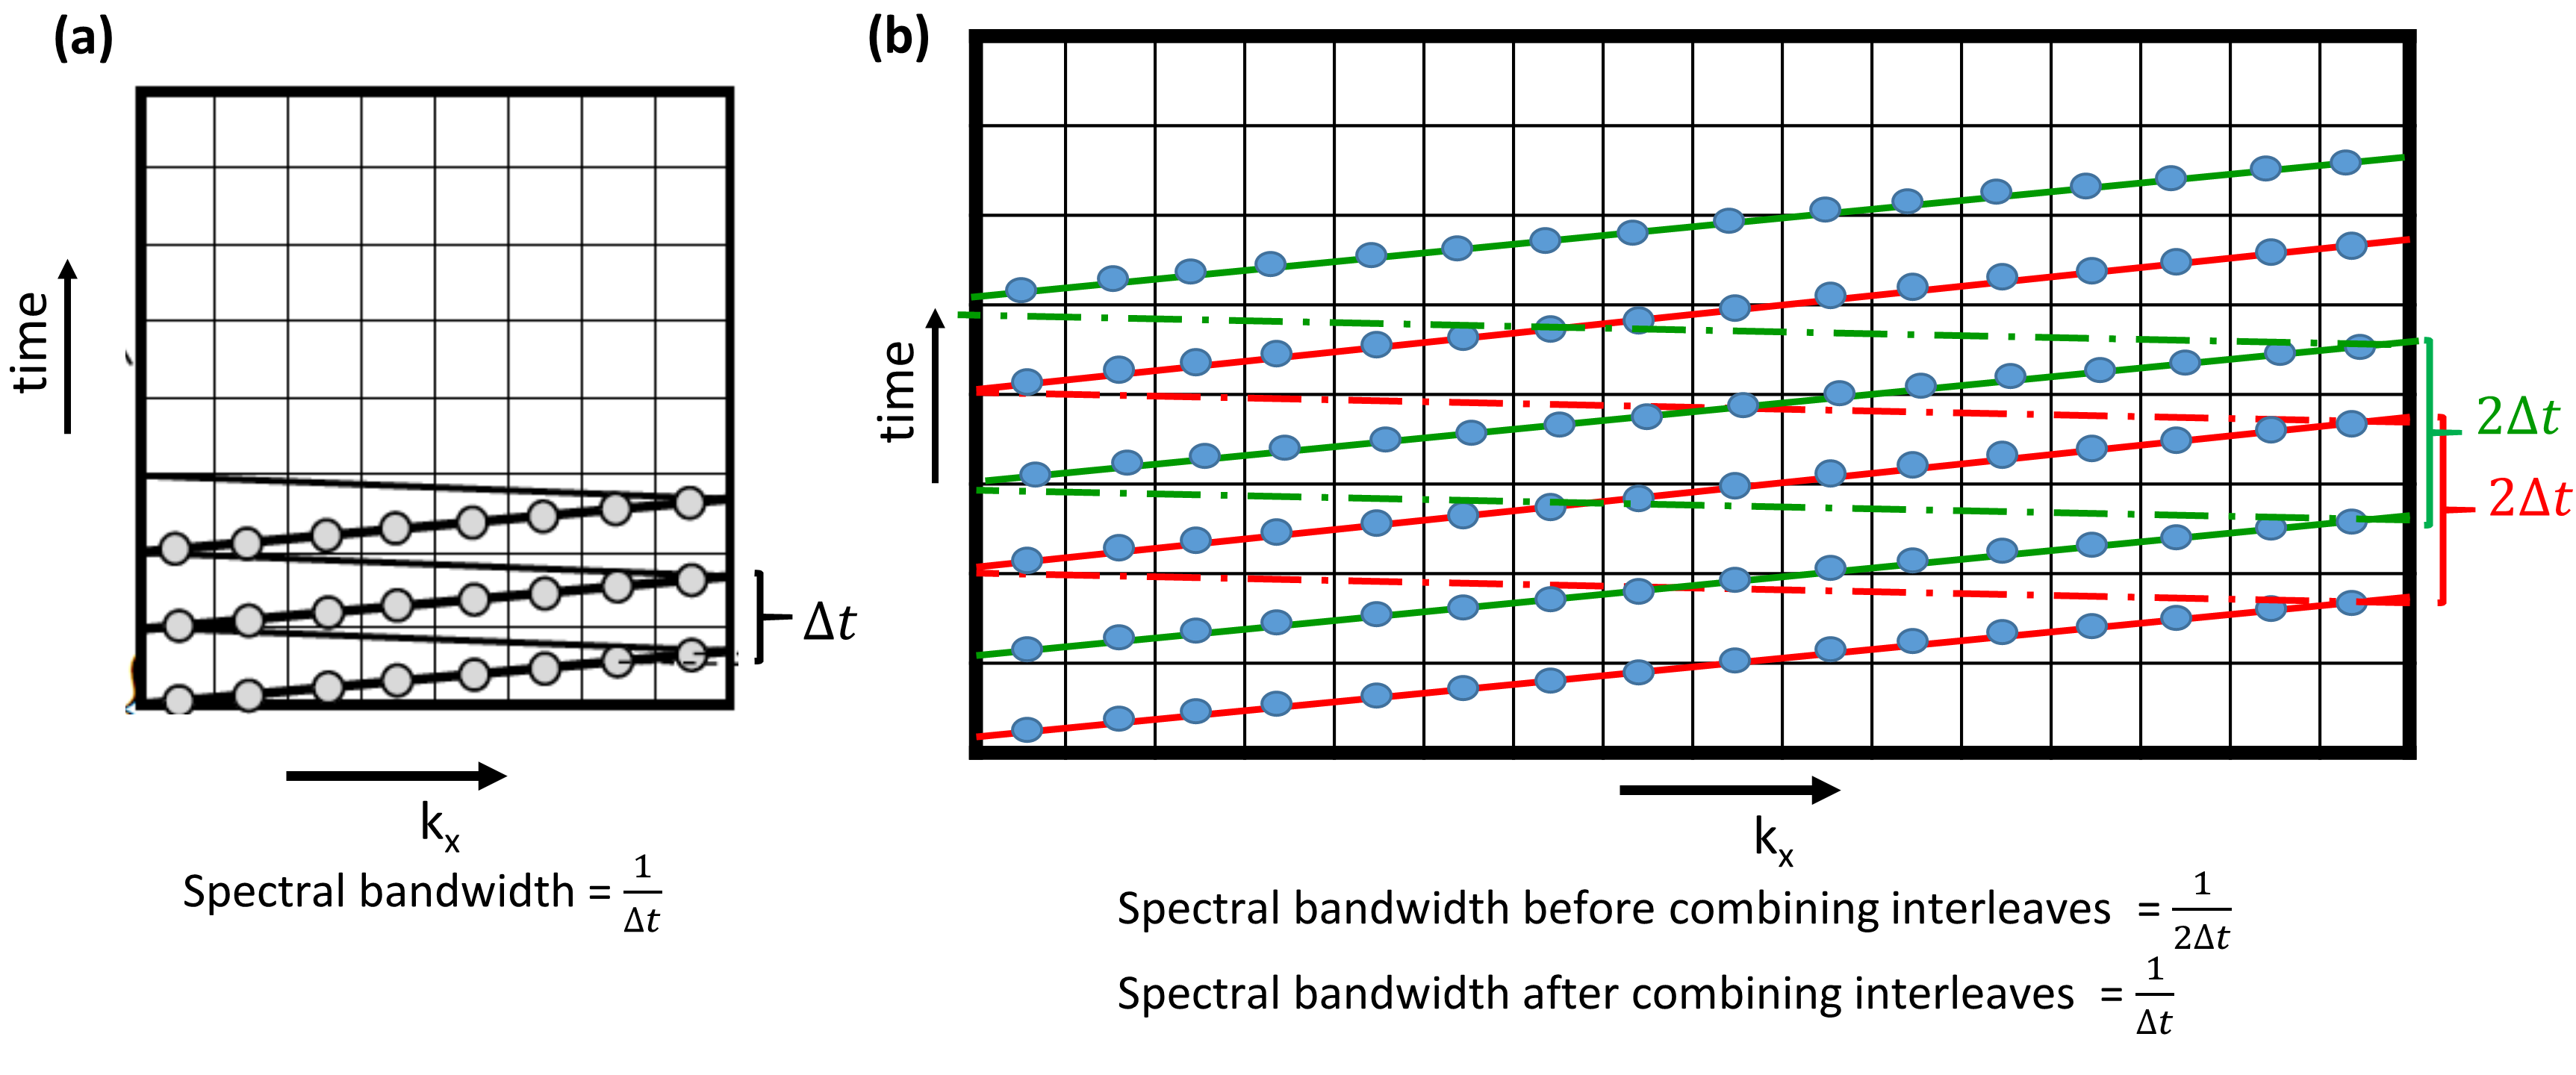
Fig 1: Spectral interleaving using flyback EPSI: (a) For each excitation kx-t space is traversed simultaneously during readout time. This example shows kx dimension = 8. (b) By doubling the spatial resolution i.e. kx = 16, each interleave takes twice the time which results in half spectral bandwidth. Thus two interleaves are used (red and green) as on combining spectral bandwidth is preserved.
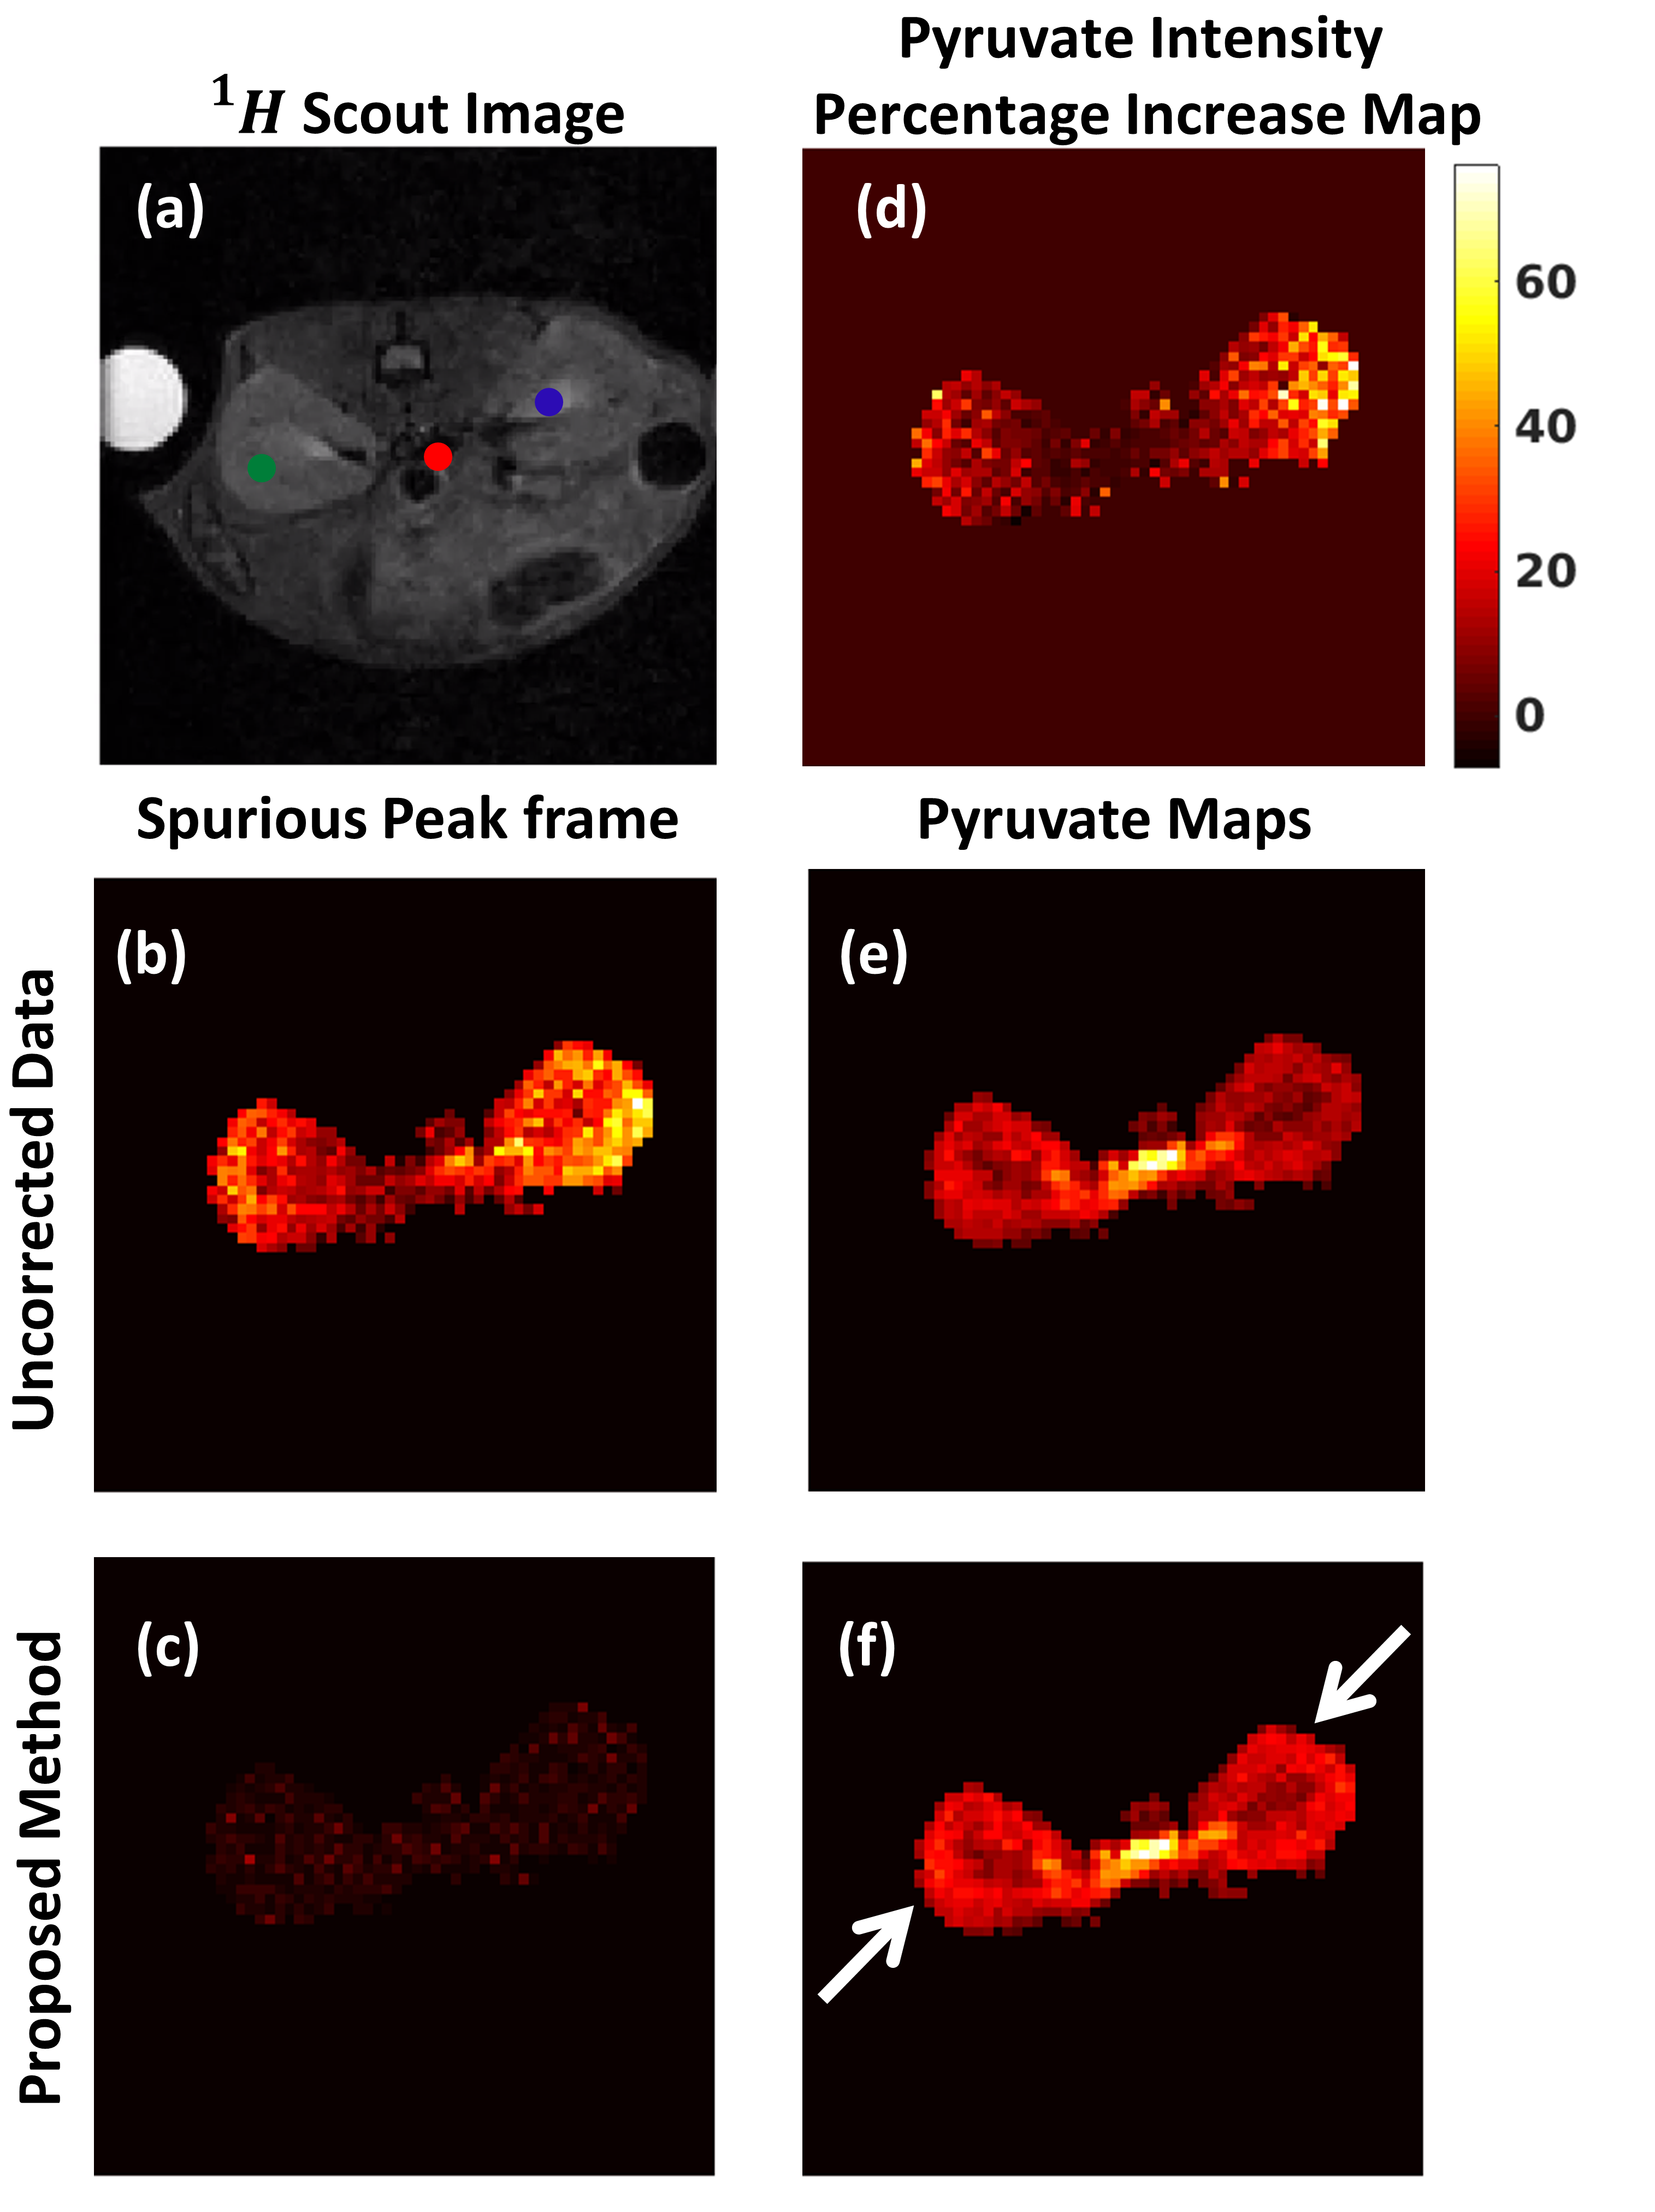
Fig. 2: Metabolite maps for 13C Hyperpolarized MRSI experiments: (a) Reference image of mouse kidney with reference pixels marked in three regions. (b) & (c) Spurious peak (of pyruvate) frame for the uncorrected and reconstructed data respectively. After reconstruction reduced intensity implies removal of spurious peaks. (e) & (f) Pyruvate maps for uncorrected and reconstructed data respectively. The arrows show regions with increased signal intensity due to reconstruction. (d) Map showing percentage increase of signal intensity provided by proposed method compared to uncorrected data. Pixels showupto 70% increase.