0156
Visceral stimulation triggers high-frequency BOLD responses in the rat brain1Biomedical Engineering, Purdue University, West Lafayette, IN, United States, 2Electrical and Computer Engineering, Purdue University, West Lafayette, IN, United States, 3Psychological Science, Purdue University, West Lafayette, IN, United States
Synopsis
Blood oxygen level dependent (BOLD) fMRI reports brain activity by measuring the vascular response to neural activity mediated through neurovascular coupling. Theoretical modeling of neurovascular coupling suggests its effect as a low-pass filter that cuts off at <0.2Hz. However, recent evidence suggests that BOLD fluctuations may also contain high frequency components. From a different perspective to address the origin of high-frequency BOLD signals in the rat brain, we examined the BOLD and local field potential (LFP) responses to visceral stimulation (electrical stimulation of the stomach or the vagus nerve), in comparison with the corresponding responses to commonly used sensory stimulation, such as forepaw stimulation. We report herein that visceral (forestomach and vagal nerve) stimulation can induce high-frequency (up to 0.8Hz) BOLD responses. The neuronal origins of such responses are different from those underlying the responses to forepaw stimulation, and likely modulate hemodynamic fluctuations through a more rapid mechanism of vascular control.
Purpose
Blood oxygen level dependent (BOLD) fMRI reports brain activity by measuring the vascular response to neural activity mediated through neurovascular coupling. Theoretical modeling of neurovascular coupling suggests its effect as a low-pass filter that cuts off at <0.2Hz. Therefore, the BOLD signal is widely assumed to be too slow to follow any faster fluctuation in neural activity. In contrast, a recent study has shown that high-field fMRI may detect fast but small BOLD signals capable of following neural responses to visual stimuli oscillating at up to 0.75Hz [1]. However, such findings have rarely been observed or replicated, despite numerous studies with similar sensory-stimulation paradigms. From a different perspective to address the origin of high-frequency BOLD signals in the rat brain, we examined the BOLD and local field potential (LFP) responses to visceral stimulation (electrical stimulation of the stomach or the vagus nerve), in comparison with the corresponding responses to sensory (forepaw) stimulation. We asked whether the BOLD signal could follow neural activity given visceral versus forepaw stimuli that were modulated at relatively higher frequencies ranging from 0.05 to 0.8Hz.Method
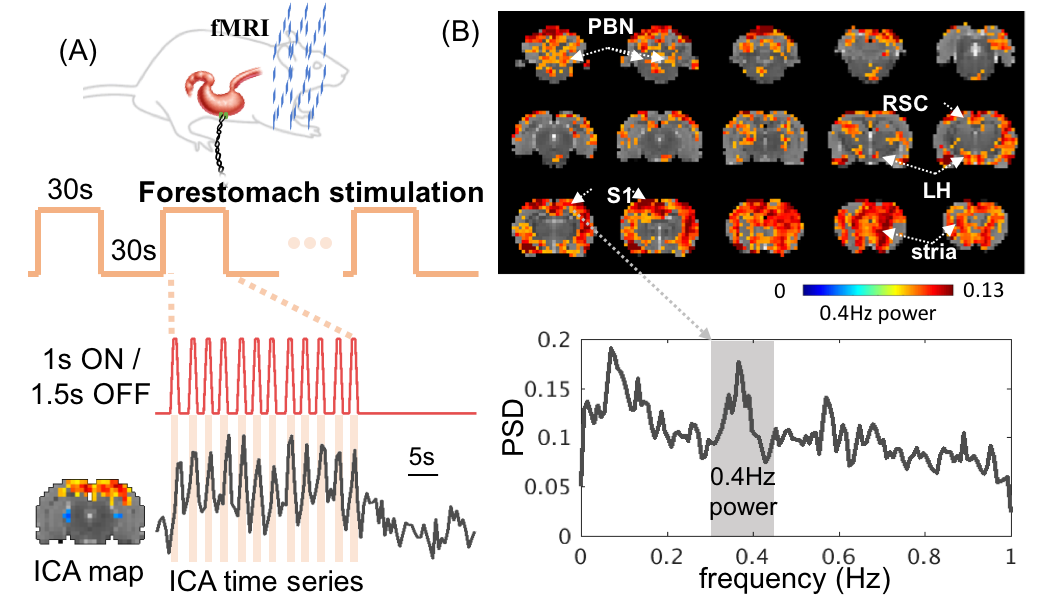
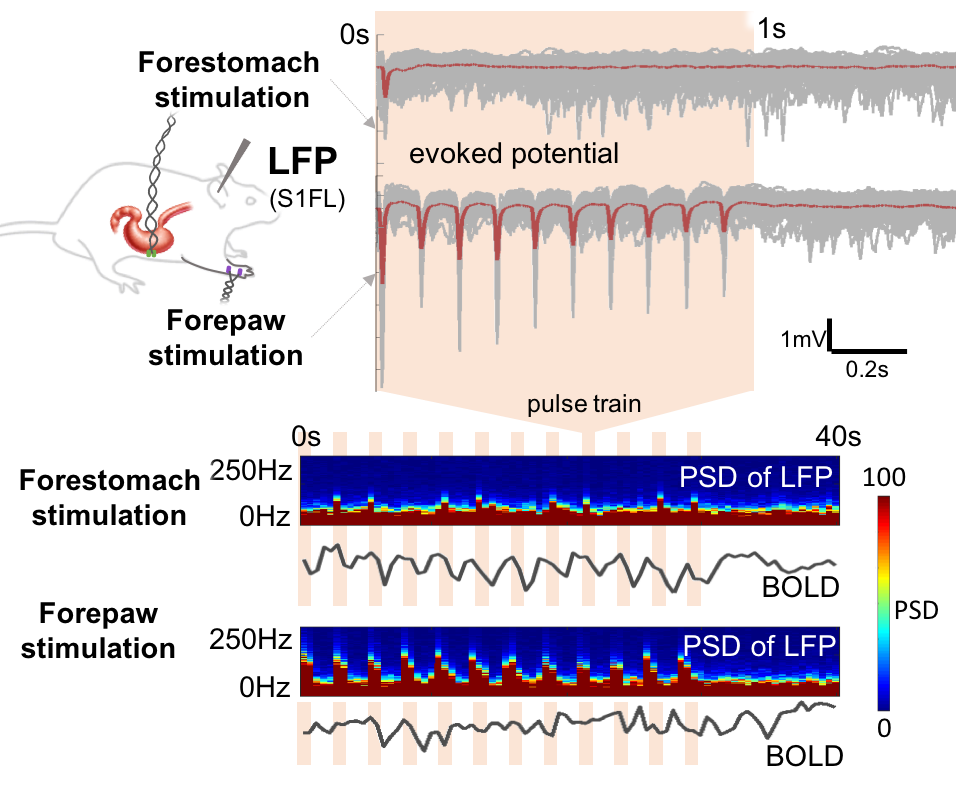
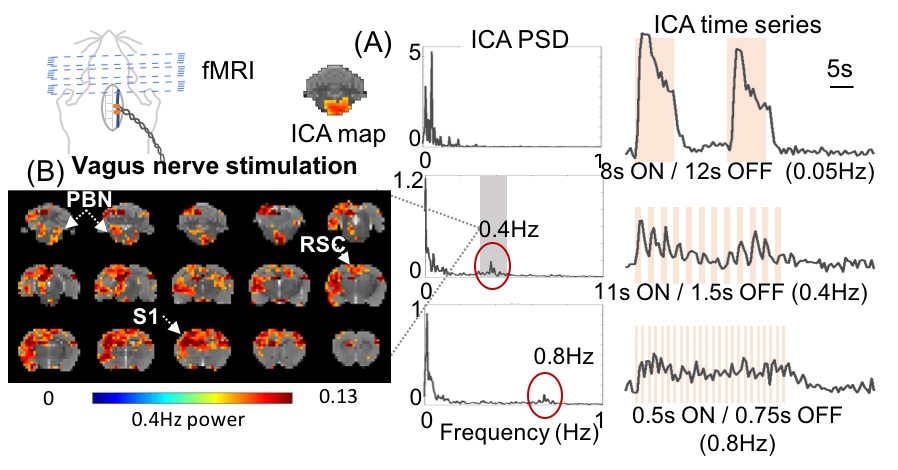
Six animals were recorded with fMRI or LFP while receiving electrical stimulation at the forestomach (n=5), the vagus nerve (n=1), and/or the forepaw (n=1). Animals were surgically implanted a patch or cuff electrode for forestomach stimulation or vagus nerve stimulation (VNS). FMRI data were acquired with a 2-D single-shot gradient-echo echo-planar imaging sequence (EPI, 0.5s repetition time, 15ms echo time, 41.8° flip angle, 0.6×0.6×1 mm3 voxel size) in a 7-tesla small-animal MRI system (BioSpec 70/30, Bruker), while the animals were anesthetized with continuous dexmedetomidine (SC-infusion, 0.015 mg/Kg/h) and isoflurane (0.1-0.5% mixed in O2). During fMRI, electrical current stimulation was delivered to various targets with a 30s (or 40s) ON/OFF block-design paradigm; in each ON block, a pulse train was delivered periodically to effectively modulate the stimuli at 0.05, 0.2, 0.4, or 0.8Hz. Separately from MRI, LFP was recorded from the right forelimb region of the primary somatosensory cortexregion (S1FL) of one animal with a 32-channel electrode (NeuroNexus) connected to a broadband amplifier (Tucker-Davis Technologies) with a 25kHz sampling rate. After the standard preprocessing, the fMRI data were analyzed with spatially independent component analysis (ICA) to denoise the data and yield functional networks. This allowed us to examine the fMRI responses to visceral or somatosensory stimuli in the levels of voxels, regions, and networks. After skipping the transient stimulation artifacts, the LFP data were analyzed to obtain the spectrogram that expressed the signal power as a function of time (0.5s increments) and frequency (1.49Hz increments).Results
When the forestomach was stimulated with bursts of current-pulse stimuli that repeated in 1s-ON-1.5s-OFF cycles, we observed 0.4Hz BOLD fluctuations phase-locked to every burst of pulses at the retrosplenial cortex (Fig. 1A), as well as the parabranchial nucleus, hypothalamus, somatosensory cortex, and striatum (Fig. 1B). Surprisingly, such high-frequency BOLD responses at S1FL (the major cortical region corresponding to the forepaw stimulation) were more observable with forestomach stimulation than with forepaw stimulation when both were modulated at 0.4Hz (Fig. 2). Accompanying this difference in the BOLD response, the LFP response at S1FL was observed for every pulse in a train of forepaw stimuli, but only for the first pulse in a train of forestomach stimuli. In addition to the forestomach stimulation, high-frequency (up to 0.8Hz) BOLD responses were also observed during VNS in the ventral brainstem, as well as the parabranchial nucleus, retrosplenial cortex and somatosensory cortex (Fig. 3).Conclusion
Here we report, for the first time, that visceral (forestomach and vagal nerve) stimulation can induce high-frequency (up to 0.8Hz) BOLD responses. The neuronal origins of such responses are different from those underlying the responses to somatosensory stimulation, and likely modulate hemodynamic fluctuations through a more rapid mechanism of vascular control.Acknowledgements
This study was funded by National Institutes of Health’s SPARC - Stimulating Peripheral Activity to Relieve Conditions - program (OT2OD023847).References
[1] Laura D. Lewis, et al., “Fast fMRI can detect oscillatory neural activity in humans.” PNAS 113(43), E6679–E6685, (2016).Figures