0154
Mesoscopic and microscopic imaging of sensory responses in the same animal1INSERM U1128, Laboratory of Neurophysiology and New Microscopy, Université Paris Descartes, Paris, France, 2INSERM U979 ‘Wave Physics for Medicine’ Lab, Paris, France, 3NeuroSpin, Bât 145, Commissariat à l'Energie Atomique-Saclay Center, Gif-sur-Yvette, France
Synopsis
We developed a chronic olfactory bulb preparation compatible with repetitive imaging of the same mice with BOLD-fMRI (17.2 T), functional ultrasound imaging (fUS) and two-photon laser scanning microscopy. BOLD-fMRI and fUS mesoscopic signals are highly correlated with microscopic vascular and dendritic neuronal signals in response to odour concentrations. Furthermore, minimal odour stimulation reveals that there is no threshold of neuronal activation below which functional hyperemia is not triggered, warranting measurement of blood flow dynamics to detect the lowest levels of brain activation. These data establish the strengths and limits of mesoscopic imaging techniques to report neural activity.
Introduction
The
BOLD fMRI signal reports changes in the vascular concentration of
deoxyhemoglobin and as such only indirectly reports neural activity. A major
challenge is to quantitatively link this mesoscopic BOLD signal to the initial
neuronal signal that triggers it. The first precise quantification of the
relationship between neural activation and BOLD-fMRI1 revealed that
in the cortex, the BOLD signal correlated better with the local field potential
than with action potentials. For obvious technical reasons the identity of
activated cells could not be resolved. A more recent study used an optic fiber
in the magnet to simultaneously record bulk Ca2+ responses and BOLD-fMRI signals2, revealing
a correlation between glial cell calcium signals and delayed BOLD-fMRI
signals. However, this approach2,3
is not compatible with optical devices that have cellular resolution (i.e. with
micro-objectives), as they generate magnetic susceptibility artifacts that mask
the BOLD-fMRI signal.Methods
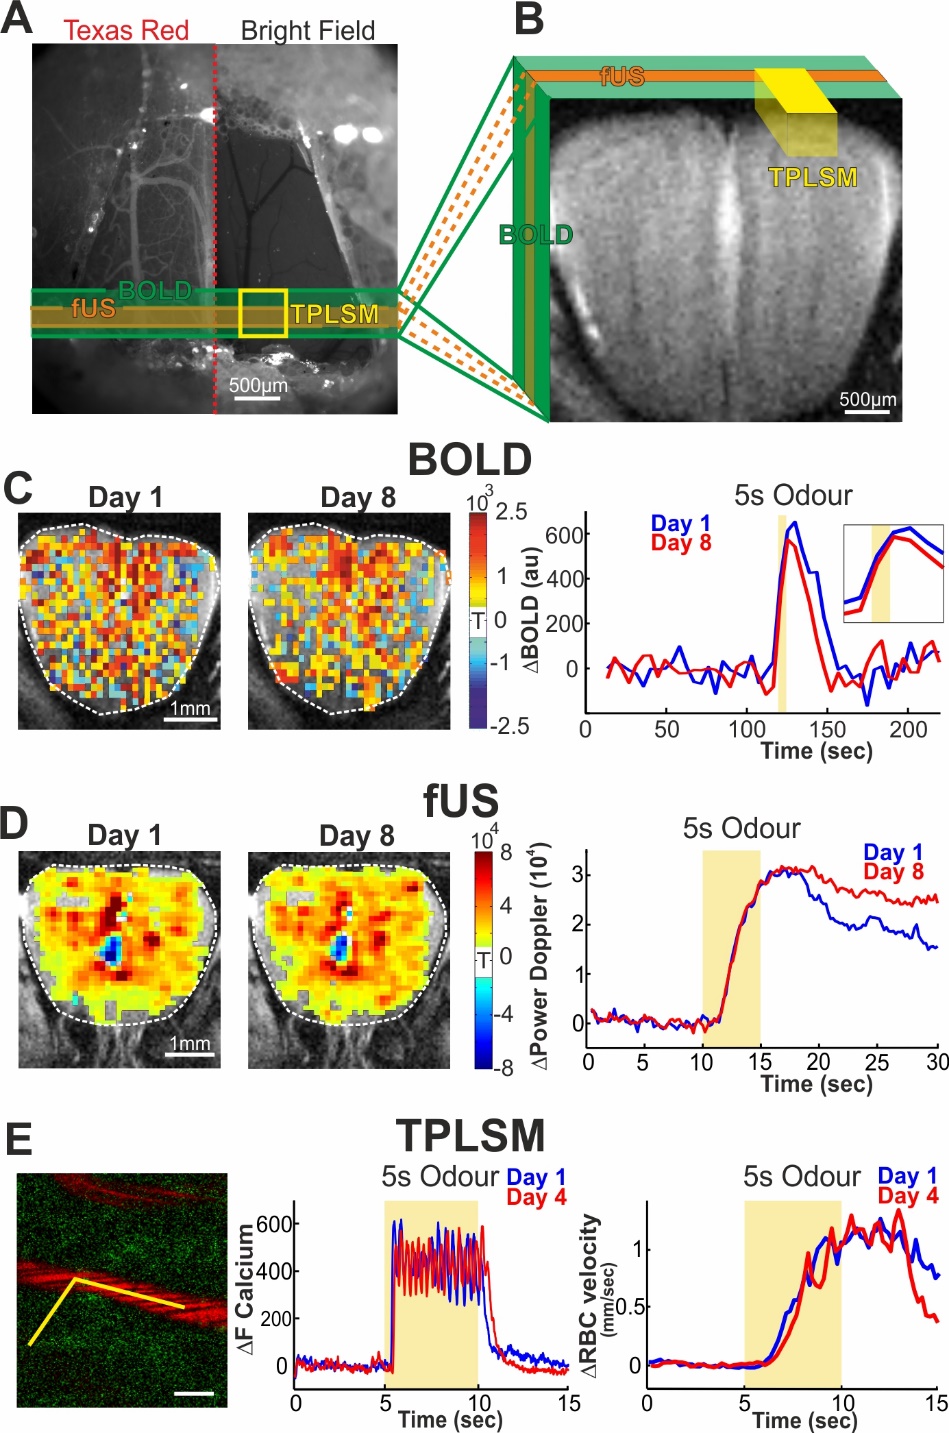
We developed a new chronic preparation with a specialized window transparent for imaging with all techniques (optically and acoustically transparent window for TPLSM and fUS, and devoid of magnetic susceptibility artefacts for BOLD-fMRI). Using this preparation we were able measure reproducible fUS, BOLD, and microscopic neuronal/vascular responses over several days and even weeks, therefore validating the comparison of different imaging techniques in the same mouse (see Fig.1). We then investigated functional hyperemia in the same animal combining state the three imaging techniques:
-17.2 Tesla BOLD fMRI
-fast Ultrasound Imaging (fUS) using a custom fast ultrasound transducer (100 x 100 x 200 µm).
- Two-photon microscopy imaging of neuronal activity and capillary blood flow changes at the site of synaptic activation.
Results
In animals expressing GCaMP6 in mitral cells of the olfactory bulb (OB), we investigated the extent to which functional hyperemia reports neuronal activation over the entire range of odor stimulation. We also quantitatively compared mesoscopic and microscopic vascular signals and obtained three main findings:
Mesoscopic fUS and BOLD fMRI signals are excellent reporters of microscopic functional hyperemia and neuronal calcium responses over several orders of magnitude of sensory stimulation.
There is no level of neuronal activation below which neurovascular coupling does not occur. This means that brain imaging based on blood flow is able to report even the smallest activation of neurons. The limitation only depends on the signal to noise of each imaging technique and not from the biological response.
Mesoscopic and microscopic vascular responses are linearly correlated to neural Ca2+
Discussion
This study was designed to investigate the correlation between the magnitudes of vascular responses measured by different techniques over a range of stimulation intensities and not to compare the spatially resolved mesoscopic activation maps of BOLD and fUS, or search for a possible mismatch between two techniques, or between neurovascular coupling and neuronal activation. However, the high SNR and time resolution of fUS will allow the generation of precise voxel based activation maps using the microscopic capillary blood flow response as a crosscorrelationConclusion
The present study correlates for the first time the sensory response of a specific cell type, the mitral cell, to both the microscopic and mesoscopic vascular response in the mouse central nervous system. The results demonstrate that both fUS and high-resolution BOLD-fMRI signals are excellent reporters of capillary functional hyperemia. They also demonstrate that in our experimental conditions, the smallest activation of neurons is accompanied by functional hyperemia, suggesting that improvement of the SNR of mesoscopic imaging techniques could allow monitoring of brain activation over its full range. In addition, they strongly support the hypothesis that BOLD fMRI resting state fluctuations report fluctuations of spontaneous neural activity4.Acknowledgements
No acknowledgement found.References
1. Logothetis NK, Pauls J, Augath et al. Neurophysiological investigation of the basis of the fMRI signal. Nature. 2001; 412 : 150-157.
2. Schulz K, Sydekum E, Krueppel R, et al. Simultaneous BOLD fMRI and fiber-optic calcium recording in rat neocortex . Nat Meth. 2012; 9 (6): 597-602.
3 Schmid F,Wachsmuth L, Schwalm M, et al. Assessing sensory versus optogenetic network activation by combining (o)fMRI with optical Ca2+ recordings. JCBFM. 2016; 36(11), 1885-1900.
4 Mitra A and Raichle ME. How networks communicate: propagation patterns in spontaneous brain activity. Philos. Trans. R. Soc. B Biol. Sci. 2016; 371, 20150546.
Figures