0149
Global responses to microstimulation at 7T and comparison with vibrotactile stimulation1Sir Peter Mansfield Imaging Centre, School of Physics and Astronomy, University of Nottingham, Nottingham, United Kingdom, 2Department of Physiology, University of Gothenburg, Gothenburg, Sweden
Synopsis
Single unit intra-neural microstimulation (INMS) allows the precise delivery of low-current electrical pulses into human peripheral nerves to stimulate individual afferent nerve fibres. We compare the global pattern of positive and negative BOLD response to INMS with that of perceptually matched vibrotactile stimulation of the skin. INMS and vibrotactile stimulation result in a similar pattern of positive BOLD response, but distinct differences in negative BOLD signals. INMS results in strong negative BOLD response of the DMN, whilst vibrotactile stimulation results in strong ipsilateral negative BOLD response likely to represent active inhibition which is not seen for INMS.
PURPOSE
Intra-neural microstimulation (INMS) is a technique that allows the precise delivery of low-current electrical pulses into human peripheral nerves. Single unit INMS can be used to stimulate individual afferent nerve fibres during microneurography. Combining INMS with neuroimaging1,2 allows the unique monitoring of central nervous system activation in response to unitary, controlled tactile input, with functional magnetic resonance imaging (fMRI) providing high spatial localisation and sensitivity to brain activity. Here, we report the application of INMS at ultra-high field (7T), and compare the global pattern of positive and negative BOLD response to INMS with that of perceptually matched vibrotactile stimulation of the skin.METHODS
Five subjects each participated in an ~4 hours scan session involving characterization of a single tactile unit; assessment of the effect of microstimulating the unit to ensure the location of the electrically-elicited sensation matched the location where mechanical stimulation of the skin generated a response; and concurrent INMS and fMRI2. INMS was performed using a INMS system specifically designed to provide compatibility with ultra-high field (7T)3. A tungsten needle microelectrode was percutaneously inserted into the median nerve to stimulate and record from single afferent units. Each single unit was stimulated with short bursts of 60Hz electrical pulses. INMS stimulation was then repeated at 30 and 90Hz, with matched perceived amplitude for each frequency. In addition, fMRI data was collected using mechanical vibration applied to each of the unit’s receptive field at matched perceptual threshold to the INMS. fMRI paradigm: fMRI data was collected on a 7T Philips Achieva using a GE-EPI acquisition (Multiband factor 2, 1.25mm isotropic resolution, 40 axial slices, TE=25ms, TR=2s). The INMS protocol comprised a burst of 30, 60, or 90Hz 200μs current pulses of 1s (0.5s on and 0.5s off) repeated 8 times, followed by a rest period of 23 s. This was repeated for a total of 8 cycles. Vibrotactile stimulation was applied at 60Hz to each unit’s receptive field using an identical paradigm to the INMS at the same perceived intensity to INMS. High resolution structural data were also acquired. Data Analysis: fMRI data were analyzed using Freesurfer and FSL. No spatial smoothing was applied, a GLM analysis was performed in FSL to generate both positive and negative BOLD statistical parametric maps (SPMs) (Z>2.3, p<0.05 uncorrected). A fixed effects group analysis was performed of all units stimulated at 60Hz, and group SPM formed of the response to 60Hz vibration applied the same units’ receptive fields. ROI analysis was performed to assess the beta values in primary and secondary somatosensory areas (SI and SII), and the default mode network (DMN).RESULTS
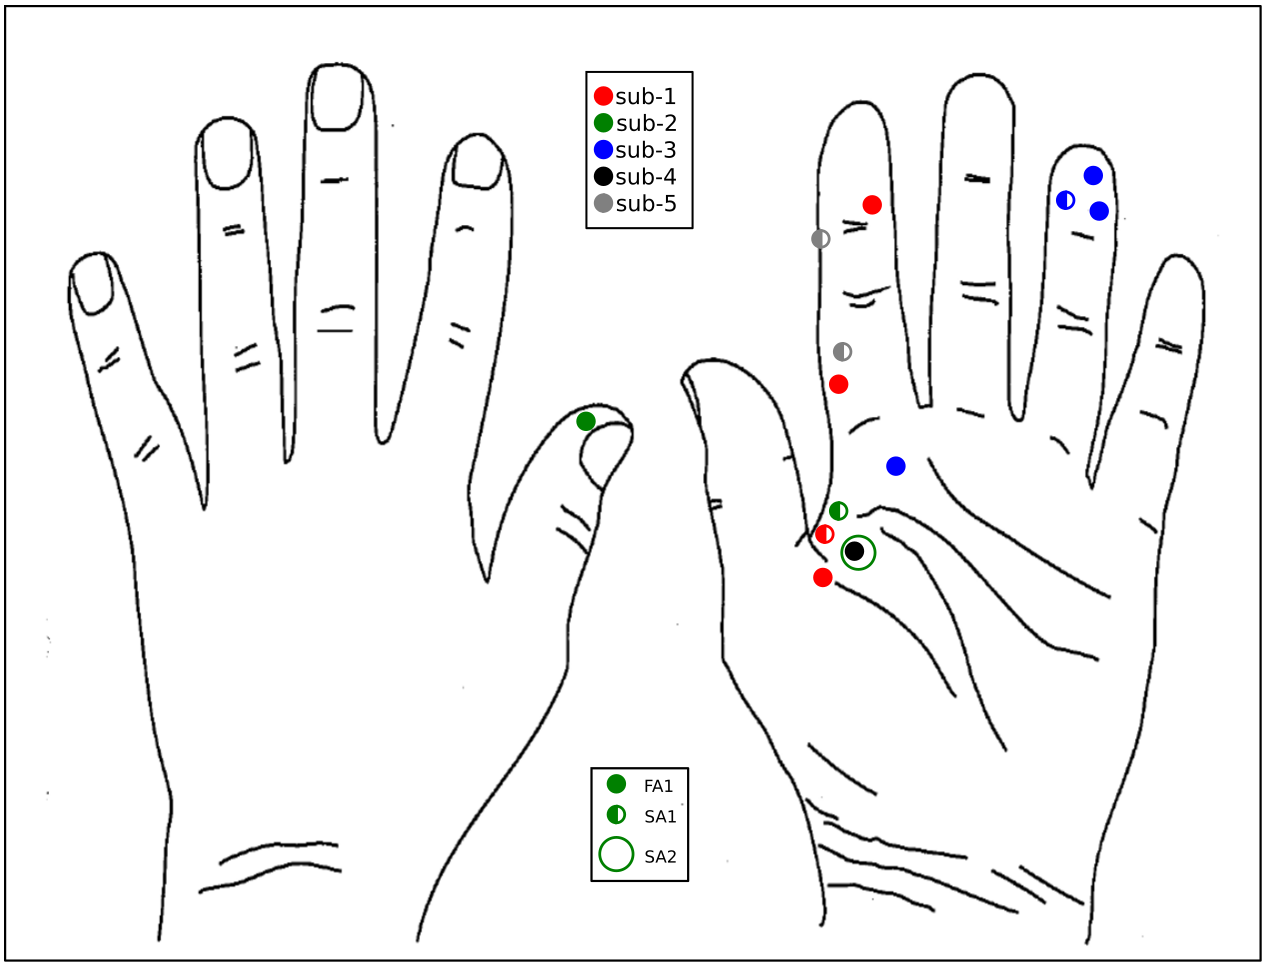
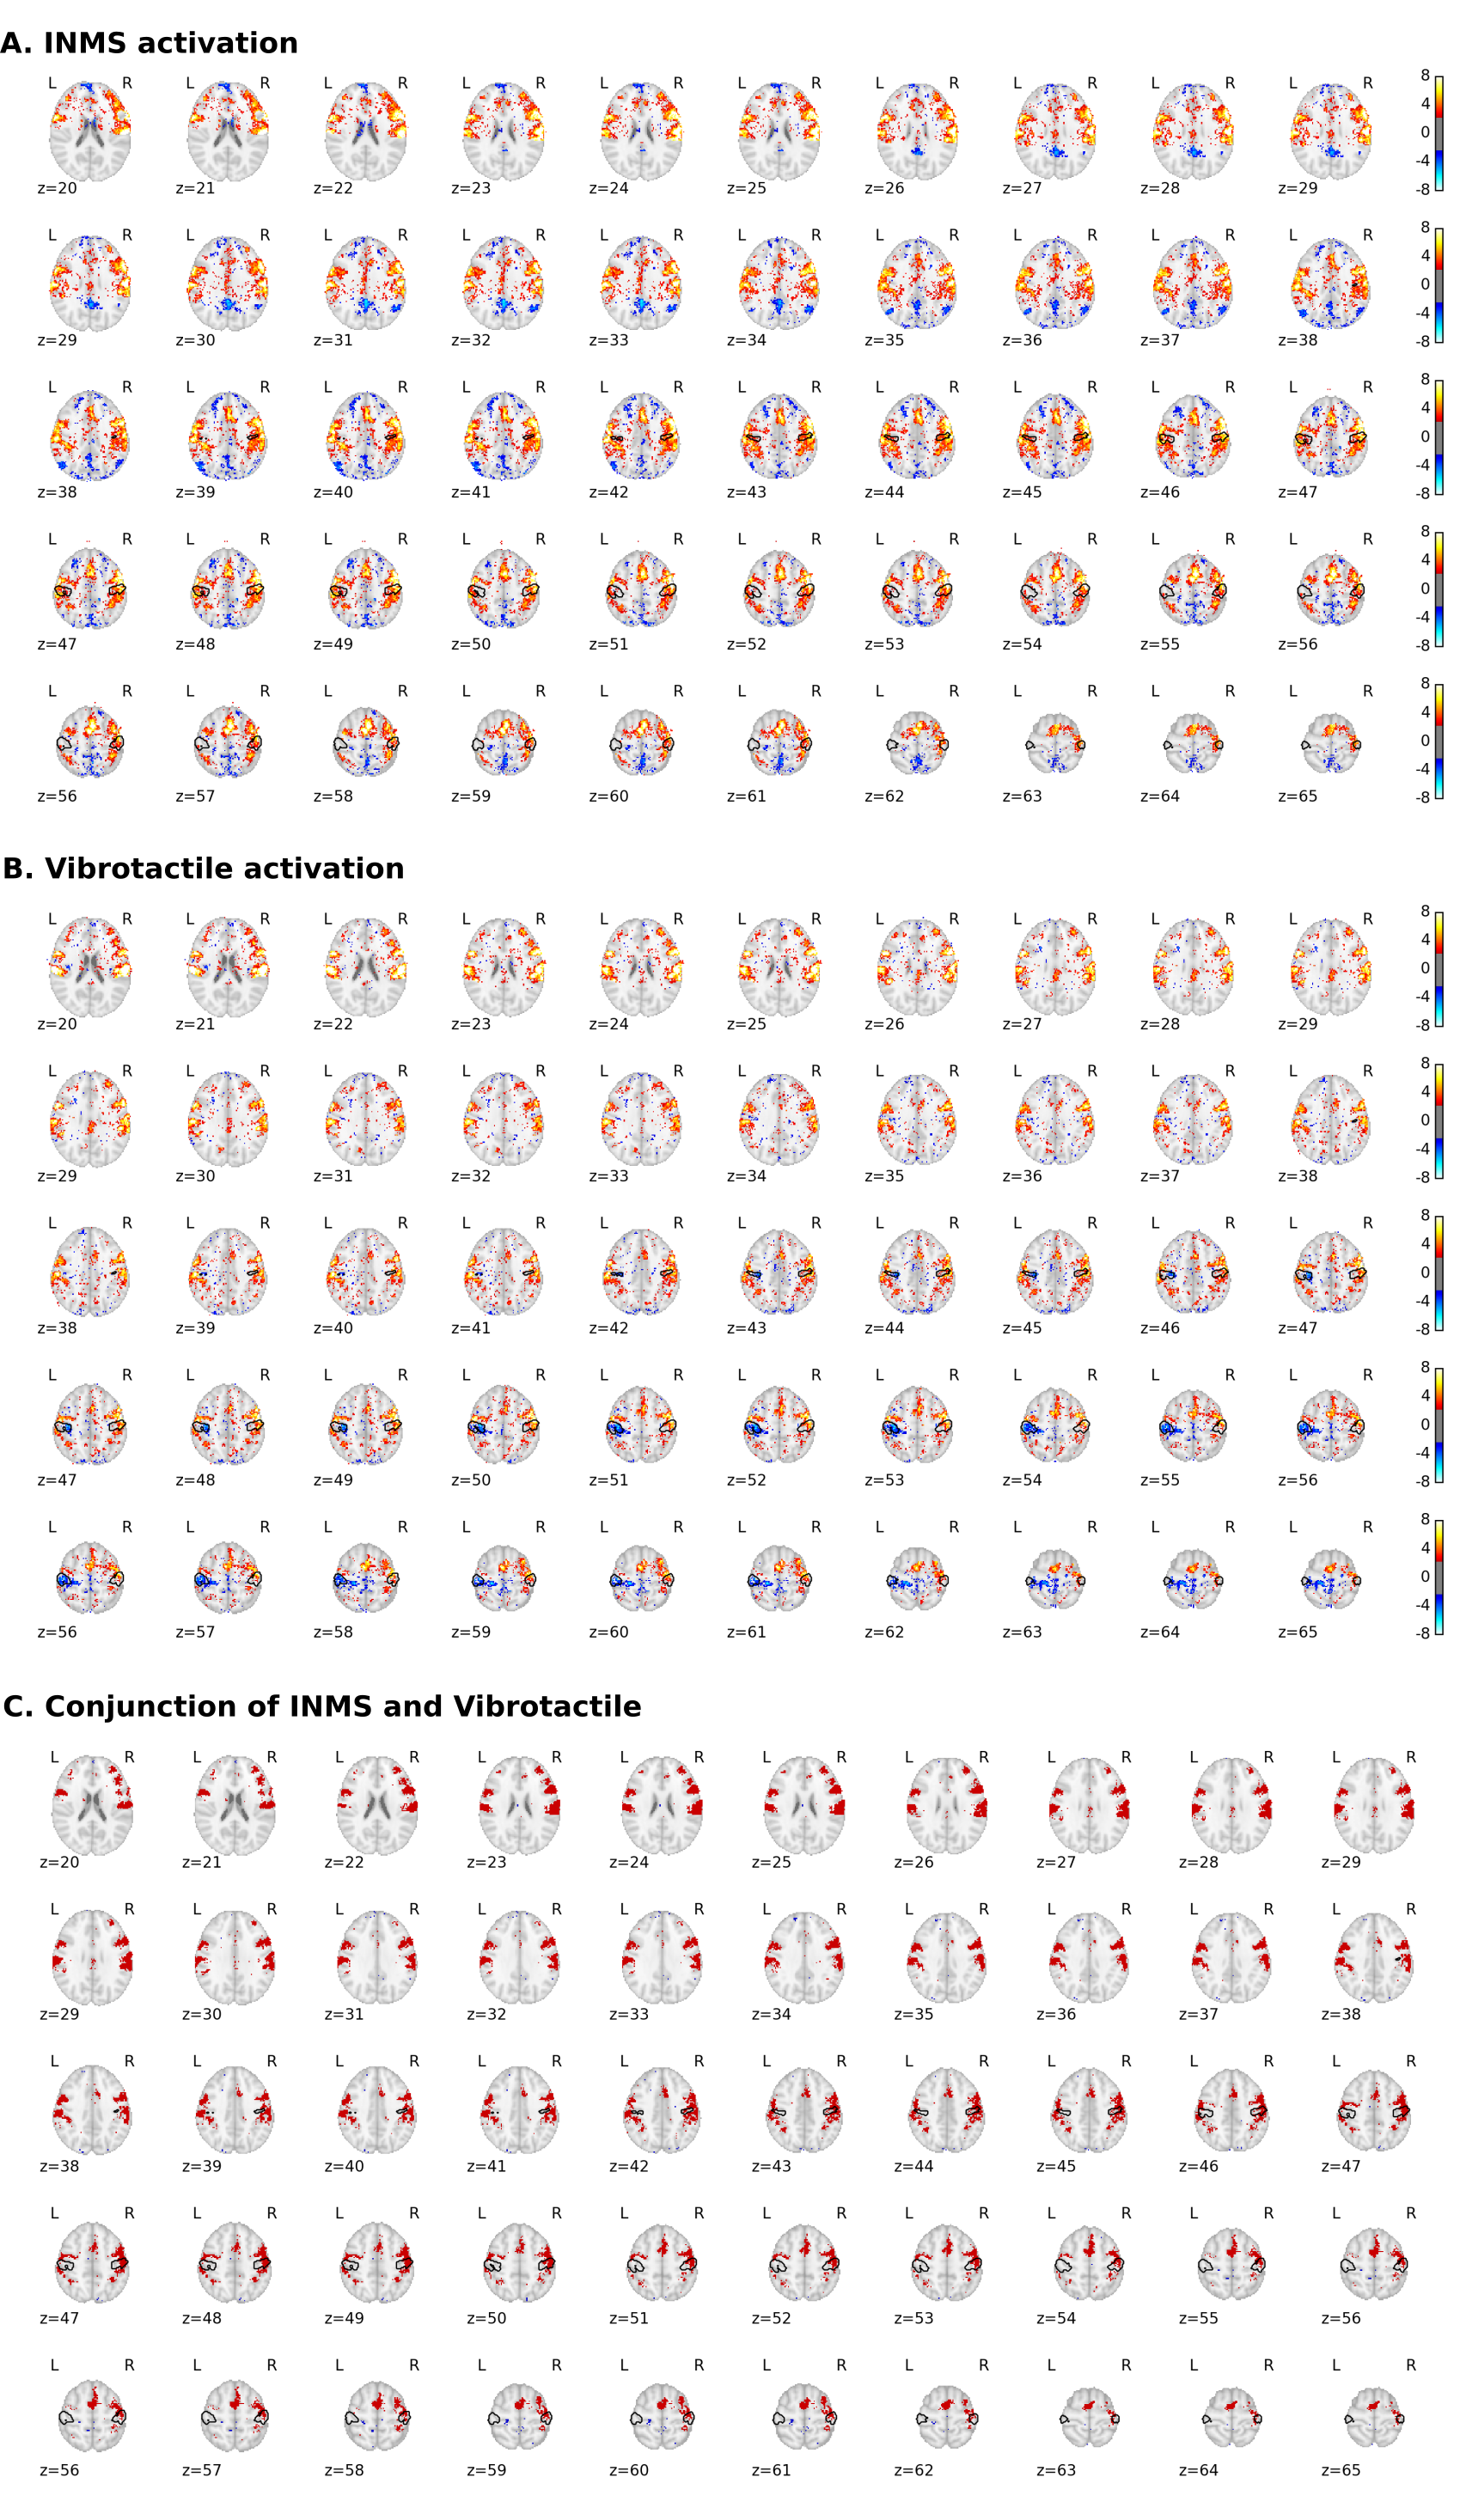
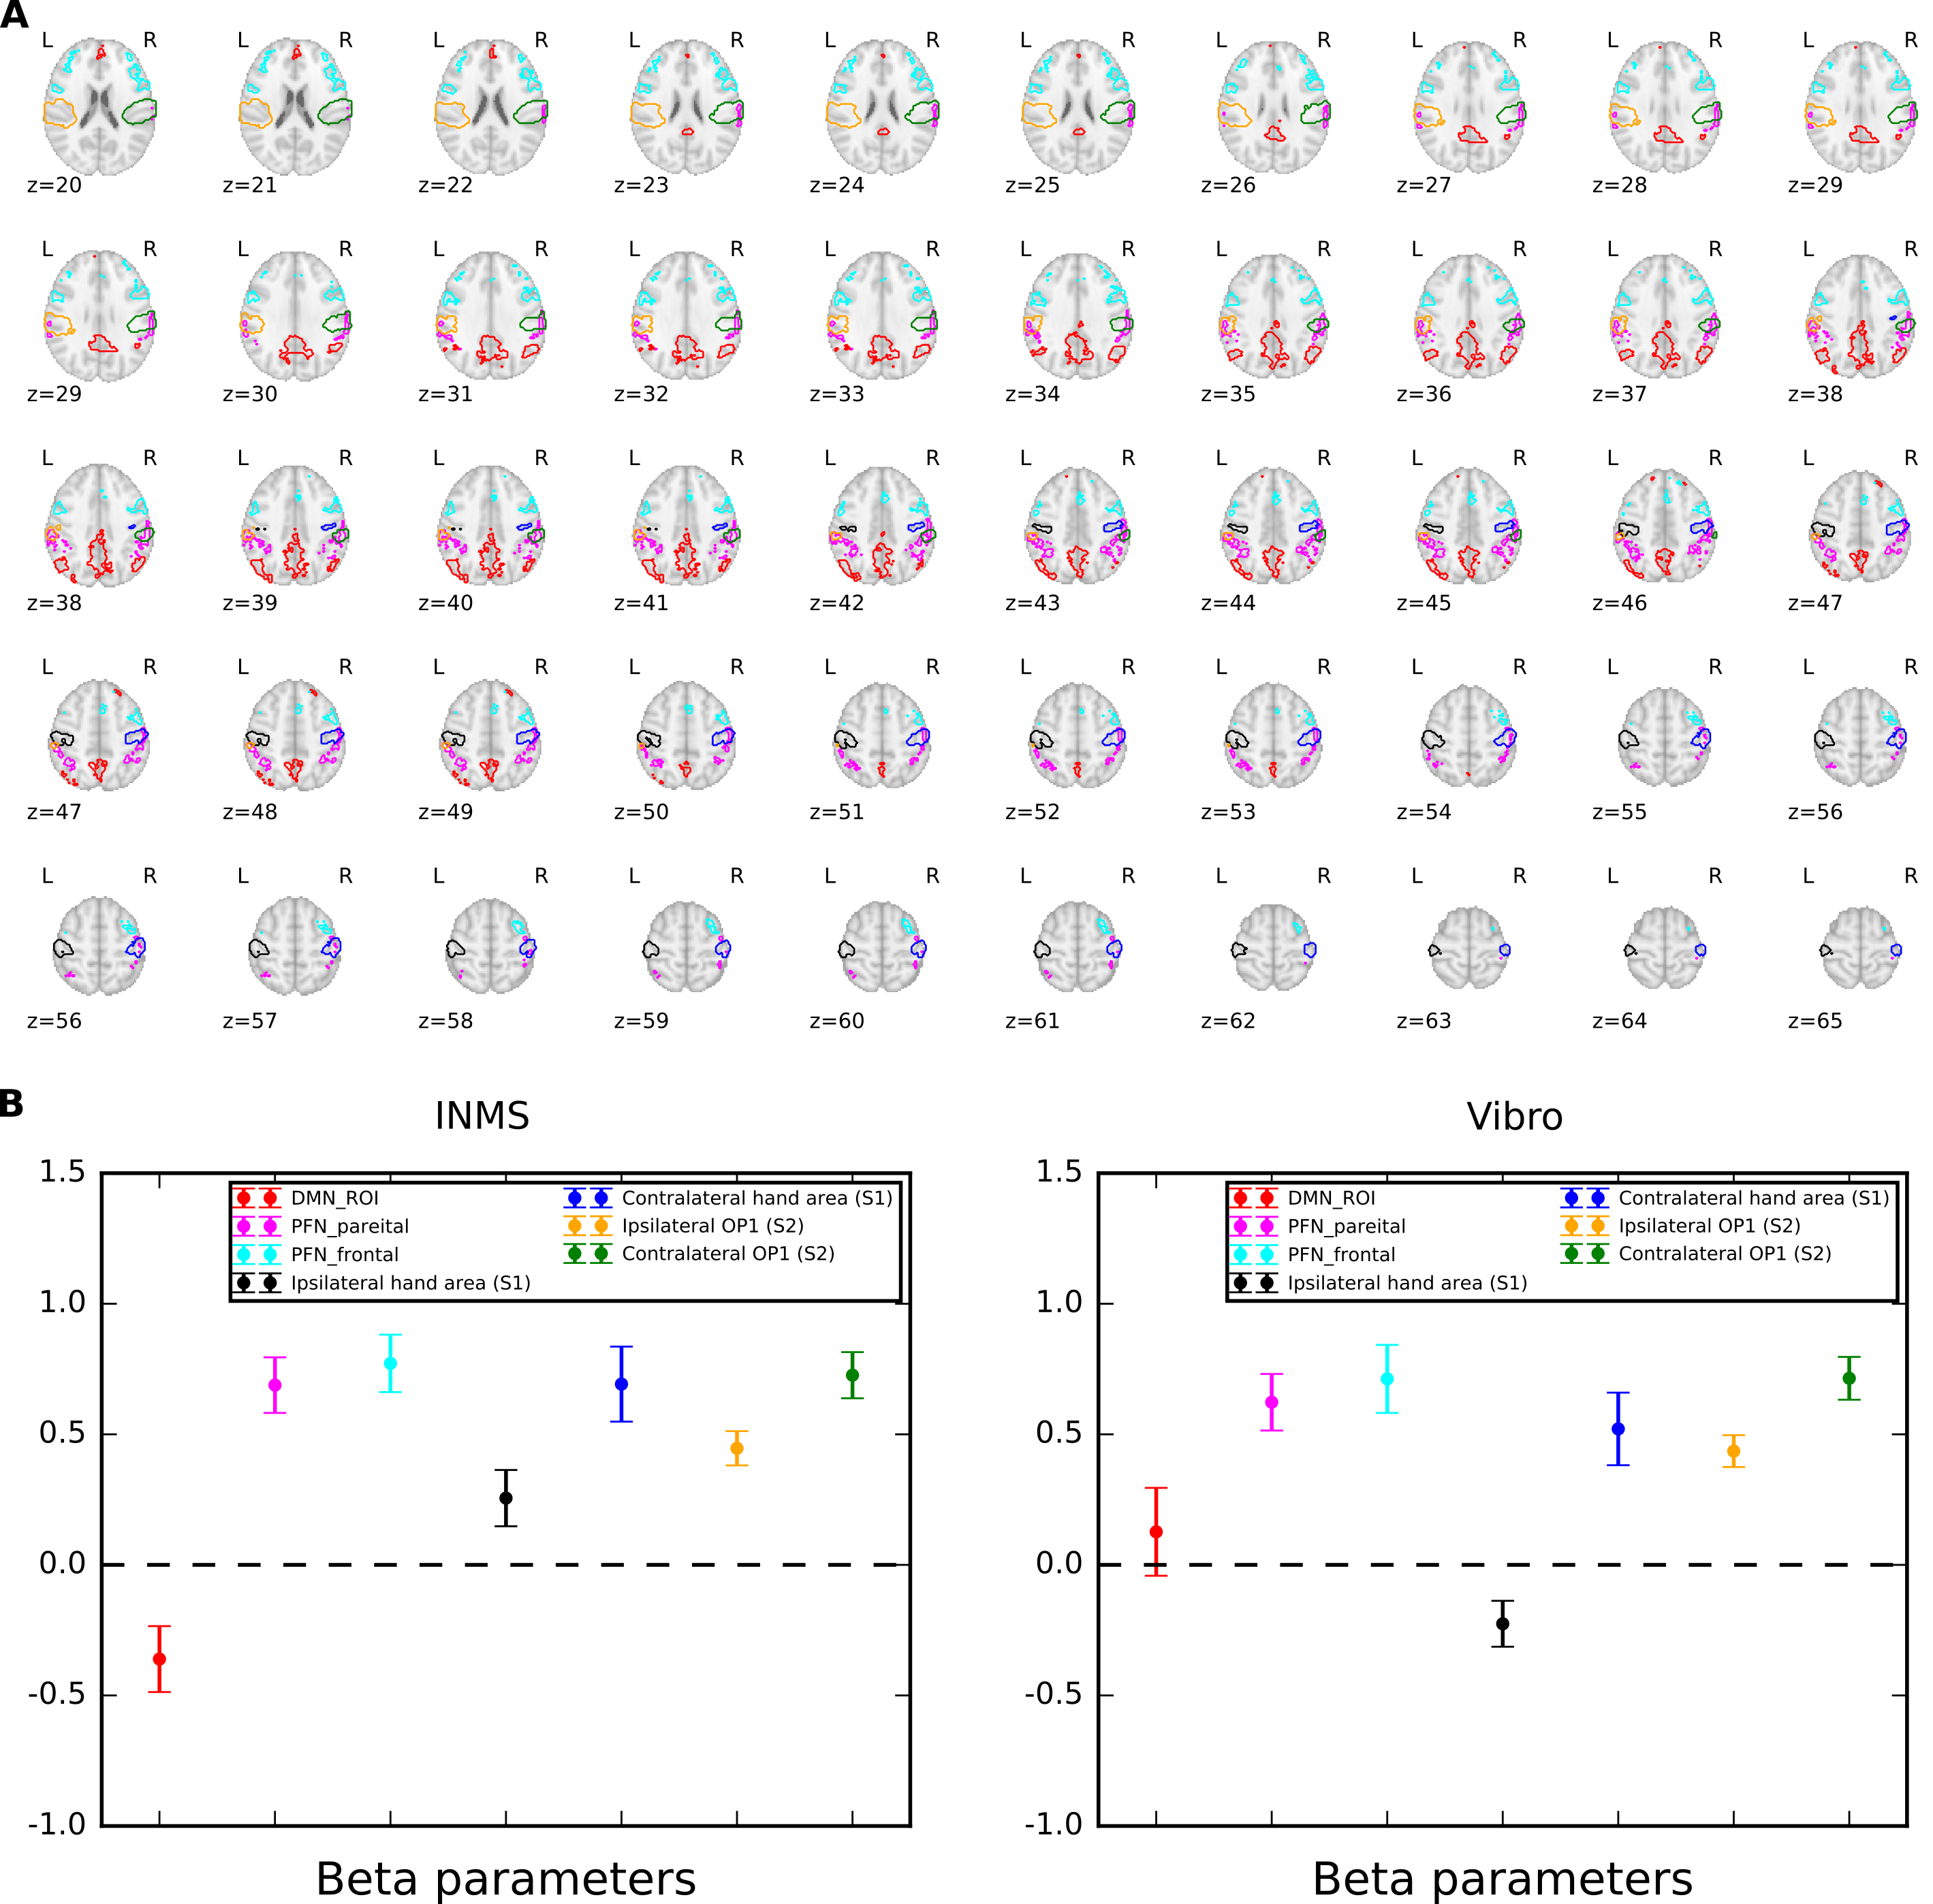
fMRI data were collected on 14 units (8 fast-adapting type 1 (FA1); 5 slowly-adapting type 1 (SA1) and 1 type 2 (SA2) units). Figure 1 shows the location and type of each of these units. The group SPM to 60 Hz INMS of the SA1 and FA1 units resulted in a positive BOLD responses in a number of sensory-related brain areas; - SI, SII, premotor cortex (supplementary motor area (SMA), and dorsal premotor cortex (PMC)), primary motor cortex (MI), insula cortex (anterior (AIC) and posterior (PIC) parts), prefrontal cortex (PFC) and posterior parietal cortex (PPC), and a strong negative BOLD response in the DMN (Fig.2A). Vibrotactile stimulation generated a similar pattern of positive BOLD response (Fig.2B and C), and in addition a strong negative BOLD response in ipsilateral S1 but no DMN response (Fig.2B). Figure 3 plots the mean beta values across units/vibration sites highlighting this difference in negative BOLD response between INMS and vibrotactile stimulation.DISCUSSION
We used an MRI compatible INMS system to assess fMRI responses during INMS at 7T. Maps showed INMS and vibrotactile stimulation generate a similar pattern of positive BOLD response, but altered negative BOLD patterns. Vibrotactile stimulation led to strong ipsilateral negative BOLD response not seen for INMS. The negative BOLD response to vibrotactile stimulation has been widely reported previously and has been suggested to represent active inhibition of the ipsilateral cortex4 mediated by transcallosal mechanisms. In contrast, INMS generated strong negative BOLD response in the DMN, not seen in response to vibrotactile stimulation. The DMN has commonly been shown to exhibit task-induced reductions in BOLD signal (DMN deactivations) concurrently with increased response to task5. To assess whether DMN deactivations were associated with increased attentional demands or cognitive engagement ROIs in the fronto-parietal network (FPN)5 were assessed, but no significant difference between INMS and vibrotactile stimulation was found.Acknowledgements
This work was funded by MRC grant MR/M022722/1References
1. Trulsson M, Francis ST, Kelly EF, Westling G, Bowtell R, McGlone F. Cortical responses to single mechanoreceptive afferent microstimulation revealed with fMRI. Neuroimage. 2001 Apr;13(4):613-22.
2. Sanchez Panchuelo RM, Ackerley R, Glover PM, Bowtell RW, Wessberg J, Francis ST, McGlone F. Mapping quantal touch using 7 Tesla functional magnetic resonance imaging and single-unit intraneural microstimulation. Elife. 2016 May 7;5.
3. Glover PM, Watkins RH, O'Neill GC, Ackerley R, Sanchez-Panchuelo R, McGlone F, Brookes MJ, Wessberg J, Francis ST. An intra-neural microstimulation system for ultra-high field magnetic resonance imaging and magnetoencephalography. J Neurosci Methods. 2017 Oct 1;290:69-78.
4. K.J. Mullinger,1, S.D. Mayhew, A.P. Bagshaw, R. Bowtell, S.T. Francis, Evidence that the negative BOLD response is neuronal in origin: A simultaneous EEG–BOLD–CBF study in humans. NeuroImage 94 (2014) 263–274.
5. Hutchinson M, Schiffer W, Joseffer S, Liu A, Schlosser R, Dikshit S, Goldberg E, Brodie JD. Task-specific deactivation patterns in functional magnetic resonance imaging. Magn Reson Imaging. 1999 Dec;17(10):1427-36.
6. K.J. Pallesen, E. Brattico, C.J. Bailey, A. Korvenoja, A. Gjedde Cognitive and emotional modulation of brain default operation J. Cogn. Neurosci., 21 (2009), pp. 1065-1080.
Figures