0148
Inter-Regional BOLD Latency after Vascular Reactivity Calibration is Correlated to Reaction Time1Institute of Biomedical Imaging, National Taiwan University, Taipei, Taiwan, 2Department of Medical Imaging, Taipei Medical University-Shuang Ho Hospital, New Taipei, Taiwan, 3Graduate Institute of Biomedical Electronics and Bioinformatics, National Taiwan University, Taipei, Taiwan, 4Department of Neuroscience and Biomedical Engineering, Aalto University, Espoo, Finland
Synopsis
Inter-regional BOLD latency between visual and sensimotor cortices were first monitored with fast fMRI (TR=0.1 s) and then calibrated for vascular reactivity using a breath-holding task. Significant delayed response (left: t=4.0, p=0.0019; right: t=6.0, p<0.0001) in the sensorimotor cortex was observed than the visual cortex was detected after removing the vascular confound. Significant correlation between reaction time (428 ± 41ms) and the inter-regional BOLD timing difference (432 ± 149ms) was found within and across subjects.
INTRODUCTION
The blood-oxygen level dependent (BOLD) signal reflects the combination of both underlying neural activity and the intrinsic vascular reactivity1-3. Thus detecting neuronal synchrony as well as inferring inter-regional causal modulation using BOLD signal can be biased2. Mapping the hemodynamic latency using a breath-holding (BH) task provides a way to mitigate this issue by measuring the pure vascular (non-neural) latency component in the BOLD signal2.
Here we used fast fMRI measurements (sampling rate=10 Hz) to measure the BOLD timing difference between visual and sensorimotor areas when subjects engaged a visuomotor (VM) task. In this experiment, the inter-regional BOLD timing difference was further calibrated by subtracting the timing difference caused by vascular reactivity, which was measured by a BH task on the same subjects. We hypothesize that, after calibration, the BOLD signal at visual cortex precedes that at sensorimotor cortex due to the nature of the VM task. This inter-regional timing difference across and within subject are both more closely related to the reaction time (RT) after calibrating the latency caused by regional vascular reactivity.
METHODS
Data were collected on a 3T MRI scanner (Skyra, Siemens) and a 32-channel head coil array from 13 healthy right-handed subjects with written informed consents approved by the Institute Reviewing Board. Simultaneous multi-slice inverse imaging (SMS-InI) measured the BOLD signal with 10 Hz sampling rate (TR=0.1s), 5 mm isotropic spatial resolution, and whole-brain coverage4. Each subjects had two functional scans with a breath-holding (BH) and a VM task. The BH challenge was preceded by paced breathing (period=43 s; 2 s/cycle; visual cued) followed by 2 s of exhalation and then breath holding for 15 s. The VM task was to use either left or right thumb to press the button immediately as perceiving the ipsilateral checkerboard flashing. There were 20 trials of left and right hemifield visual stimuli in 240 s in the experiment.
Voxel-wise hemodynamic latencies were measured by correlating between the time series at each image voxel and a reference time series. The reference time series of the VM task was the convolution of a canonical hemodynamic response function and a time series indicating visual stimulus onsets. The reference time series of the BH task was the average time series across voxels significantly correlated with the BH regressor, which was the convolution of a canonical hemodynamic response function and a time series indicating BH periods2. The latencies were defined as the time shift yielding the maximal cross correlation. The time shift was permitted between ± 4 s2. The relative latency differences between visual and sensorimotor areas measured in the BH task was subtracted from that in the VM task in order to reduce the confounds caused by vascular reactivity.
The relative latency between visual and sensorimotor areas was correlated with individual’s RT. We also estimated this fMRI-RT correlation within subjects using a bootstrap approach.
RESULTS
Figure 1 shows the regional BOLD signal latency measured by the BH task. We found the delayed response in the posterior brain adjacent to the large veins. The VM latency map (Figure 2: Bottom) shows that the sensorimotor area had earlier BOLD signal than the visual area (left: 1104 ± 934 ms, t=-0.85, p=0.41; right: 1089 ± 942 ms, t=-1.4, p=0.19). After calibrating the latency caused by vascular reactivity (Figure 3A), the BOLD at the sensorimotor area was later (left: 402 ± 152 ms; right: 462 ±145 ms) than at the visual area (left: t=4.0, p=0.0019; right: t=6.0, p<0.0001). The relative latency between visual and sensorimotor cortices were significantly correlated with RT (Figure 3B; 428 ± 41 ms, r=0.59, p=0.001). Within each subject, we also found significant correlation between the reaction time and the RT across bootstrap samples (Figure 4).DISCUSSION & CONCLUSION
Our vascular reactivity maps were similar to those reported previously2. Calibrating the vascular reactivity led to the inter-regional timing difference matched to the hypothesis (first visual and then sensorimotor areas) (Figure 5). RT in the range of 409 ± 36 ms and 448 ± 39 ms at left and right hemisphere, respectively, were found correlated with fMRI timing across (Figure 3B) and within (Figure 4) subjects. These results suggest that BOLD signal has fine timing information in tens and hundreds of milliseconds related to behavior and potentially neuronal activity. Previously we have reported that the inter-regional BOLD timing is closely related to the underlying oscillatory neuronal responses5. Further study on the electrophysiological basis of the calibrated inter-regional BOLD timing difference is under the way.Acknowledgements
This work was partially supported by Ministry of Science and Technology, Taiwan (103-2628-B-002-002-MY3, 105-2221-E-002-104), and the Academy of Finland (No. 298131).References
1 Ekstrom A.Brain Res. Rev.,2010; 62:233-244.
2 Chang C., Thomason M. E. & Glover G. H.Neuroimage.2008; 43:90-102.
3 Puckett A. M., Mathis J. R. & DeYoe E. A.Hum. Brain Mapp.,2014; 35:5550-5564.
4 Chu Y. H., Hsu Y. C. & Lin F. H.Proc Intl Soc Magn Reson Med.2016; 946.
5 Lin F.-H., Witzel T., Raij T. et al.Neuroimage.2013; 78:372-384.
Figures
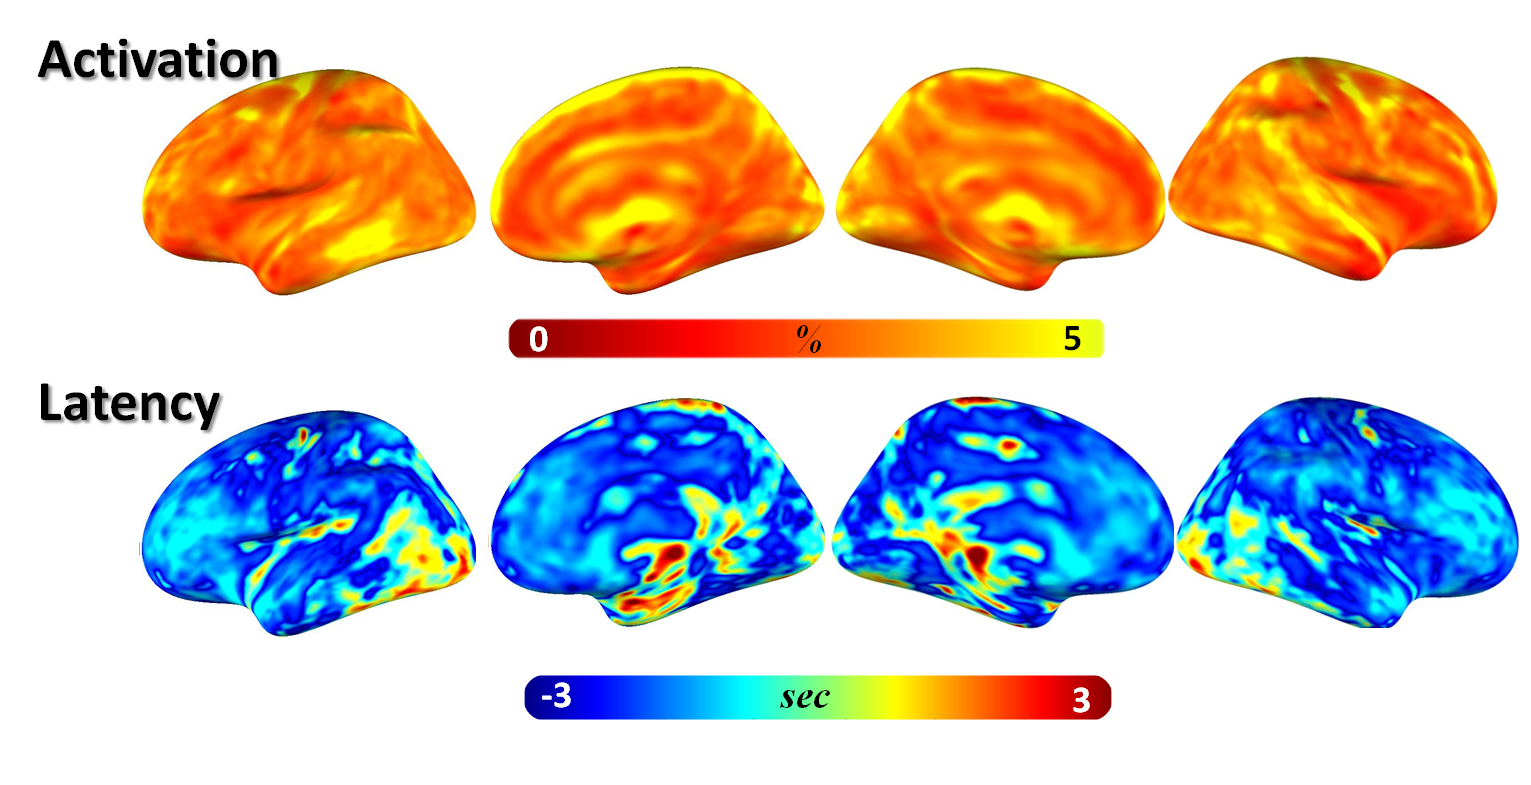
Figure 1 Breath-Holding (BH) Task: Activation and Latency Map
Upper: Percentage BOLD signal change map (after cross-correlation latency shift)
Bottom: Latency map (Note that: The cold color indicates the latency earlier than whole brain average, while the warm color indicates the slower latency.)
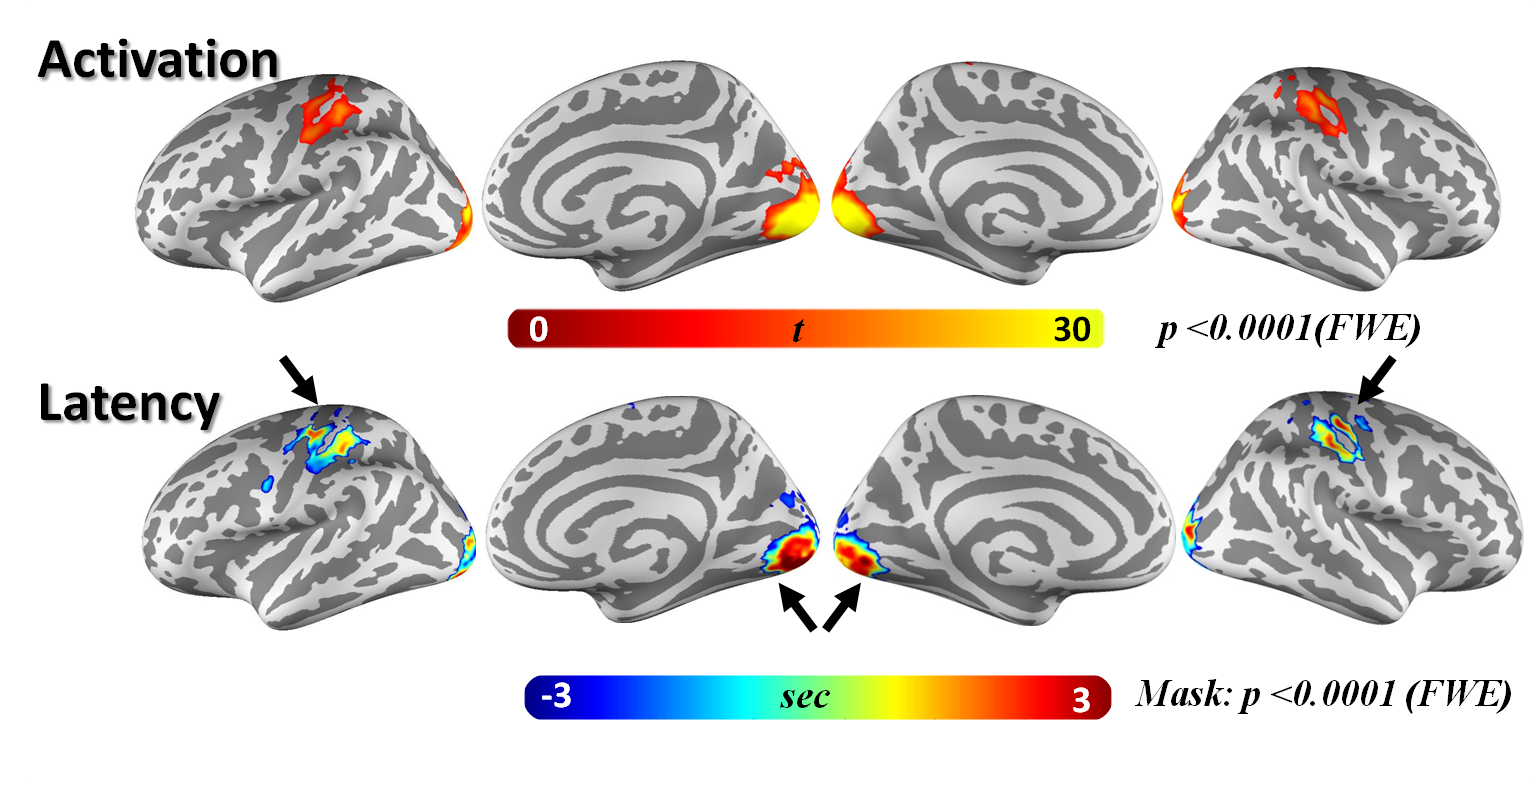
Figure 2 Visuomotor (VM) Task: Activation and Latency Map
Upper: Activation map (after cross-correlation latency shift).
Bottom: Latency map (Note that: The cold color indicates the latency earlier than whole brain average, while the warm color indicates the slower latency.). All images were masked by a significant threshold of p<0.0001(after family-wise error, FWE, correction).
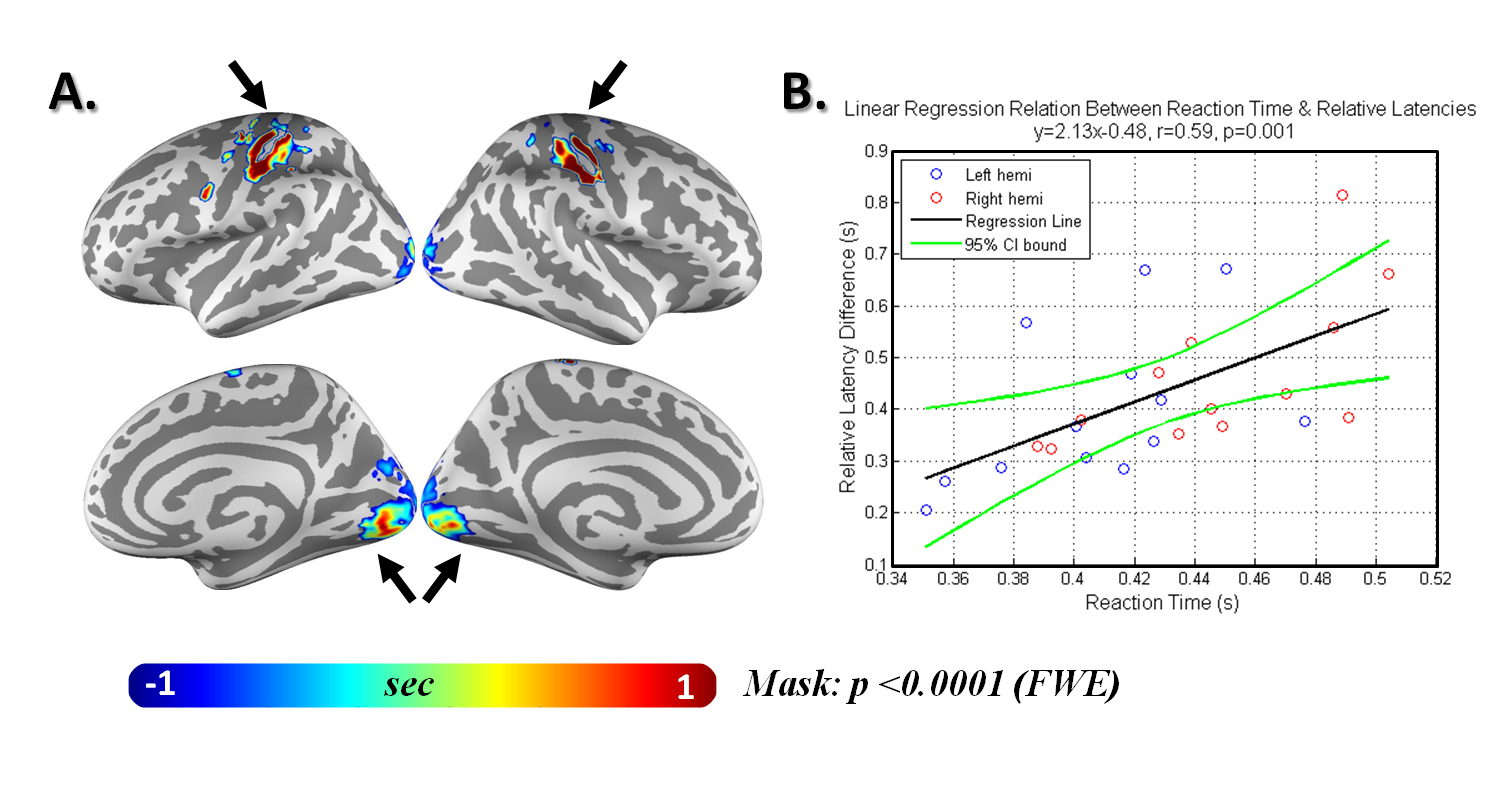
Figure 3 Between-Subject Correlation between Inter-Regional BOLD Latency after Calibrating the Vascular Reactivity and the Reaction Time.
Left: Relative latency map masked by a significant threshold: p<0.0001(FWE).
Right: Linear regression between the reaction time in the VM task and inter-regional BOLD latency after calibrating the vascular reactivity across 13 subjects. (The blue circles indicate data from the left hemisphere; the red circles indicate the data from the right hemisphere.)
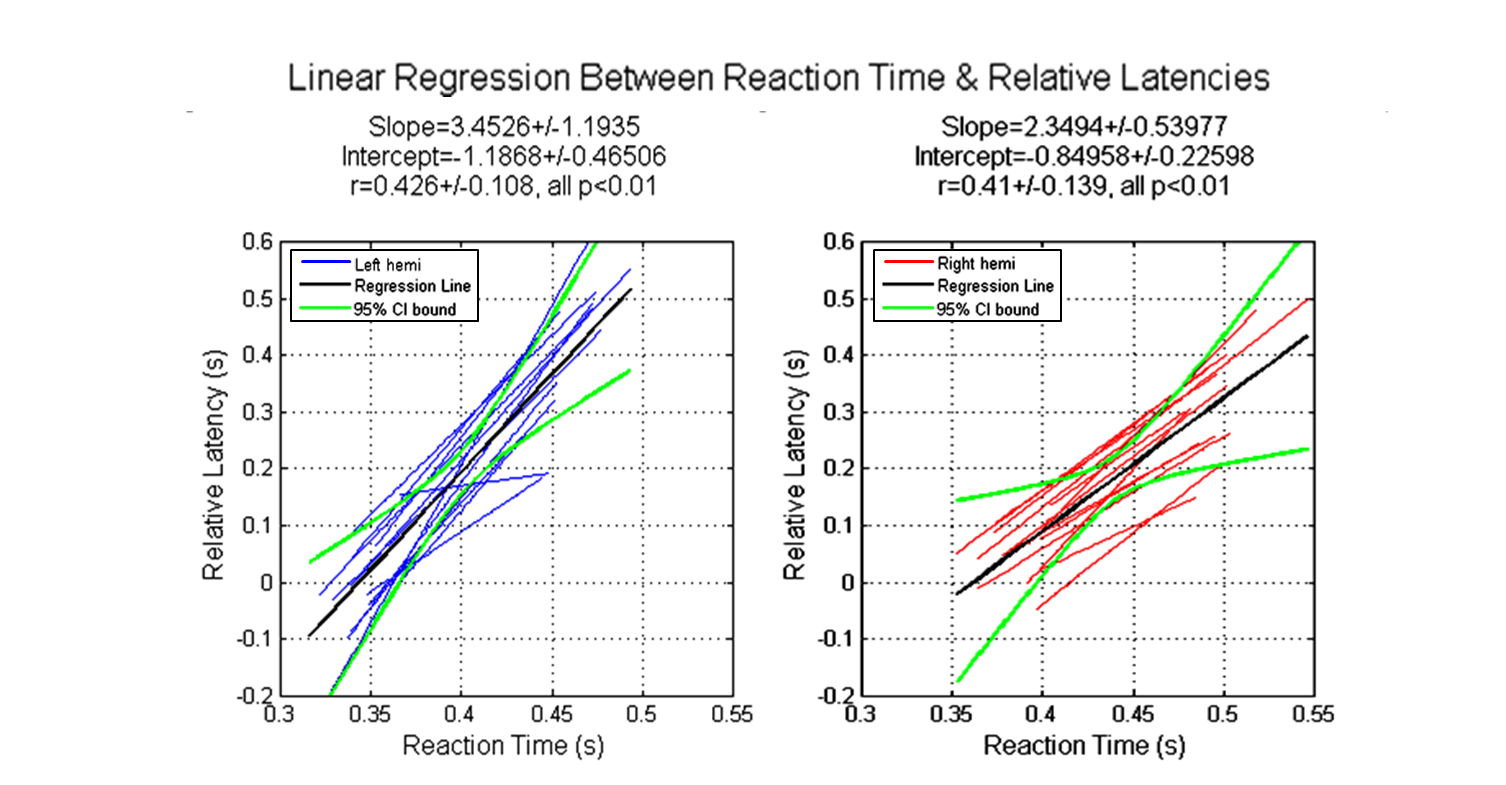
Figure 4 Within-Subject Correlation between Inter-Regional BOLD Latency after Calibrating the Vascular Reactivity and the Reaction Time.
Left: Within-subject linear regression between the reaction time and inter-regional BOLD latency after calibrating the vascular reactivity in the left hemisphere.
Right: Within-subject linear regression between the reaction time and inter-regional BOLD latency after calibrating the vascular reactivity in the right hemisphere.
Note that: Data were generated from bootstraps. Each blue/red line indicates a regression for one subject. Black line indicates the results combining all data from all subjects.
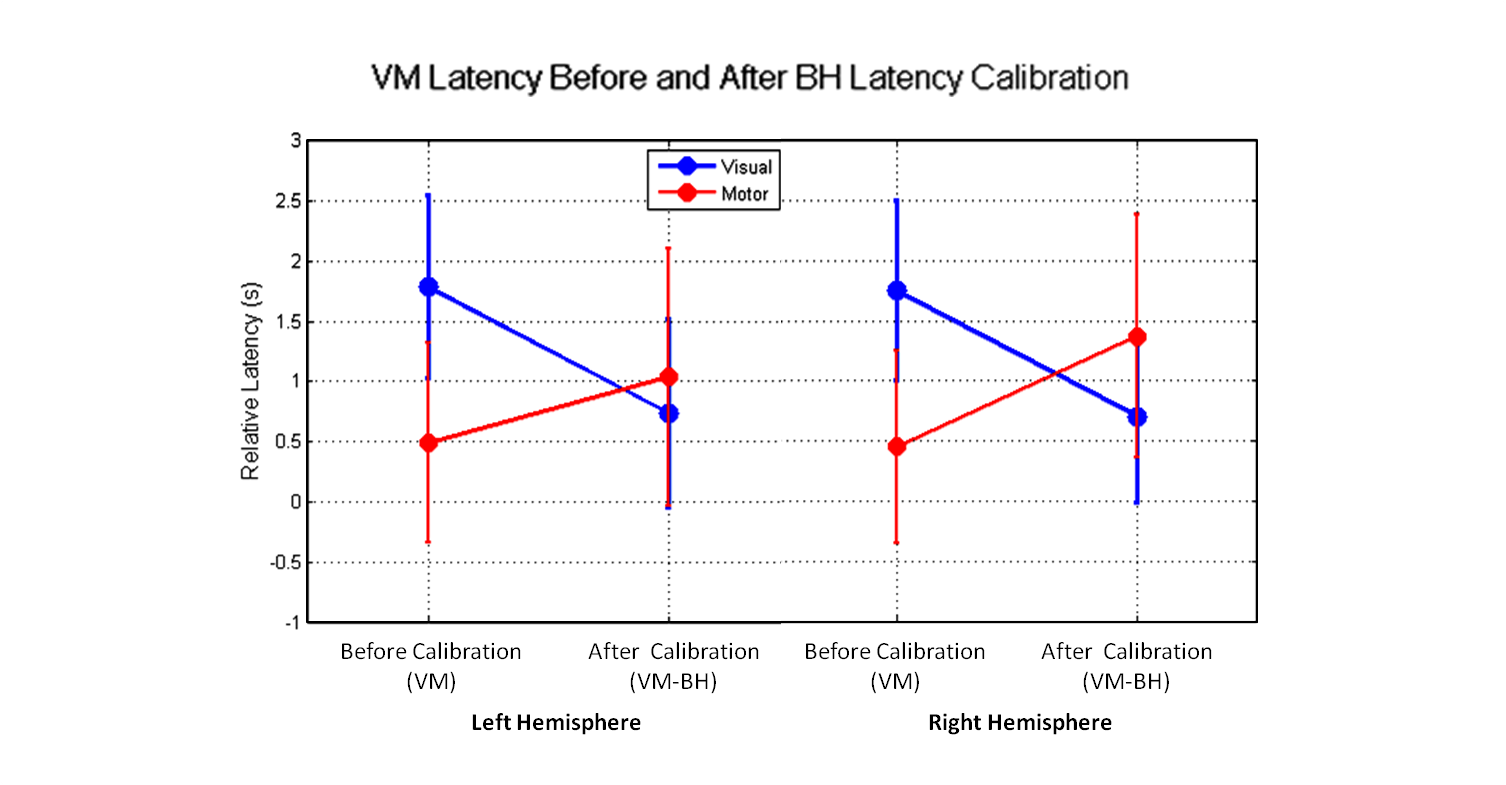
Figure 5 The Visual-Sensorimotor Inter-Regional BOLD Latency before and after Calibrating the Vascular Reactivity
Left: The average and standard deviation of VM latencies at visual (blue line; before: 1.789+/-0.763s, after: 0.783+/-0.784s) and sensorimotor (red line; before: 0.491+/-0.825s, after: 1.038+/-1.071s) area in the left hemisphere.
Right: The average and standard deviation of VM latencies at visual (blue line; before: 1.752+/-0.751s, after: 0.707+/-0.722s) and sensorimotor (red line; before: 0.453+/-0.801, after: 1.374+/-1.013s) area in the right hemisphere.