0135
Investigating microstructural heterogeneity of white matter hyperintensities in Alzheimer’s disease using single-shell 3-tissue constrained spherical deconvolution1Florey Institute of Neuroscience and Mental Health, Melbourne, Australia, 2Florey Department of Neuroscience and Mental Health, University of Melbourne, Melbourne, Australia, 3The Australian eHealth Research Centre, CSIRO Health and Biosecurity, Brisbane, Australia, 4Department of Medicine, Austin Health, University of Melbourne, Melbourne, Australia, 5Department of Molecular Imaging & Therapy, Centre for PET, Austin Health, University of Melbourne, Melbourne, Australia
Synopsis
White matter hyperintensities (WMH) observed on FLAIR MRI are highly prevalent in Alzheimer’s disease. Although often associated with cognitive decline, such associations are highly variable, likely due to the underlying pathological heterogeneity within these lesions. Here, we explore this potential heterogeneity in vivo in an Alzheimer’s disease cohort, by investigating relative tissue fractions obtained using single-shell 3-tissue constrained spherical deconvolution (SS3T-CSD). We show distinguishable tissue profiles of lesions based on classification as periventricular or deep, and additionally show heterogeneity within lesions, thus highlighting the pitfalls of binary classification of WMH, and the value of investigating their underlying diffusional properties.
Introduction
White matter hyperintensities (WMH) are commonly observed on T2-weighted FLAIR images in elderly individuals, and thought to be linked to vascular risk, age, and cognitive decline1,2. They are more prevalent and severe in Alzheimer’s disease (AD) patients3,4; however, the clinical significance of these lesions is insufficiently understood, with inconsistent reports of associations with cognitive decline in dementia5. Such inconsistencies may arise from underlying heterogeneity within WMH, which are typically modelled in binary fashion as either present or absent in FLAIR images. Histologically, these lesions indeed exhibit heterogeneity in their pathological substrates despite appearing homogeneous on FLAIR, and have been associated with axonal loss, demyelination, gliosis, and arteriolosclerosis, amongst others3,6. Other imaging modalities such as magnetization transfer imaging have also suggested underlying heterogeneity across lesions7.
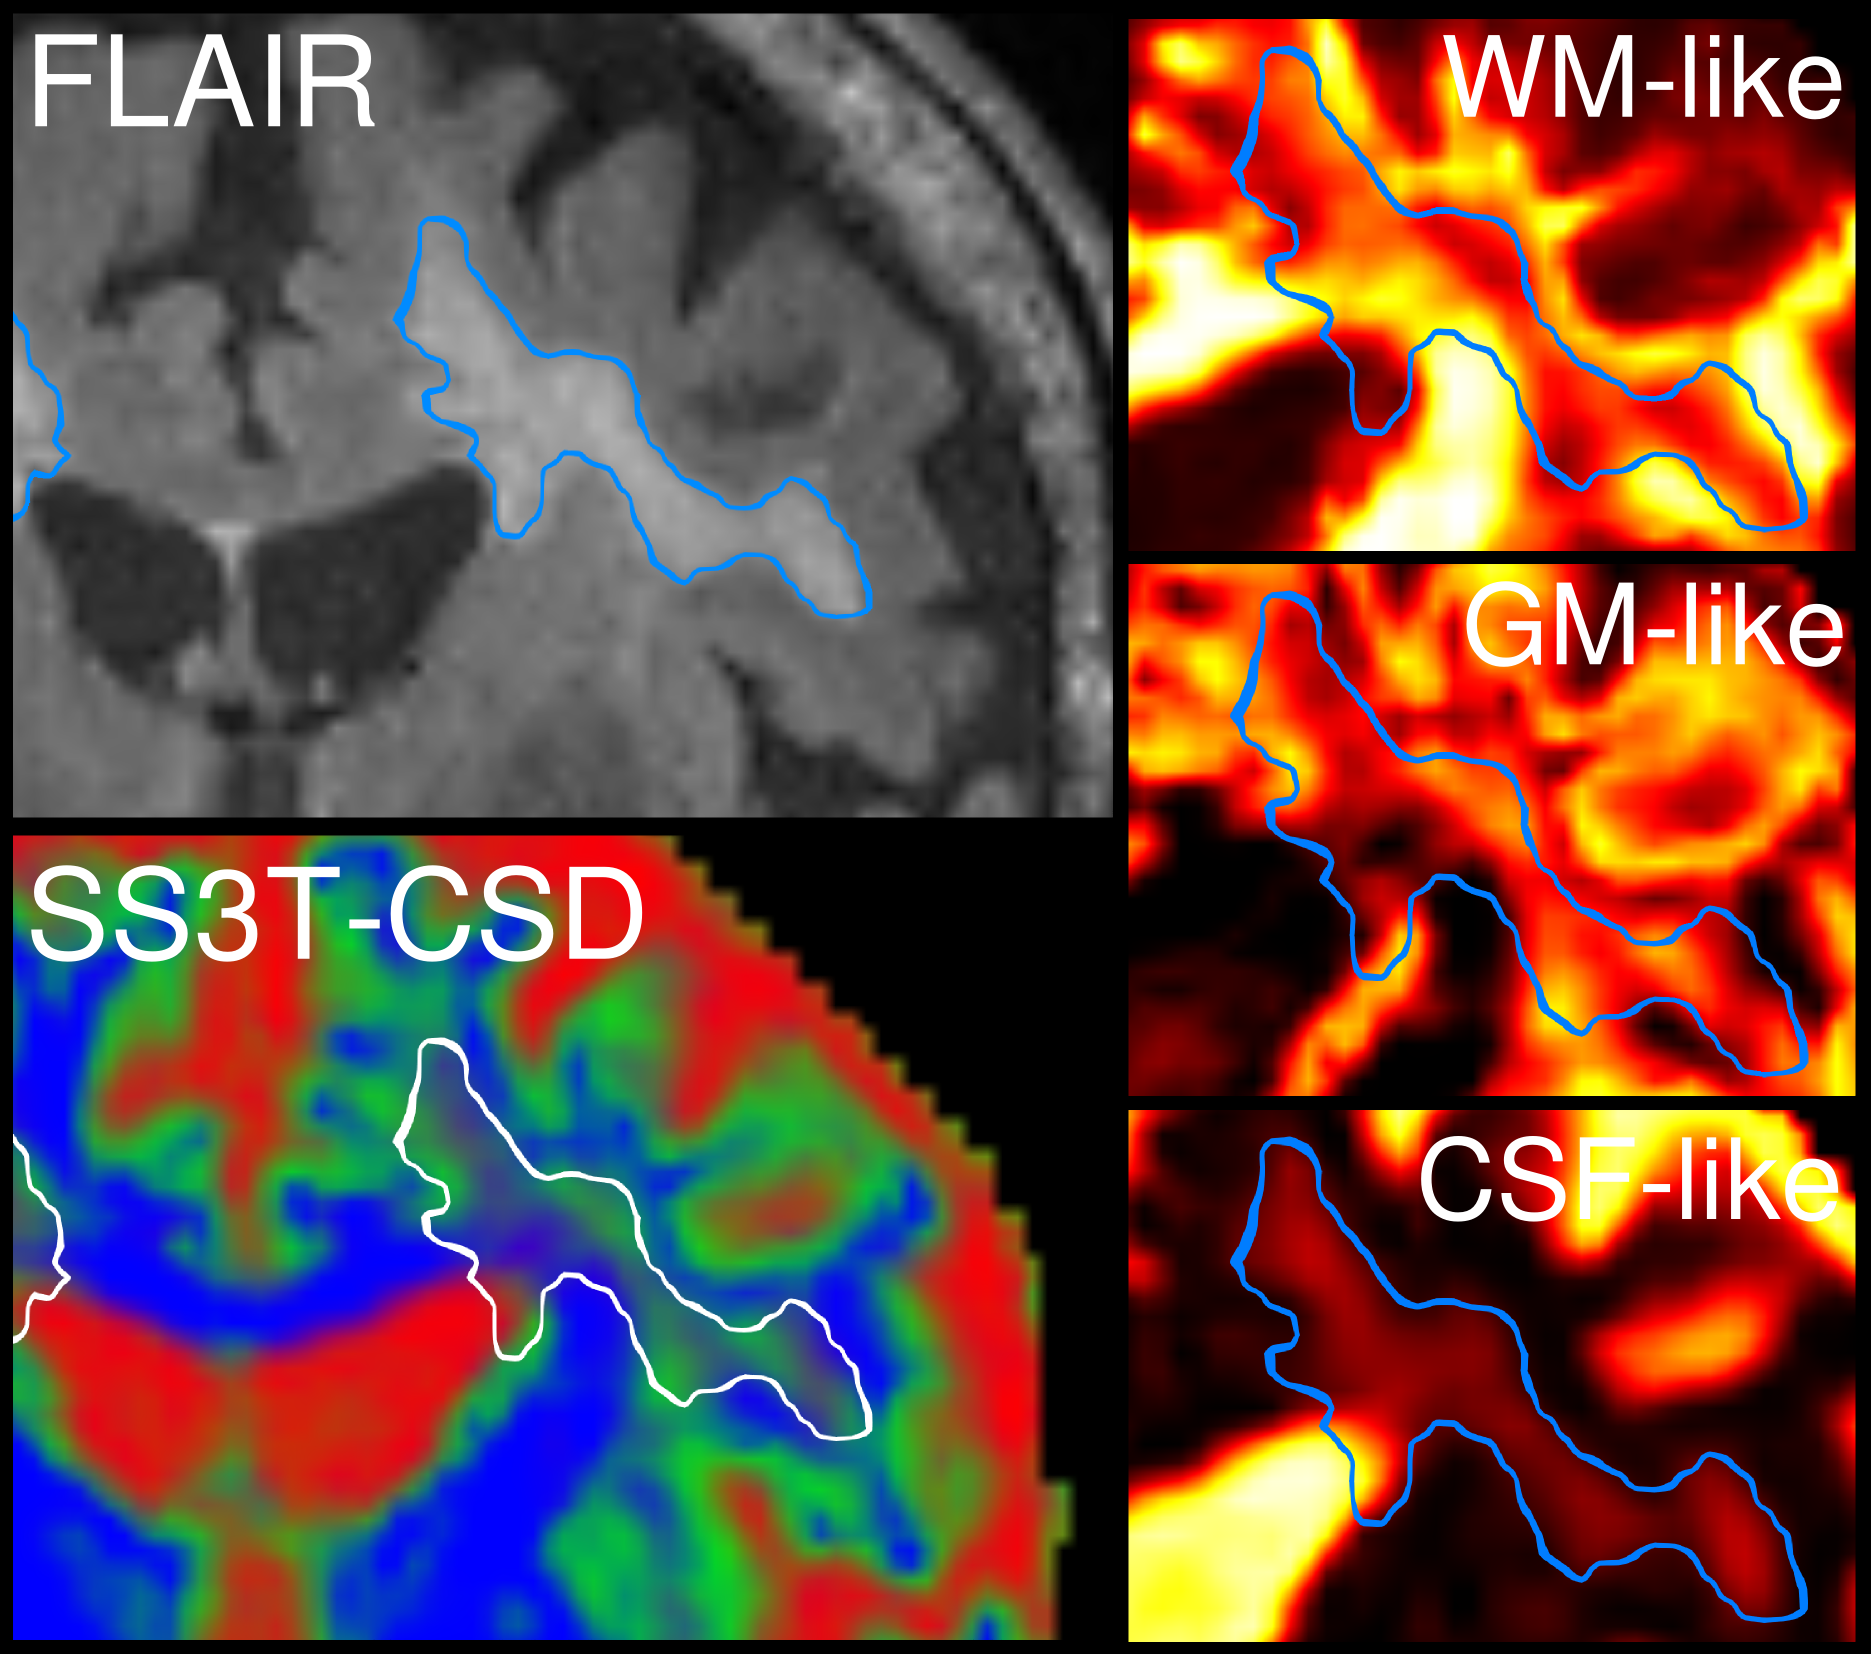
Advanced diffusion imaging could provide greater in vivo insight into heterogeneity both within and across WMHs. Single-shell 3-tissue constrained spherical deconvolution (SS3T-CSD)8 enables estimation of white matter (WM) fibre orientation distributions (FODs) as well as grey matter (GM) and CSF compartments. It can be used to quantify the relative WM-GM-CSF-likeness of the signal, which may relate to the underlying tissue microstructure in pathology9.
Purpose
We aimed to explore the underlying diffusional properties of WMH in an AD cohort using SS3T-CSD, to determine if the technique could reveal and characterise underlying heterogeneity across different lesion types, and within lesions.Methods
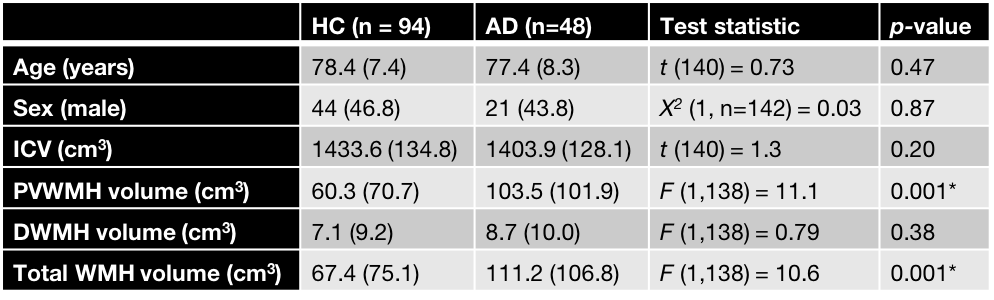
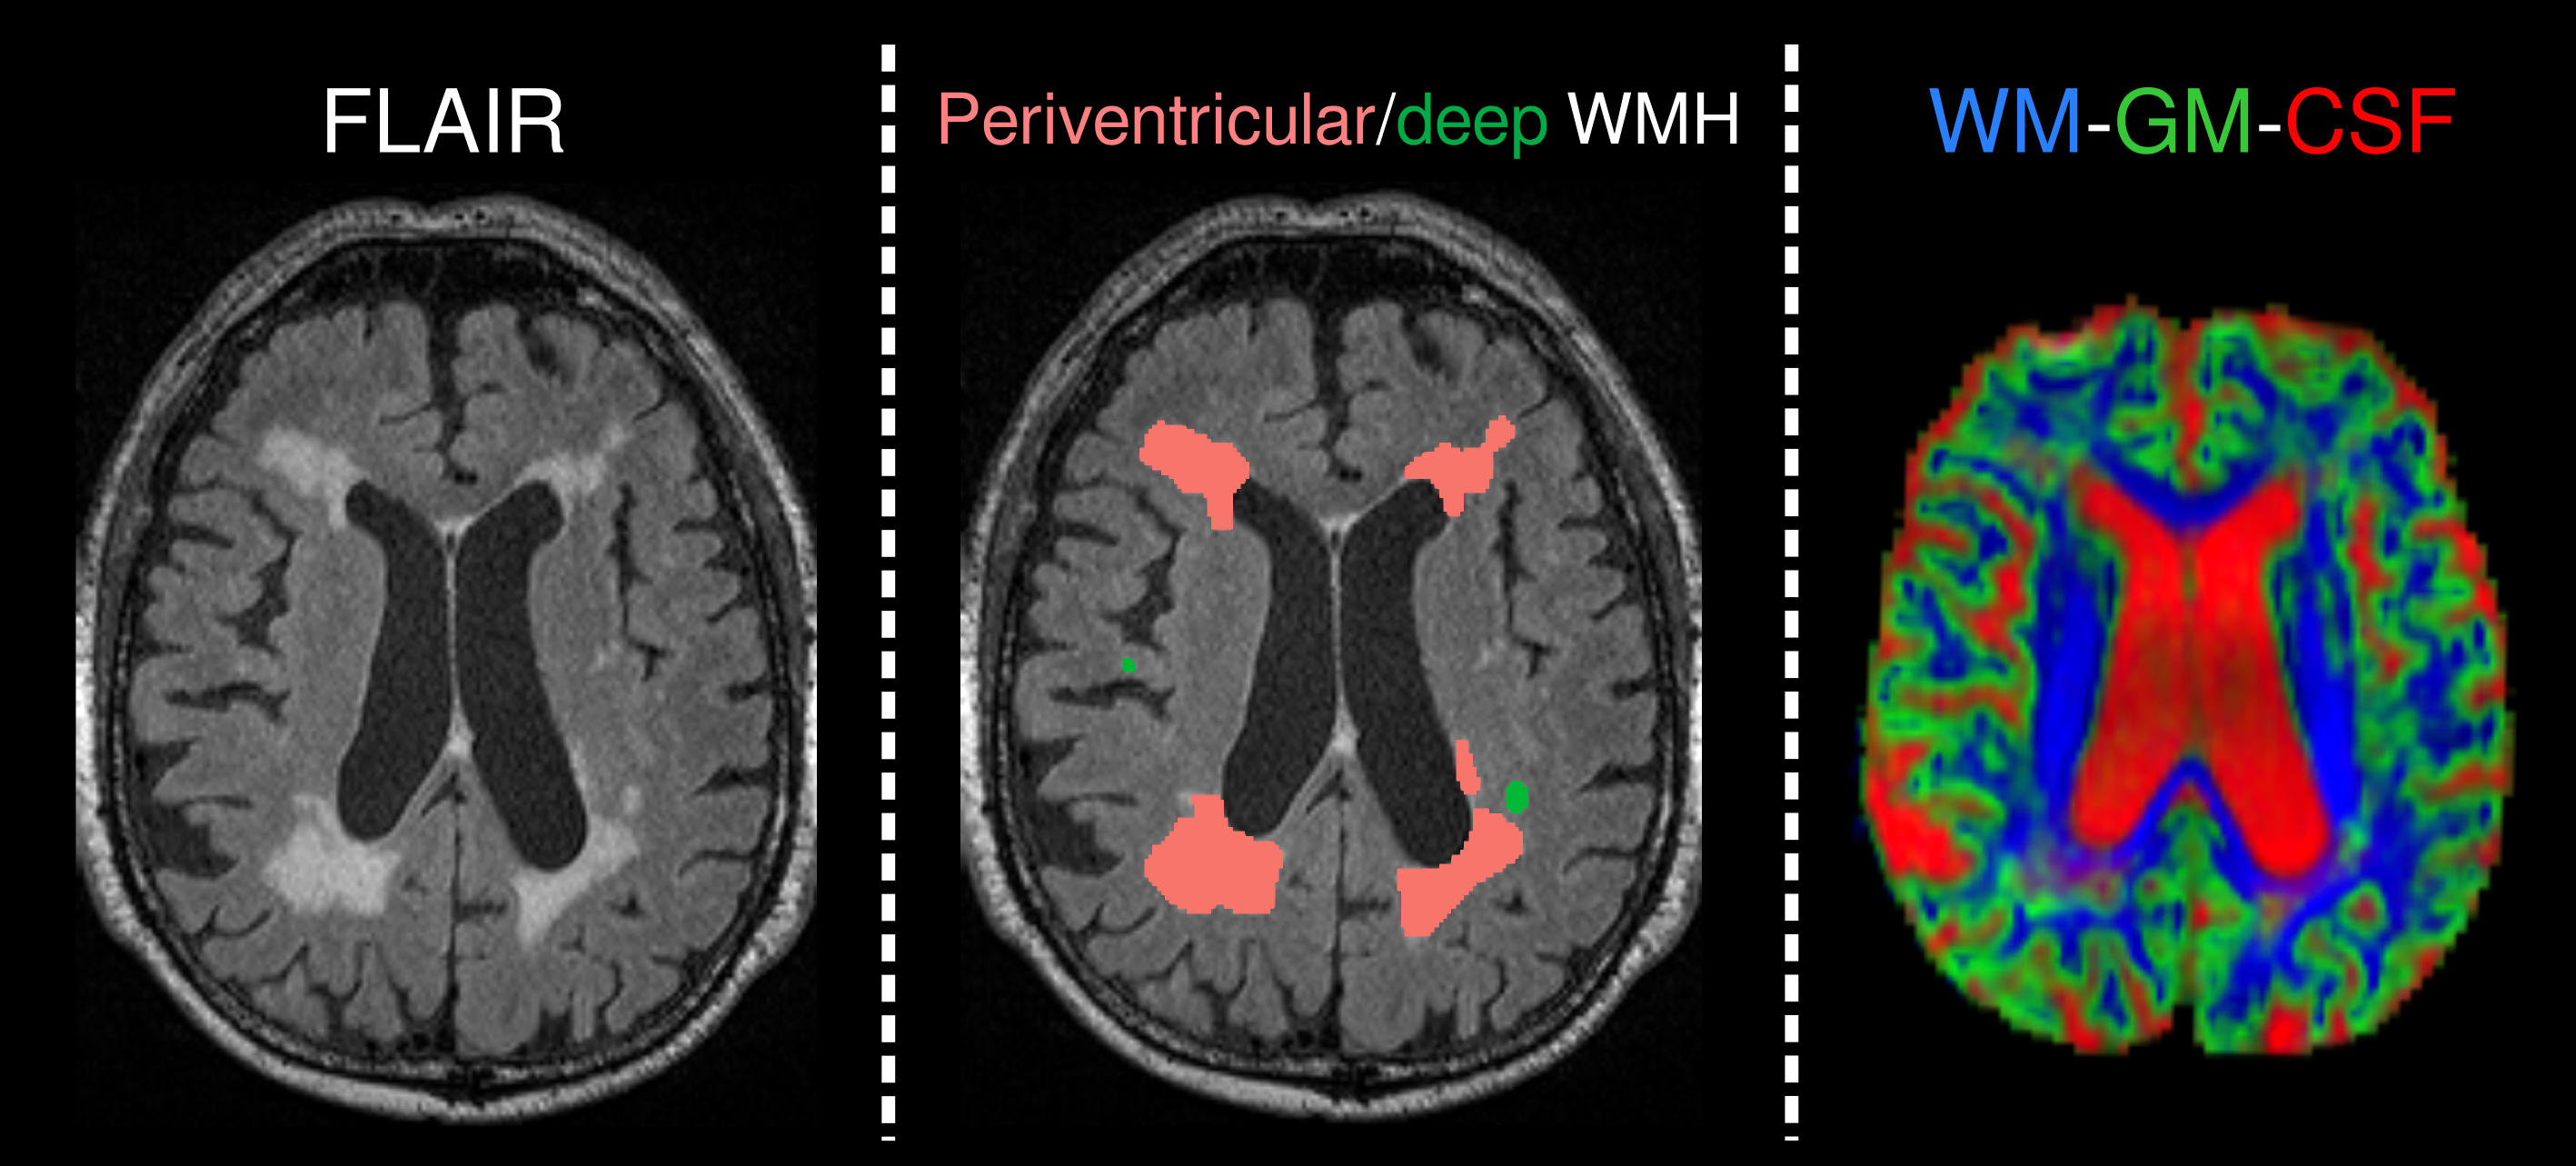
DWI-data were acquired from 48 AD and 94 healthy elderly control (HC) subjects (demographics in Table 1) from the Australian Imaging, Biomarkers and Lifestyle (AIBL) study on a 3T Siemens Trio scanner (2.3mm3 isotropic voxels, 60 directions at b=3000s/mm2, 8 b=0 images), along with FLAIR (0.9x1x1mm3) images. All data were denoised10, corrected for motion/eddy-currents11 and bias fields12. WMH segmentations were automatically performed on FLAIR images using the HyperIntensity Segmentation Tool (HIST)13, and classified as periventricular or deep, based on distance of lesion volumes from ventricles (see Fig. 1).
WM FODs and GM/CSF compartments were computed with SS3T-CSD8 using average WM/GM/CSF response functions obtained from the data themselves14. Spatial correspondence was achieved by registering each subject’s FOD image to a study-specific FOD template, along with FLAIR and WMH segmentations. A normal-appearing WM (NAWM) mask was created by subtracting WMH segmentations from a WM mask in template space.
The WM-GM-CSF compartments from SS3T-CSD were normalised to obtain signal fractions (that summed to 1). Mean signal fractions were computed within periventricular WMH, deep WMH, and NAWM for each subject.
Results
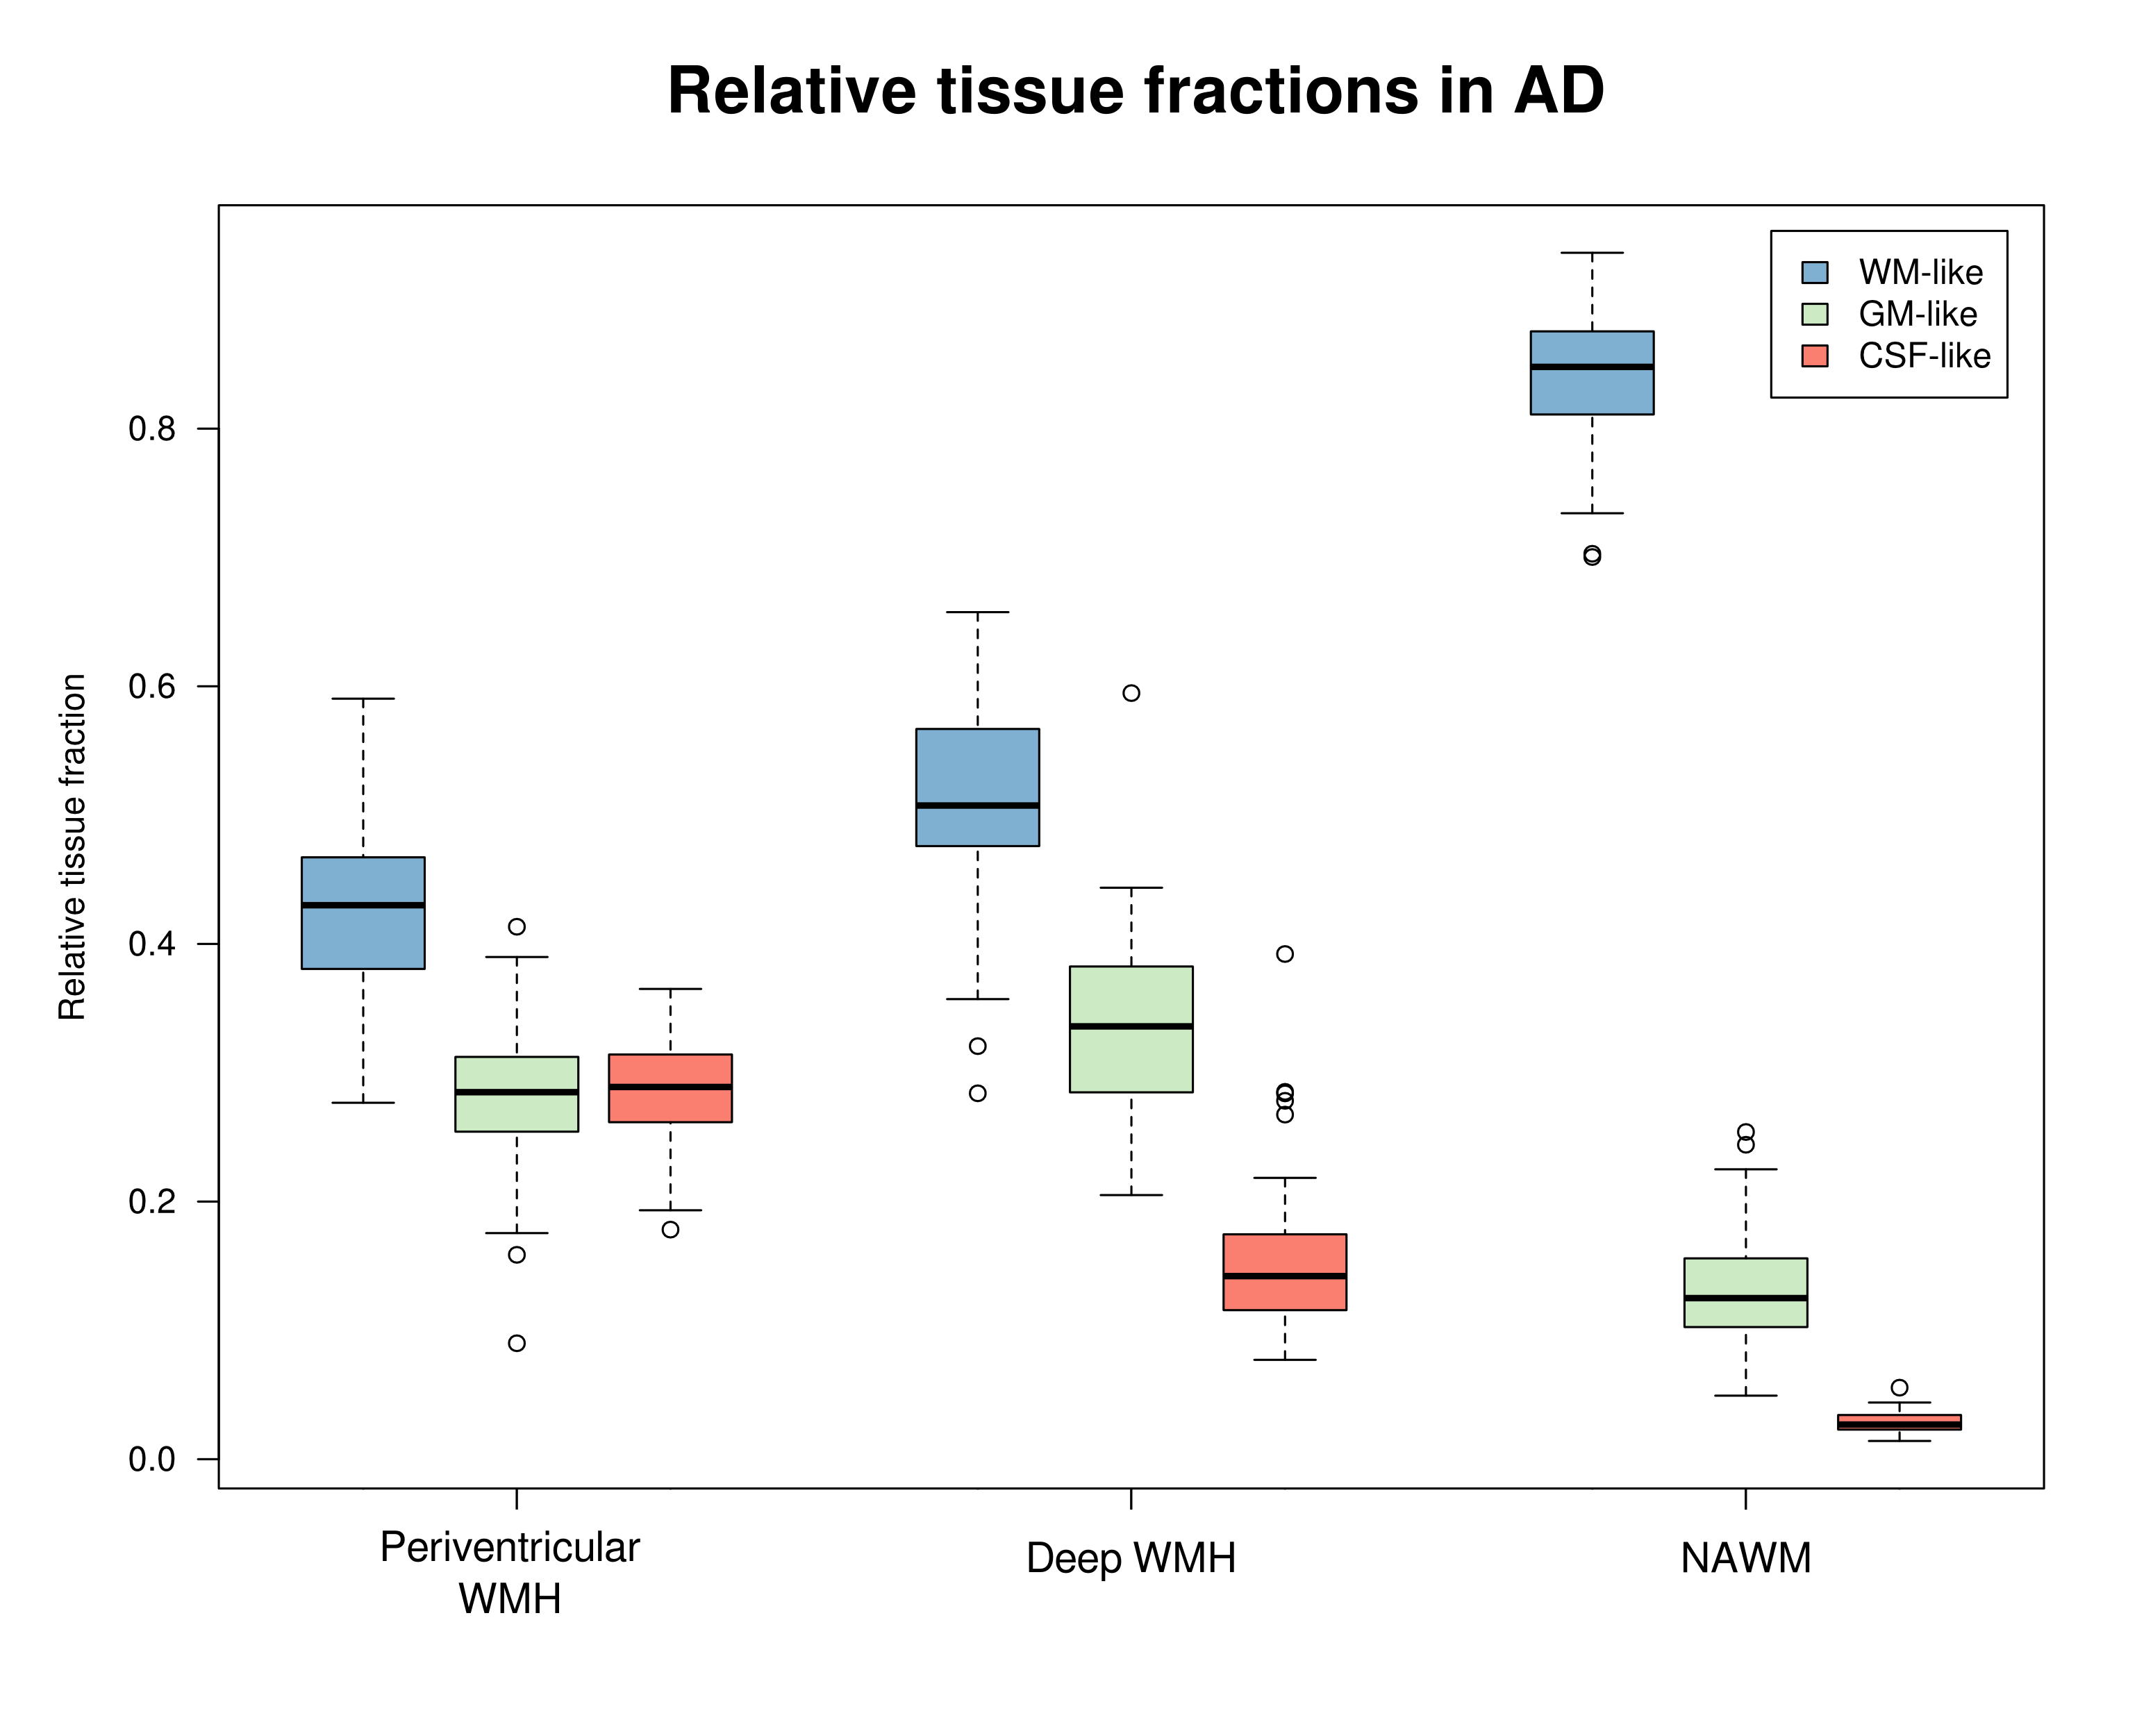
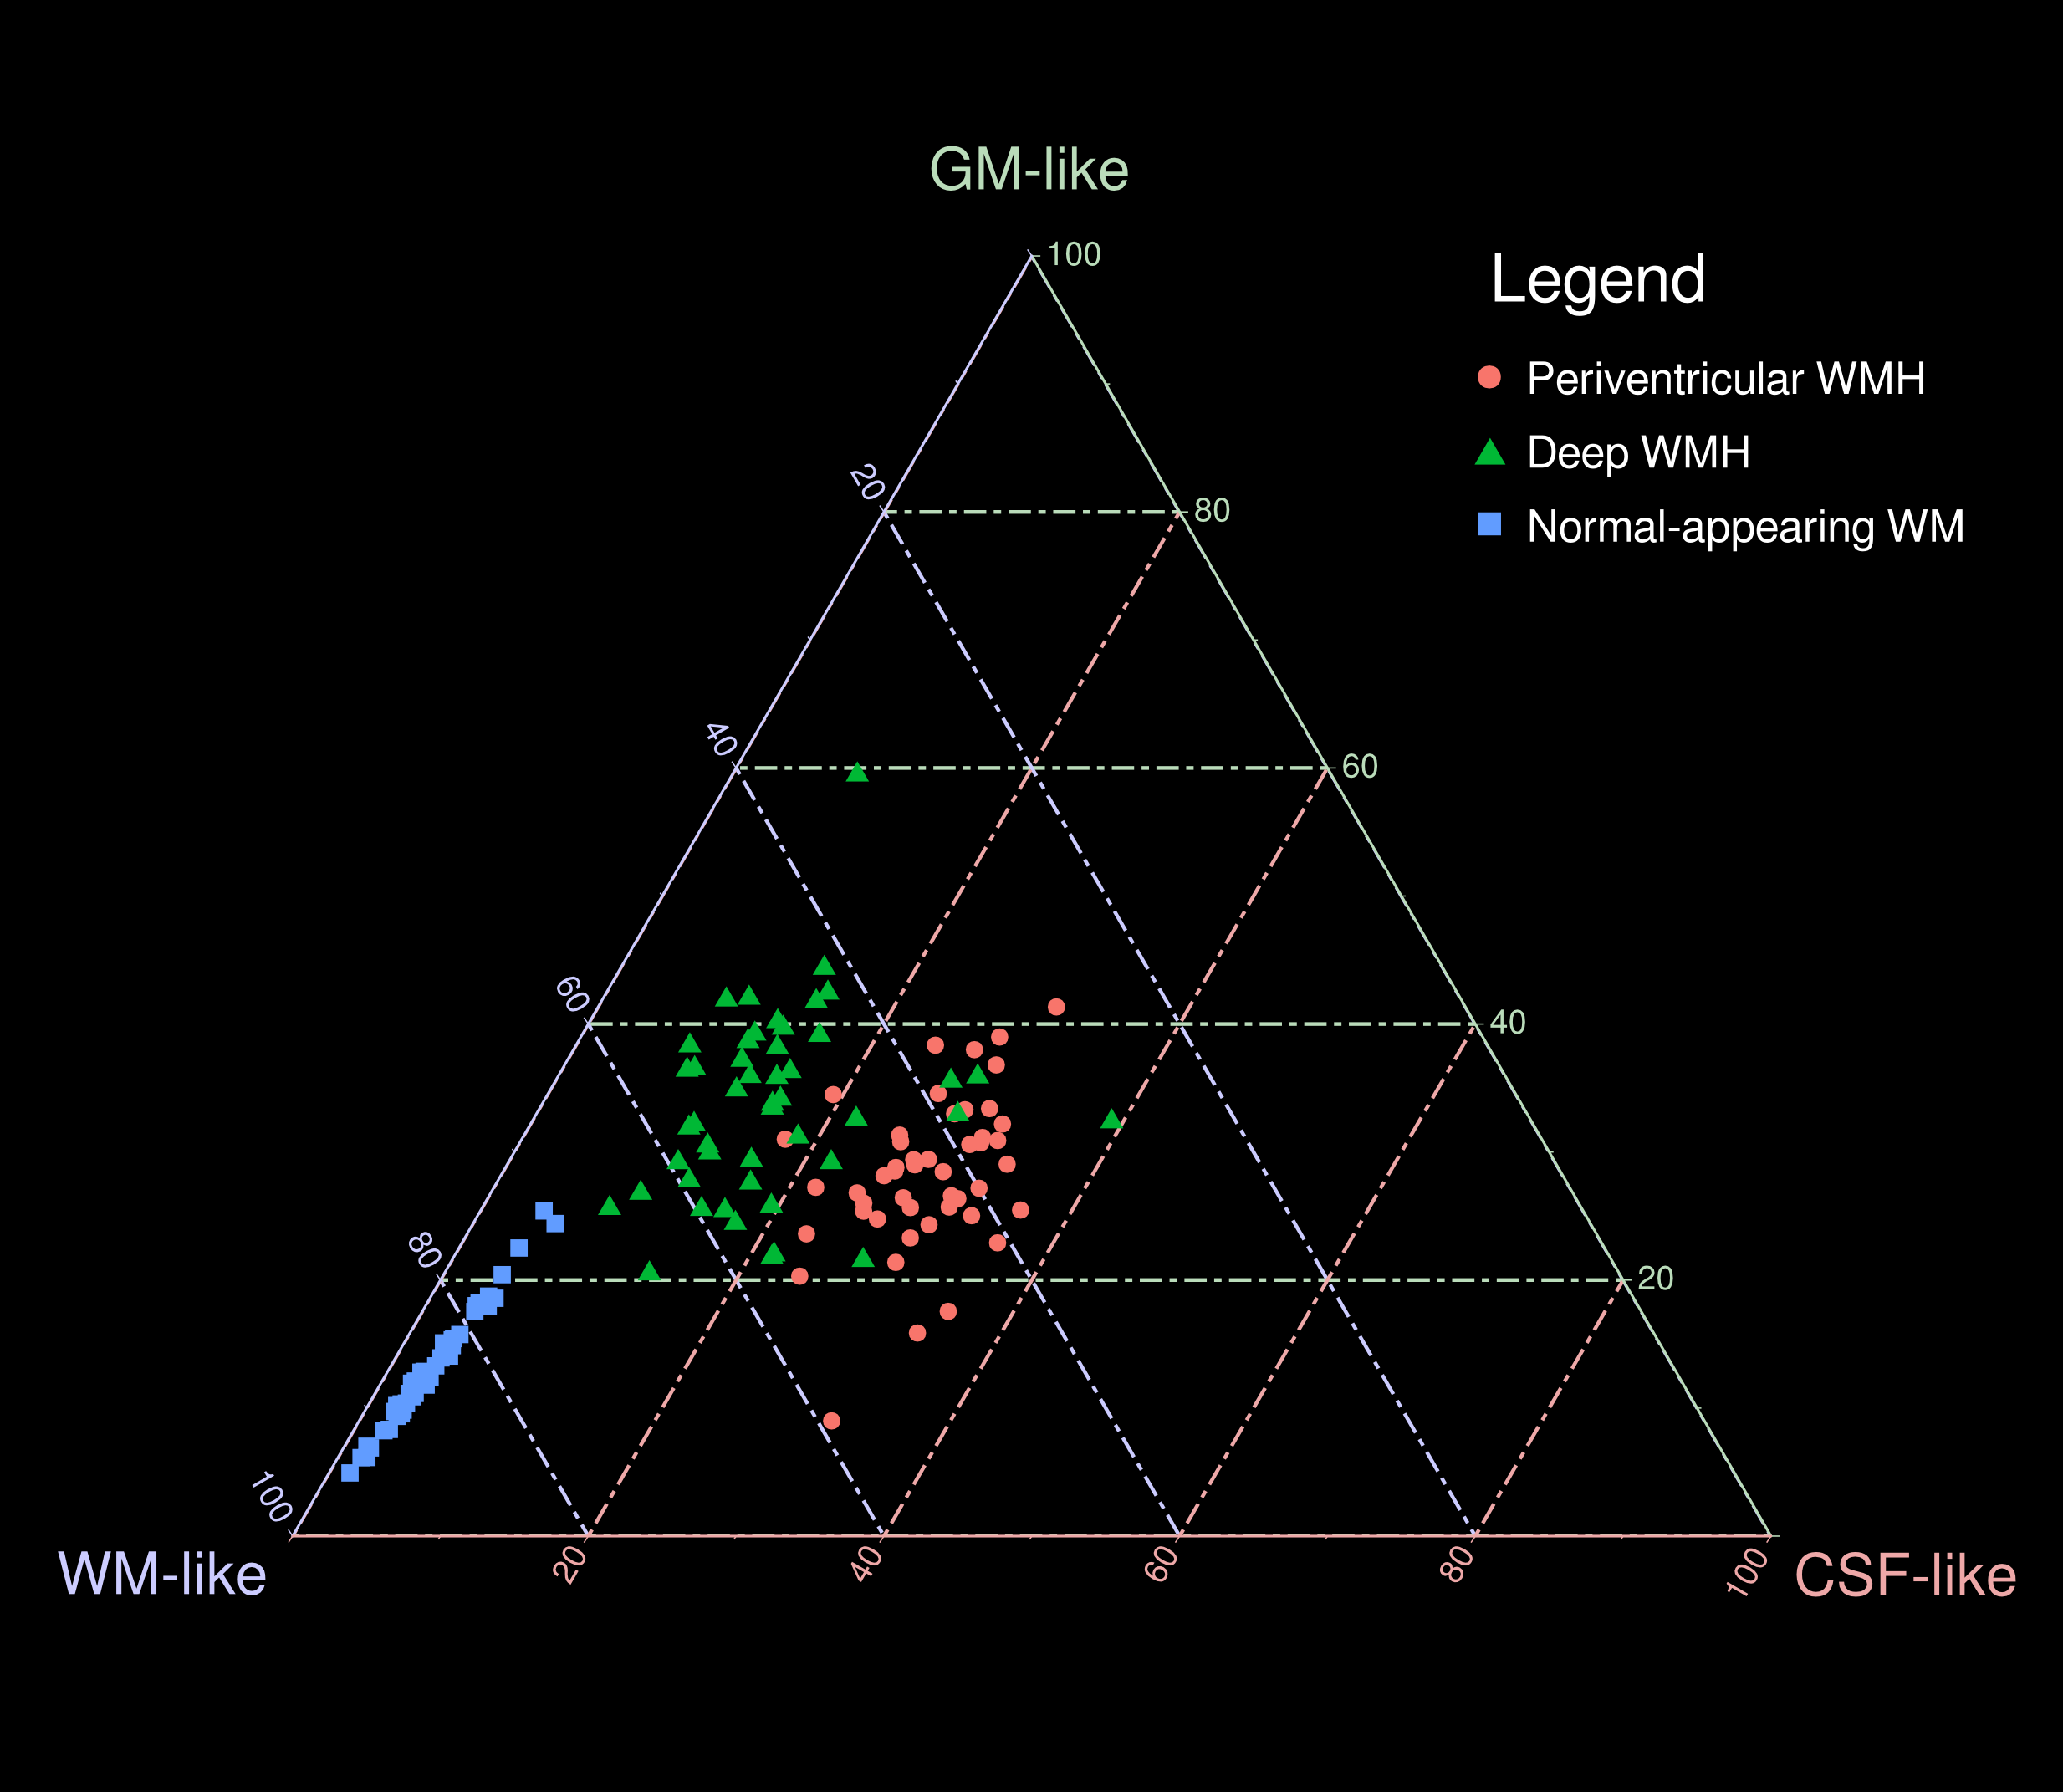
AD patients exhibited significantly greater volume in periventricular WMH, but not deep WMH, compared to HC (Table 1). In AD, mean relative tissue fractions derived from SS3T-CSD showed different profiles of WM-GM-CSF fractions in periventricular and deep WMH, with higher CSF-likeness in periventricular, and higher GM-likeness in deep WMH (Fig. 2). Periventricular and deep WMH formed separate clusters based on their relative tissue fraction profiles, as did NAWM (Fig. 3). In addition, heterogeneity was consistently observed within segmented lesions (Fig. 4).Discussion
Accumulating evidence suggests that WMH are heterogeneous in their underlying pathology, which may explain difficulties in untangling their association with clinical and pathological progression of Alzheimer's disease. Using SS3T-CSD, we reveal underlying heterogeneity within these lesions, and identify “GM-like” compartments within WMH, which have been suggested to represent gliosis, as well as “CSF-like” compartments that likely indicate increased interstitial fluid9.
We show that periventricular and deep WMH exhibit distinct WM-GM-CSF profiles, and can thus be distinguished by their diffusional properties from one another (and from NAWM), likely due to differing pathological substrates. As shown in Figs. 2 and 3, periventricular WMH exhibited higher relative CSF-like fraction than deep WMH across AD subjects, suggesting increased interstitial fluid within these lesions, likely related to substantial myelin and axonal loss. Given the higher periventricular WMH volume in AD compared to HC, these lesions could be more deleterious than deep WMH, and more closely associated with AD as previously suggested15. Deep lesions, which were equally extensive in HC as in AD, exhibited greater GM-like fraction, which may reflect gliosis in response to white matter damage. However, these classifications alone did not capture the heterogeneity within lesions, and substantial variability was consistently observed in relative WM-GM-CSF-like fractions within regions classed together as periventricular or deep WMH (Fig. 4). We thus highlight the importance of investigating these lesions as heterogeneous entities when probing associations with histopathology and clinical progression in AD. To this end, relative tissue fractions from SS3T-CSD will likely reflect histological differences better than FLAIR, which could have widespread disease-based applications, and could additionally guide investigation of lesions and their potential association with tract-specific changes.
Acknowledgements
No acknowledgement found.References
1. Debette, S. & Markus, H. S. The clinical importance of white matter hyperintensities on brain magnetic resonance imaging: systematic review and meta-analysis. BMJ 341, c3666 (2010).
2. Brickman, A. M. Contemplating Alzheimer’s disease and the contribution of white matter hyperintensities. Curr. Neurol. Neurosci. Rep. 13, 1–9 (2013).
3. Scheltens, P. et al. Histopathologic correlates of white matter changes on MRI in Alzheimer’s disease and normal aging. Neurology 45, 883–888 (1995).
4. Yoshita, M. et al. Extent and distribution of white matter hyperintensities in normal aging, MCI, and AD. Neurology 67, 2192–2198 (2006).
5. Schmidt, R. et al. MRI-detected white matter lesions: do they really matter? J. Neural Transm. 118, 673–681 (2011).
6. Gouw, A. A. et al. Heterogeneity of white matter hyperintensities in Alzheimer’s disease: post-mortem quantitative MRI and neuropathology. Brain 131, 3286–3298 (2008).
7. Spilt, A. et al. Not all age-related white matter hyperintensities are the same: a magnetization transfer imaging study. AJNR Am. J. Neuroradiol. 27, 1964–1968 (2006).
8. Dhollander, T. & Connelly, A. A novel iterative approach to reap the benefits of multi-tissue CSD from just single-shell (+ b= 0) diffusion MRI data. Proceedings of the International Society for Magnetic Resonance in Medicine. Singapore, Singapore 24, 3010 (2016).
9. Dhollander, T., Raffelt, D. & Connelly, A. Towards interpretation of 3-tissue constrained spherical deconvolution results in pathology. in Proc. Intl. Soc. Mag. Reson. Med 25, 1815 (2017).
10. Veraart, J., Fieremans, E. & Novikov, D. S. Diffusion MRI noise mapping using random matrix theory. Magn. Reson. Med. (2016).
11. Andersson, J. L. R. & Sotiropoulos, S. N. An integrated approach to correction for off-resonance effects and subject movement in diffusion MR imaging. Neuroimage 125, 1063–1078 (2016).
12. Tustison, N. J. et al. N4ITK: improved N3 bias correction. IEEE Trans. Med. Imaging 29, 1310–1320 (2010).
13. Manjón, J. V. et al. HIST: HyperIntensity Segmentation Tool. in Patch-Based Techniques in Medical Imaging 92–99 (Springer, Cham, 2016).
14. Dhollander, T., Raffelt, D. & Connelly, A. Unsupervised 3-tissue response function estimation from single-shell or multi-shell diffusion MR data without a co-registered T1 image. Proceedings of the International Society for Magnetic Resonance in Medicine Workshop on Breaking the Barriers of Diffusion MRI 5, (2016).
15. Fazekas, F., Chawluk, J. B., Alavi, A., Hurtig, H. I. & Zimmerman, R. A. MR signal abnormalities at 1.5 T in Alzheimer’s dementia and normal aging. American journal of roentgenology 149, 351–356 (1987).
16. Hamilton, N. ggtern: An Extension to ‘ggplot2’, for the Creation of Ternary Diagrams. R package version 2.2.2. https://CRAN.R-project.org/package=ggtern (2017).
Figures