0127
Two Dimensional COSY on Biopsy Distinguishes Indolent From Aggressive Kidney Masses1Translational Research Institute, Brisbane, Australia, 2Faculty of Medicine, The University of Queensland, Brisbane, Australia, 3The University of Queensland, Brisbane, Australia, 4Department of Urology, Princess Alexandra Hospital, Brisbane, Australia, 5Aquesta Uropathology, Brisbane, Australia, 6Department of Radiology, Princess Alexandra Hospital, Brisbane, Australia
Synopsis
Kidney tumour metabolism may have chemical signatures that distinguish indolent from aggressive small renal masses (SRM). Indolent or benign SRM could be managed conservatively. Here we have used two dimensional (2D) COrrelation SpectroscopY (COSY) on nephrectomy samples to assign and measure metabolite and lipid resonances. High level bioinformatics analysis was then applied. We report metabolic chemical signatures that can be used to distinguish histologically-diagnosed kidney tumour subtypes.
Introduction
Traditional imaging modalities lack the ability to distinguish between aggressive life threatening small renal masses (SRM) from those indolent or benign SRM that could be managed conservatively. Currently, in Queensland, more than 200 patients undergo surgery for small renal masses (SRM) each year and we have shown that approximately 25% of these procedures are unnecessary or avoidable (1). The development of non-invasive molecular imaging technologies for SRM is likely to provide diagnostic accuracy sufficient to alter clinical practise, reducing surgical overtreatment and associated cost as well as improving patient outcomes. This study aims to build upon previous pilot study data (2) using a new increased patient cohort. Using two dimensional (2D) COrrelation SpectroscopY (COSY), we have now identified 128 renal metabolite and lipid resonances and have employed high level bioinformatics analysis in order to evaluate whether histologically-diagnosed tumour subtype classification can be replicated by clustering of the metabolite resonances identified via 2D COSY.Methods
Institutional Ethics approval: Metro South Human Research Ethics Committee (HREC/16/QPAH/353).
Patients: Consenting patients aged ≥18 years who were managed surgically at the Princess Alexandra Hospital for renal tumours of any clinical stage.
Biopsy material: Seventy-eight renal tissue samples, including tumour and non-tumour tissues, were collected immediately post nephrectomy, placed in D2O Phosphate-buffered saline (D2O PBS), snap frozen in liquid nitrogen and stored at -80°C. Histopathology was used as gold standard diagnosis. Prior to MRS analysis samples were thawed and washed once in D2O PBS.
Data Acquisition: 2D COSY spectra were acquired on an Agilent Technologies MR400-DD2 NMR Spectrometer, running VnmrJ 4.2.
Data Analysis: Data was processed and analysed using FelixNMR 2007 (FelixNMR Inc, San Diego, USA). Cross and diagonal peaks of 128 metabolite resonances assigned and peak volumes measured. The choline diagonal peak at 3.2ppm was the internal chemical shift reference. Metabolite peak volumes were normalized to tissue weight.
Data were log2 transformed and quantitative data visualization and multivariate analyses conducted using The Genomics Data Miner (GMine)(3). Canonical correlation analysis (CCA), was used to identify variation in the metabolite resonances that can be explained by variation in histopathology. The CCA also assesses the statistical significance of the correlation and provides a P value.
Results
Histopathology of renal tissue samples indicated 31 clear cell renal cell carcinoma (RCC) (highest likelihood for aggressive trajectory), 7 chromophobe RCC, 3 papillary type 1 RCC (moderate likelihood for aggressive trajectory), 1 multilocular cystic renal neoplasm of low malignant potential, 1 benign oncocytoma (lowest likelihood for aggressive trajectory), and 34 non-neoplastic kidney cortex samples.
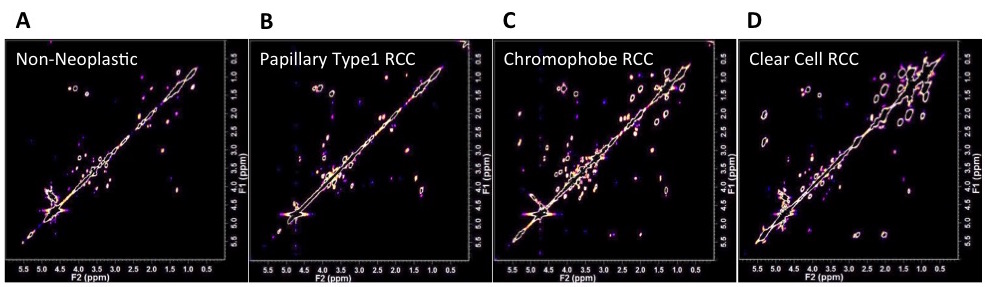
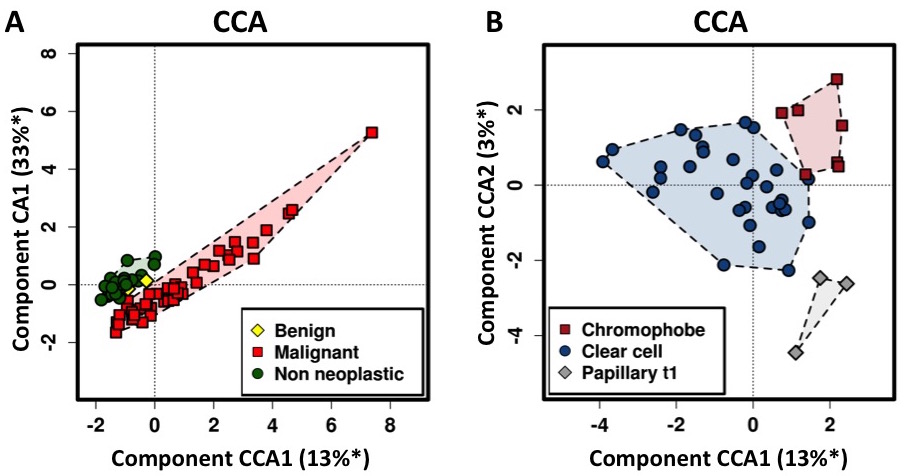
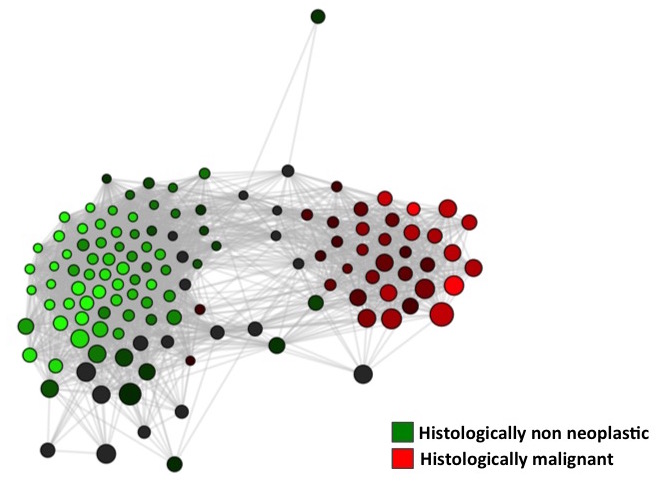
Representative 2D COSY are shown in Figure 1 from non-neoplastic kidney cortex (A), papillary type1 RCC (B), chromophobe RCC (C) and clear cell RCC (D). Principle component analysis showed clusters based on tissue type and in Figure 2 canonical correlation analysis (CCA), which seeks to identify correlation between sets of data, was able to demonstrate a statically significant clustering between non-neoplastic, benign and malignant tissue (p=0.002) seen in Figure 2A. Moreover the method could distinguish significant differences among clear cell RCC, chromophobe RCC and papillary type 1 RCC (p=0.002) seen in Figure 2B. Network analysis of metabolite resonances (Figure 3) showed a clear clustering of those metabolites that are able to distinguish non-neoplastic tissue from malignant tissue.
Forward stepwise linear regression has identified resonances with a strong correlations to: clear cell RCC, with cholesterol, glutamate, NAAG, L-isoleucine, acetyl-L-lysine and diallylic lipid cross peak D; to papillary type 1 RCC with 1.56/2.23ppm (biotin or pipecolic acid) and 7.39/7.38ppm (phenylalanine or thymine); and to chromophobe RCC with 4.16/3.58ppm (threonine or allose) and taurine.
Discussion and Conclusions
This study has shown that renal tumour metabolism has chemical signatures that distinguish histologically diagnosed kidney lesion subtypes. The difference recorded for each of these categories will be used to guide the development of in vivo MRS protocols to pre-operatively distinguish malignant potentially life threatening SRM from indolent or benign lesions that can be treated conservatively.Acknowledgements
The authors would like to thank Advance Queensland for funding of this project.References
1. Joshi, A., Pridgeon S., Wilson I., Ng K., Wood S. Estimation of preventable renal surgery in a contemporary surgical series of resected small renal masses (SRMs), BJU International, 2015; 115, 47.
2. Urquhart, A; Del Vecchio, S; Ng, K; Samaratunga, H; Galloway, G; Malycha, P; Wood, S; Gobe, G; Mountford, C. Kidney cancer subtypes, identified by two dimensional MR Spectroscopy, may eventually allow treatment of clinically distinct diseases, ISMRM, 2017. Poster 2971.
3. The Genomics Data Miner (GMine) http://cgenome.net/gmine/
Figures