0126
Human Hyperpolarized 13C MR of Liver and Bone Metastases using both EPSI and EPI Acquisitions1Department of Radiology and Biomedical Imaging, UCSF, San Francisco, CA, United States, 2UC Berkeley - UCSF Graduate Program in Bioengineering, UCSF, San Francisco, CA, United States, 3Department of Medicine, UCSF, San Francisco, CA, United States
Synopsis
Hyperpolarized 13C metabolic imaging is a powerful technique with proven safety and efficacy for human studies. The goal of this project was to investigate pyruvate metabolism in patients with prostate and breast cancer metastases with both echo-planar spectroscopic imaging (EPSI) and the echo-planar imaging (EPI) acquisitions in the same exam. The results revealed similarly valuable information of up-regulated LDH-catalyzed conversion of pyruvate to lactate with some advantages and differences between the two acquisition methods.
Purpose
Hyperpolarized 13C imaging is an emerging technology that has shown great promise for oncology applications, with multiple different acquisition methods proposed and demonstrated in vivo1,2. Among these methods, a distinct difference lies in how the spectral information is gathered, either directly encoded by gradients as with echoplanar spectroscopic imaging (EPSI), or selectively excited by radiofrequency (RF) pulses, as with metabolite-specific imaging with a single-shot readout3. The goal of this study was to compare and contrast the two common acquisitions, EPSI and metabolite-specific imaging using an echoplanar imaging (EPI) approach in breast and prostate cancer patients with liver or bone metastases.Methods
Patients were imaged in a 3.0T MRI using a proton clinical protocol and two 13C sequences, acquired with custom-built 13C surface transceiver coil4. [1-13C]pyruvic acid was polarized in the SPINLab system to 35.4±4% polarization. The two 13C injections were separated by typically 30-45 minutes.
2D dynamic EPSI data were acquired from an axial slice with these features: multiband RF excitation with 10° on pyruvate and 20° on lactate, 3s temporal resolution with 20 timeframes, and a symmetric EPSI gradient1. In-plane resolution and slice thickness varied depending on metastases size, ranging from 12x12x15mm3 to 20x20x20mm3. Dynamic spectra were summed in time, and the real component of the summed spectra was used for analysis.
Imaging data were acquired with a metabolite-specific imaging approach3. Metabolites were independently excited with a singleband spectral-spatial RF pulse (passband FWHM=130 Hz, stopband=868 Hz) and encoded with a single-shot echoplanar readout2. Pyruvate, lactate, and alanine were independently excited with a TR of 100ms followed by a 2.7s delay to match the temporal resolution of EPSI. The flip angles for pyruvate (38°) and metabolites (68°) were chosen to have equal RF utilization per timeframe, and the spatial resolution and slice thickness was identical to the EPSI experiments. Data were reconstructed in Matlab using the Orchestra reconstruction toolbox (GE Healthcare)2.
Results
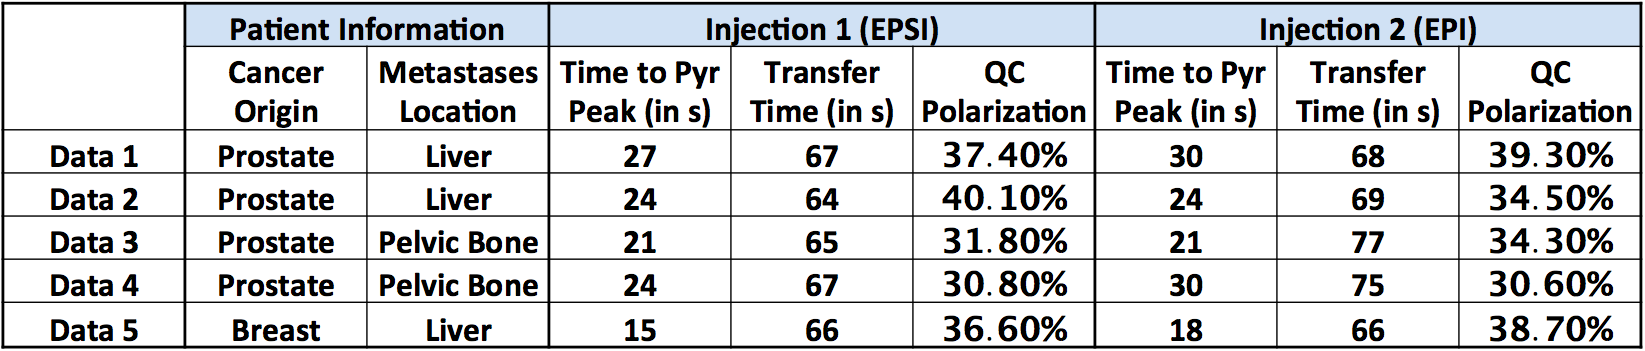
5 patients were included in this study, and information regarding polarization, transfer time, and time to pyruvate peak is listed in Table 1. The quality control (QC) system calculated similar polarization levels, and no substantial difference was observed in the pyruvate peak time.
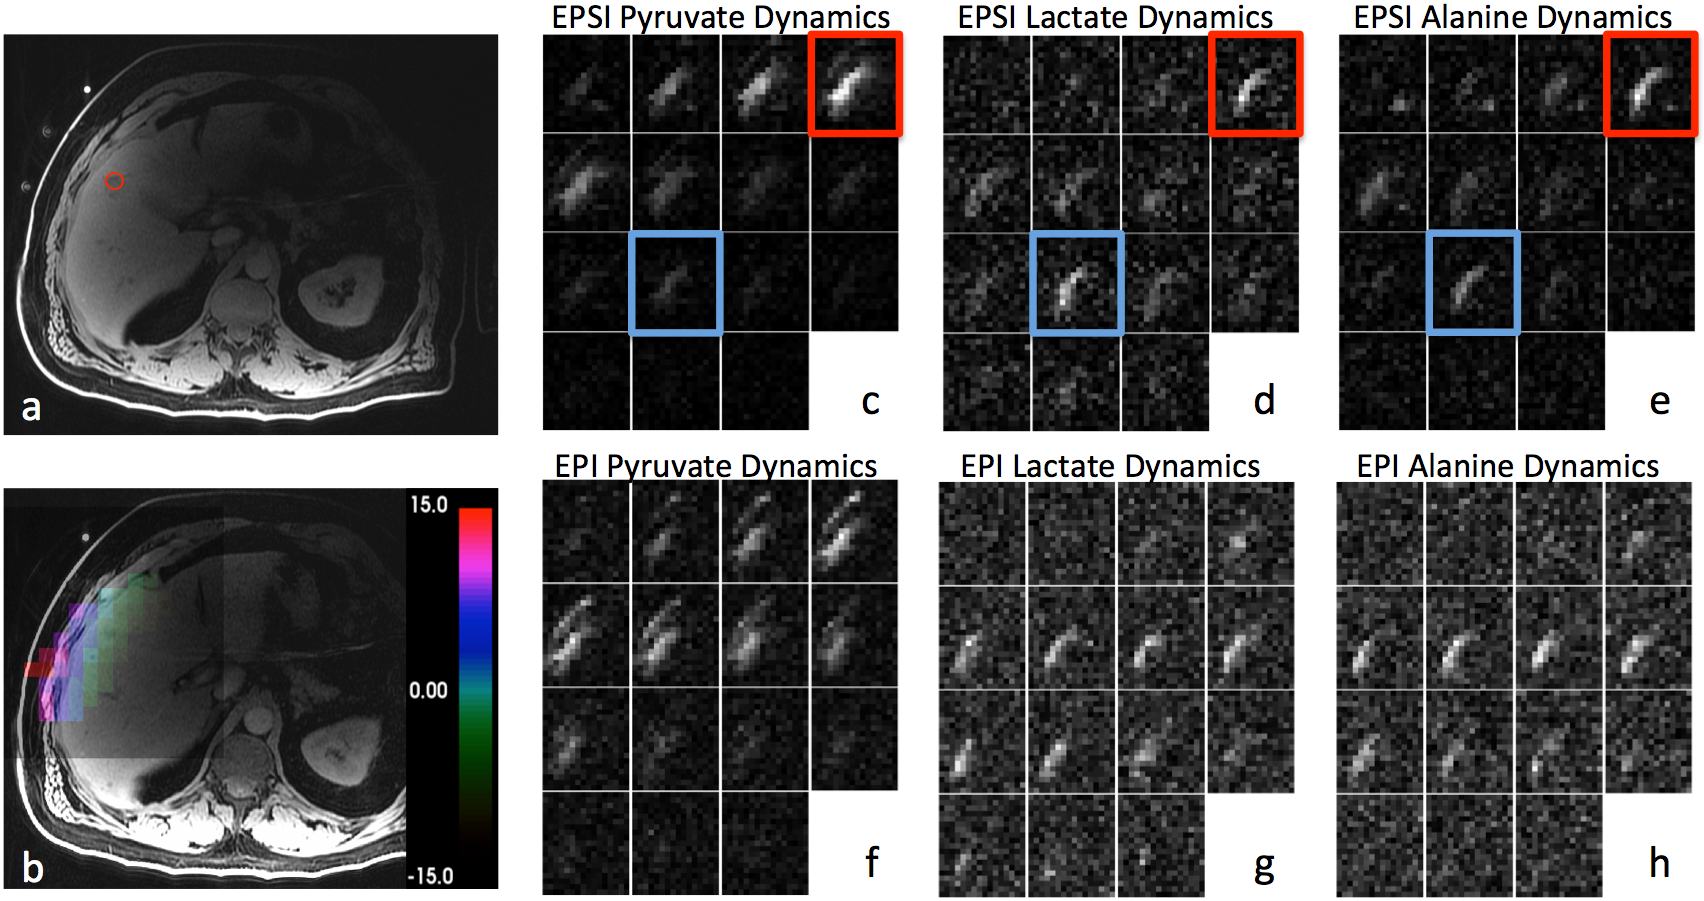
After spectral processing, the EPSI
data could be displayed similar to EPI as metabolite dynamic images. Figure 1
demonstrated a representative dataset, including the T1-weighted image, a
coarse ΔB0
map derived from EPSI pyruvate chemical shift variation, and dynamic images
from both acquisitions. The outlined red timeframes demonstrated a spectral
contamination artifact of elevated baseline due to high pyruvate signal,
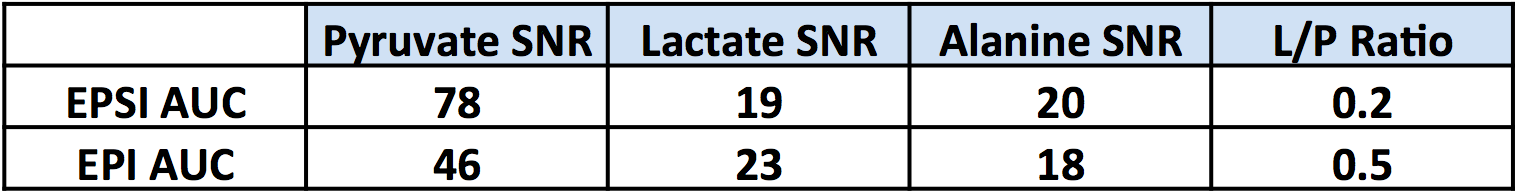
potentially resulting in AUC ratio inaccuracy. The quantitative analysis included
AUC SNR and lactate-to-pyruvate ratio, as shown in Table 2. Overall, downstream
metabolites presented similar SNR while the injected pyruvate SNR was about 2-fold
different, resulting in a similar difference in L/P ratio.
Discussion and Conclusions
Both EPI and EPSI acquisitions detected up-regulated pyruvate to lactate conversion in the metastases; providing a valuable biomarker of cancer metabolism. As qualitatively demonstrated in Figure 1, both methods revealed similar contrast and signal evolution. A two-fold difference was observed in L/P ratio, possibly due to B1 inhomogeneity. The apparent flip angle was chosen based on theoretical calculations assuming a homogeneous B1, but this assumption is not valid for the figure-8 coil. Therefore, caution should be made when determining flip angle if a surface coil was used. Similarly, a coil setup with a homogeneous B1+ field would likely alleviate the difference between the two methods. With the coarse ΔB0 map provide by the EPSI approach, B0 variation within the region of interest was tolerable by the EPI excitation bandwidth, thus excluded B0 from the potential cause of difference.
Overall, the full-spectral encoding nature of the EPSI method provided valuable chemical shift information, enabling the generation of a ΔB0 map to retrospectively assess and validate the RF excitation accuracy. However, it also required a substantially longer acquisition time as each timeframe took 2s. The single-shot EPI only took 0.3s for each timeframe, allowing volumetric acquisition without an impact on temporal resolution. This acquisition time difference also revealed that EPI is more robust against motion. Figure 1(d)-(e) demonstrated this motion artifact with EPSI data, the outlined blue timeframe showed an increased metabolite intensity corresponding to the end of a breath hold, while the EPI data did not present such artifact. The EPI method, however, required spectral-spatial pulses for chemical shift selection, which is more sensitive to operator error and off-resonance.
In conclusion, patients with liver and bone metastases were successfully evaluated by 13C HP MR and both spectral and imaging approaches provided valuable metabolic information. The metabolites ratio differences revealed the sensitivity of excitation parameters, suggesting the importance of accurate flip angle assessment.
Acknowledgements
This work was supported by NIH grants R01CA183071 and P41EB013598.References
[1] Nelson, Sarah J., et al. "Metabolic imaging of patients with prostate cancer using hyperpolarized [1-13C] pyruvate." Science translational medicine 5.198 (2013): 198ra108-198ra108.
[2] Gordon, Jeremy W., Daniel B. Vigneron, and Peder EZ Larson. "Development of a symmetric echo planar imaging framework for clinical translation of rapid dynamic hyperpolarized 13C imaging." Magnetic resonance in medicine 77.2 (2017): 826-832.
[3] Cunningham, Charles H., et al. "Pulse sequence for dynamic volumetric imaging of hyperpolarized metabolic products." Journal of magnetic resonance 193.1 (2008): 139-146.
[4] Zhu, Z., et al. "Hyperpolarized 13C Dynamic Breath-held Molecular Imaging to Detect Targeted Therapy Response in Patients with Liver Metastases. " Proc. Intl. Soc. Mag. Reson. Med. 1115 (2017).
Figures