0122
Evaluating intratumoral necrosis in gliomas: a multi-modal study of acidosis, cellularity, and vascularity1Radiology & Biomedical Imaging, Yale University, New Haven, CT, United States, 2Biomedical Engineering, Yale University, New Haven, CT, United States
Synopsis
The malignant form of human glioblastoma multiforme (GBM) is linked to intratumoral necrosis. Since novel immunotherapies are being sought to treat these patients, non-invasively characterizing intratumoral necrosis in gliomas is clinically important. Here, we describe a multi-modal MRI study of acidity, cellularity, and vascularity in two glioma models that feature comparable necrosis and proliferation, but differ in vascular markers. The intratumoral necrotic core (INC) and intratumoral surrounding tissue (IST) had distinct slow and fast Gd-enhanced profiles, respectively. Despite immunohistochemical/histopathological differences, these GBM models show similar profiles of INC-IST gradients for acidity and cellularity, but not for vascularity.
Background
Glioblastoma multiforme (GBM) is the most common primary tumor in the central nervous system, and is characterized by a very poor prognosis for patients. In particular, the malignant form of GBM has been associated with intratumoral necrosis, where novel immunotherapies are being sought to treat these vulnerable patients [1]. Therefore, to non-invasively characterize the intratumoral necrotic core (INC) from the intratumoral surrounding tissue (IST) in gliomas is crucial. For this purpose, MRI is a likely method for clinical translation given its wide availability, minimal invasiveness, and lack of ionizing radiation. Advanced MRI methods are now available for selective imaging of acidity, cellularity, and vascularity in cancer. Tissue cellularity is reflected by the apparent diffusion coefficient (ADC) measured by diffusion-weighted MRI [2]. Various vascular parameters (e.g., permeability-surface area or PS, plasma volume fraction or vp) can be measured from MRI profiles of dynamic contrast enhancement (DCE) with Gd3+-agents [3]. Similarly, extracellular acidosis (pHe) is imaged with Biosensor Imaging of Redundant Deviation in Shifts (BIRDS) using Tm3+-agents [4]. We used multi-modal MRI measures of acidity, cellularity, and vascularity to investigate the profiles of INC-IST gradients. We used two human-derived cell lines - U87 and U251 - that feature comparable intratumoral necrosis (H&E) and tumor proliferation (Ki-67), but different angiogenesis localization (core: U87 > U251; peripheral: U251 > U87), tumor suppression (mutated p53: U251 > U87), and hypoxia induction factor (HIF-1α: U251 > U87) [5].Methods
A total of 14 female athymic rats were imaged between 14 and 45 days after intraparenchymal inoculation of either U251 (n = 6) or U87 (n = 8) tumor cells. Images were acquired using a 11.74T spectrometer with Bruker console, while animals were anesthetized using 1.5% isoflurane in oxygen and their body temperature maintained at 35-37ºC using a flowing warm water pad. First, tumor cellularity was measured using DWI with b-values of 0, 300, 700, 1000, 2000 and 3000 s/mm2, with the ADC fitted and used as outcome measure. DCE-MRI consisted of a spoiled-gradient echo acquisition (with flip angle of 15º, TR of 39ms and 2.5/5ms dual-echo for T2* correction) every 5 seconds, starting 2 minutes before a bolus i.v. injection of 0.25mmol/kg gadobutrol and lasting for a total of 22 minutes. Dynamic concentration curves were calibrated using intrinsic T1 (from pre-injection RARE variable-TR sequence), r1 relaxivity of gadobutrol previously measured in vitro, and T2* correction from the second echo acquisition. Pharmacokinetic modelling of concentration curves was performed using the sagittal sinus as input function, with both a two-compartment exchange model (assuming bilateral contrast exchange between plasma and tissue) and a tissue-uptake model (assuming a mostly irreversible exchange from plasma to tissue) [6]. Outcome measures of permeability and vascularity were used from the model with the best fit. Lastly, acidosis was assessed using BIRDS: following i.v. infusion of probenecid (to inhibit renal clearance) and TmDOTP5-. Voxel-level chemical shifts of TmDOTP5- H2, H3 and H6 protons were used to estimate pHe [7].Results
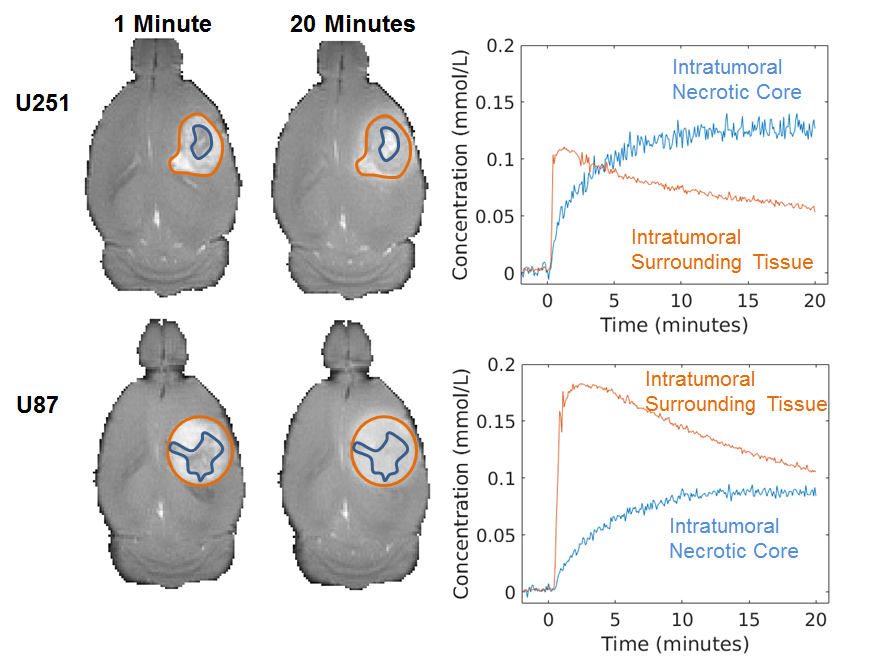
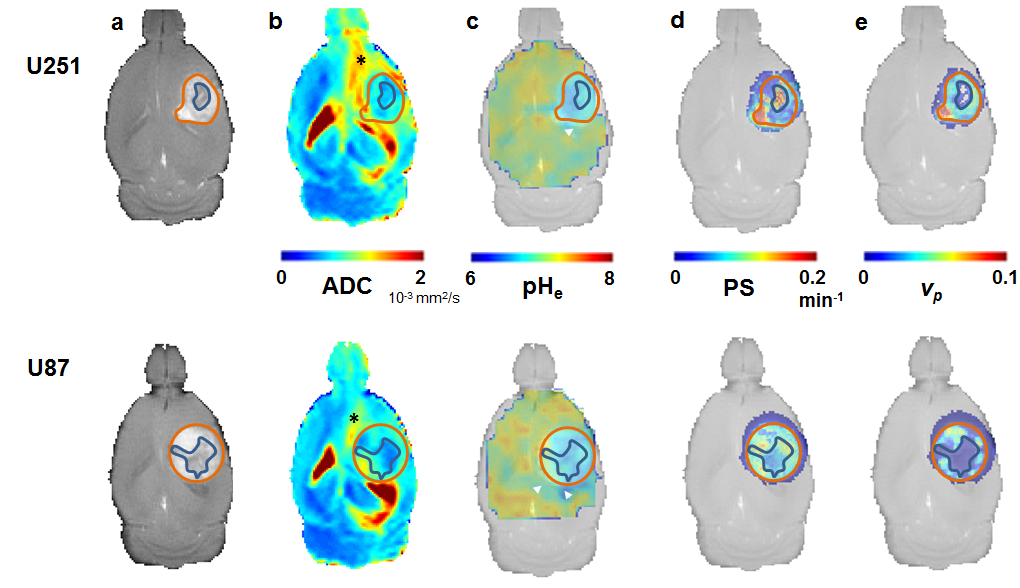
A subset of tumors from both U251 and U87 lines exhibited a significant heterogeneity in Gd3+ enhancement profiles. Clusters were defined for INC (slow and irreversible uptake) and IST (faster reversible uptake; see Figure 1) and used as regions of interest for further analyses. Representative example of U251 and U87 multimodal parametric maps are shown in Figure 2. Globally, both cell lines showed lower intratumoral (INC and IST) ADC compared to the surrounding brain tissue. Similarly, intratumoral pHe was globally lower compared to the extratumoral tissue although some larger tumors had abnormal acidosis extending beyond the tumor boundary (see Figure 2c). U251 vascular permeability was highly heterogeneous in IST, and was higher in INC. Conversely, U87 vascular permeability was more homogeneous, with the exception of INC, which had lower contrast agent uptake. Lastly, vp measurements showed higher vascularization in U251 compared to U87, with the exception of the INC which had little to no vascularization for both cell lines. Figure 3 details the group-level differences for all parameters.Discussion
Tumor vascularization gradient was notably cell line-dependent, and differed in necrotic areas. DCE-driven segmenting of INC and IST shows that despite cellular/molecular differences between U87 and U251, these GBM models show similar INC-IST gradients for acidity and cellularity. These preliminary results suggest that multi-parametric measurements of acidity, cellularity, and vascularity can provide reproducible INC-IST gradients for these gliomas, with comparable necrotic core in relation to its surrounding tissue.Acknowledgements
Supported by NIH (R01EB-011968, R01CA-140102, P30NS-052519) and FRQS.References
1. Oshiro, S., et al., Evaluation of intratumoral administration of tumor necrosis factor-alpha in patients with malignant glioma. Anticancer Res, 2006. 26(6A): p. 4027-32.
2. Sugahara, T., et al., Usefulness of diffusion-weighted MRI with echo-planar technique in the evaluation of cellularity in gliomas. J Magn Reson Imaging, 1999. 9(1): p. 53-60.
3. Rose, C.J., et al., Quantifying spatial heterogeneity in dynamic contrast-enhanced MRI parameter maps. Magn Reson Med, 2009. 62(2): p. 488-99.
4. Coman, D., et al., Brain temperature and pH measured by (1)H chemical shift imaging of a thulium agent. NMR Biomed, 2009. 22(2): p. 229-39.
5. Radaelli, E., et al., Immunohistopathological and neuroimaging characterization of murine orthotopic xenograft models of glioblastoma multiforme recapitulating the most salient features of human disease. Histol Histopathol, 2009. 24(7): p. 879-91.
6. Sourbron, S.P. and D.L. Buckley, Classic models for dynamic contrast-enhanced MRI. NMR Biomed, 2013. 26(8): p. 1004-27.
7. Huang, Y., et al., Towards longitudinal mapping of extracellular pH in gliomas. NMR Biomed, 2016. 29(10): p. 1364-72.
Figures
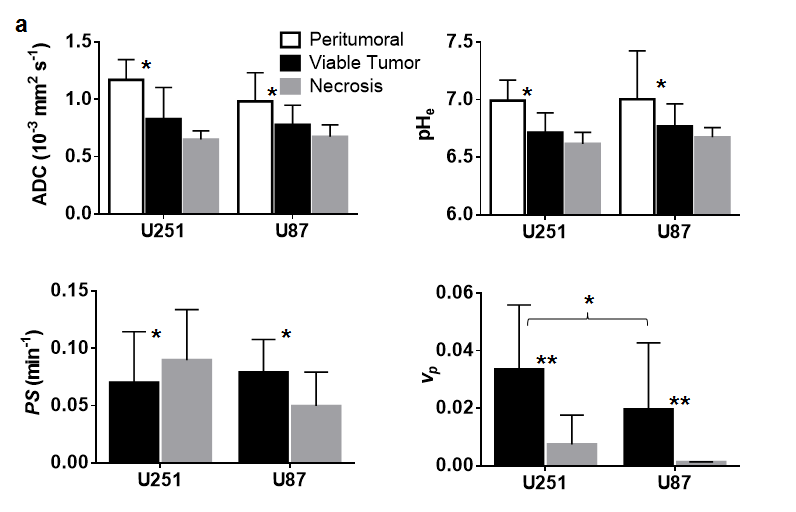
Group-level summary statistics of outcome measures by tumor cell line and region of interests (white: peritumoral area; black: viable tumor; gray: suspected necrosis).
* p < 0.01 ** p < 0.001