0121
Differentiation between vasogenic edema and infiltrative tumor in patients with high grade gliomas using texture patch based analysis1Functional Brain Center, Tel Aviv Sourasky Medical Center, Tel Aviv, Israel, 2Sackler Faculty of Medicine, Tel Aviv University, Tel Aviv, Israel, 3Department of Chemical Physics, Weizmann Institute, Rehovot, Israel, 4Neuro-Oncology Service, Tel Aviv Sourasky Medical Center, Tel Aviv, Israel, 5Sagol School of Neuroscience, Tel Aviv University, Tel Aviv, Israel
Synopsis
This study proposes a radiomics patch-based analysis, based on conventional MRI, for classification of the non-enhancing lesion area into vasogenic edema and infiltrative tumor in patients with high-grade-gliomas. 179 MRI scans obtained from 102 patients were included: 67 patients with high-grade-gliomas and 35 patients with brain-metastases. A total of 225 histogram and gray-level-co-occurrence-matrix based features were extracted from the non-enhancing lesion. Classification was performed using various machine-learning classifiers. The best results were obtained using Linear support-vector-machine, with accuracy=87%, sensitivity=86%, and specificity=89%. Preliminary results in patients treated with bevacizumab demonstrate the clinical potential of this method to improve therapy response assessment.
INTRODUCTION
Peritumoral edema associated with high grade gliomas (HGG) is characterized by extensive infiltration of tumor cells. Using the current radiological criteria, differentiation between tumoral and non-tumoral components within the non-enhancing lesion remains challenging1. This study proposes a radiomics patch-based analysis, based on conventional MRI, for the classification of the non-enhancing lesion area in patients with HGG.METHODS
Patients: A total of 179 MRI scans obtained from 102 patients were included: 135 scans from 67 patients with HGG (with 15 patients scanned before and after bevacizumab therapy), and 44 scans obtained from 35 patients with brain metastasis.
MRI Protocol: Scans were performed on 3.0T MRI systems and included pre&post-contrast agent T1-weighted-imaging (WI), T2WI, FLAIR, diffusion-tensor-imaging (DTI); and dynamic-contrast-enhanced (DCE)-MRI which was used only to evaluate the results.
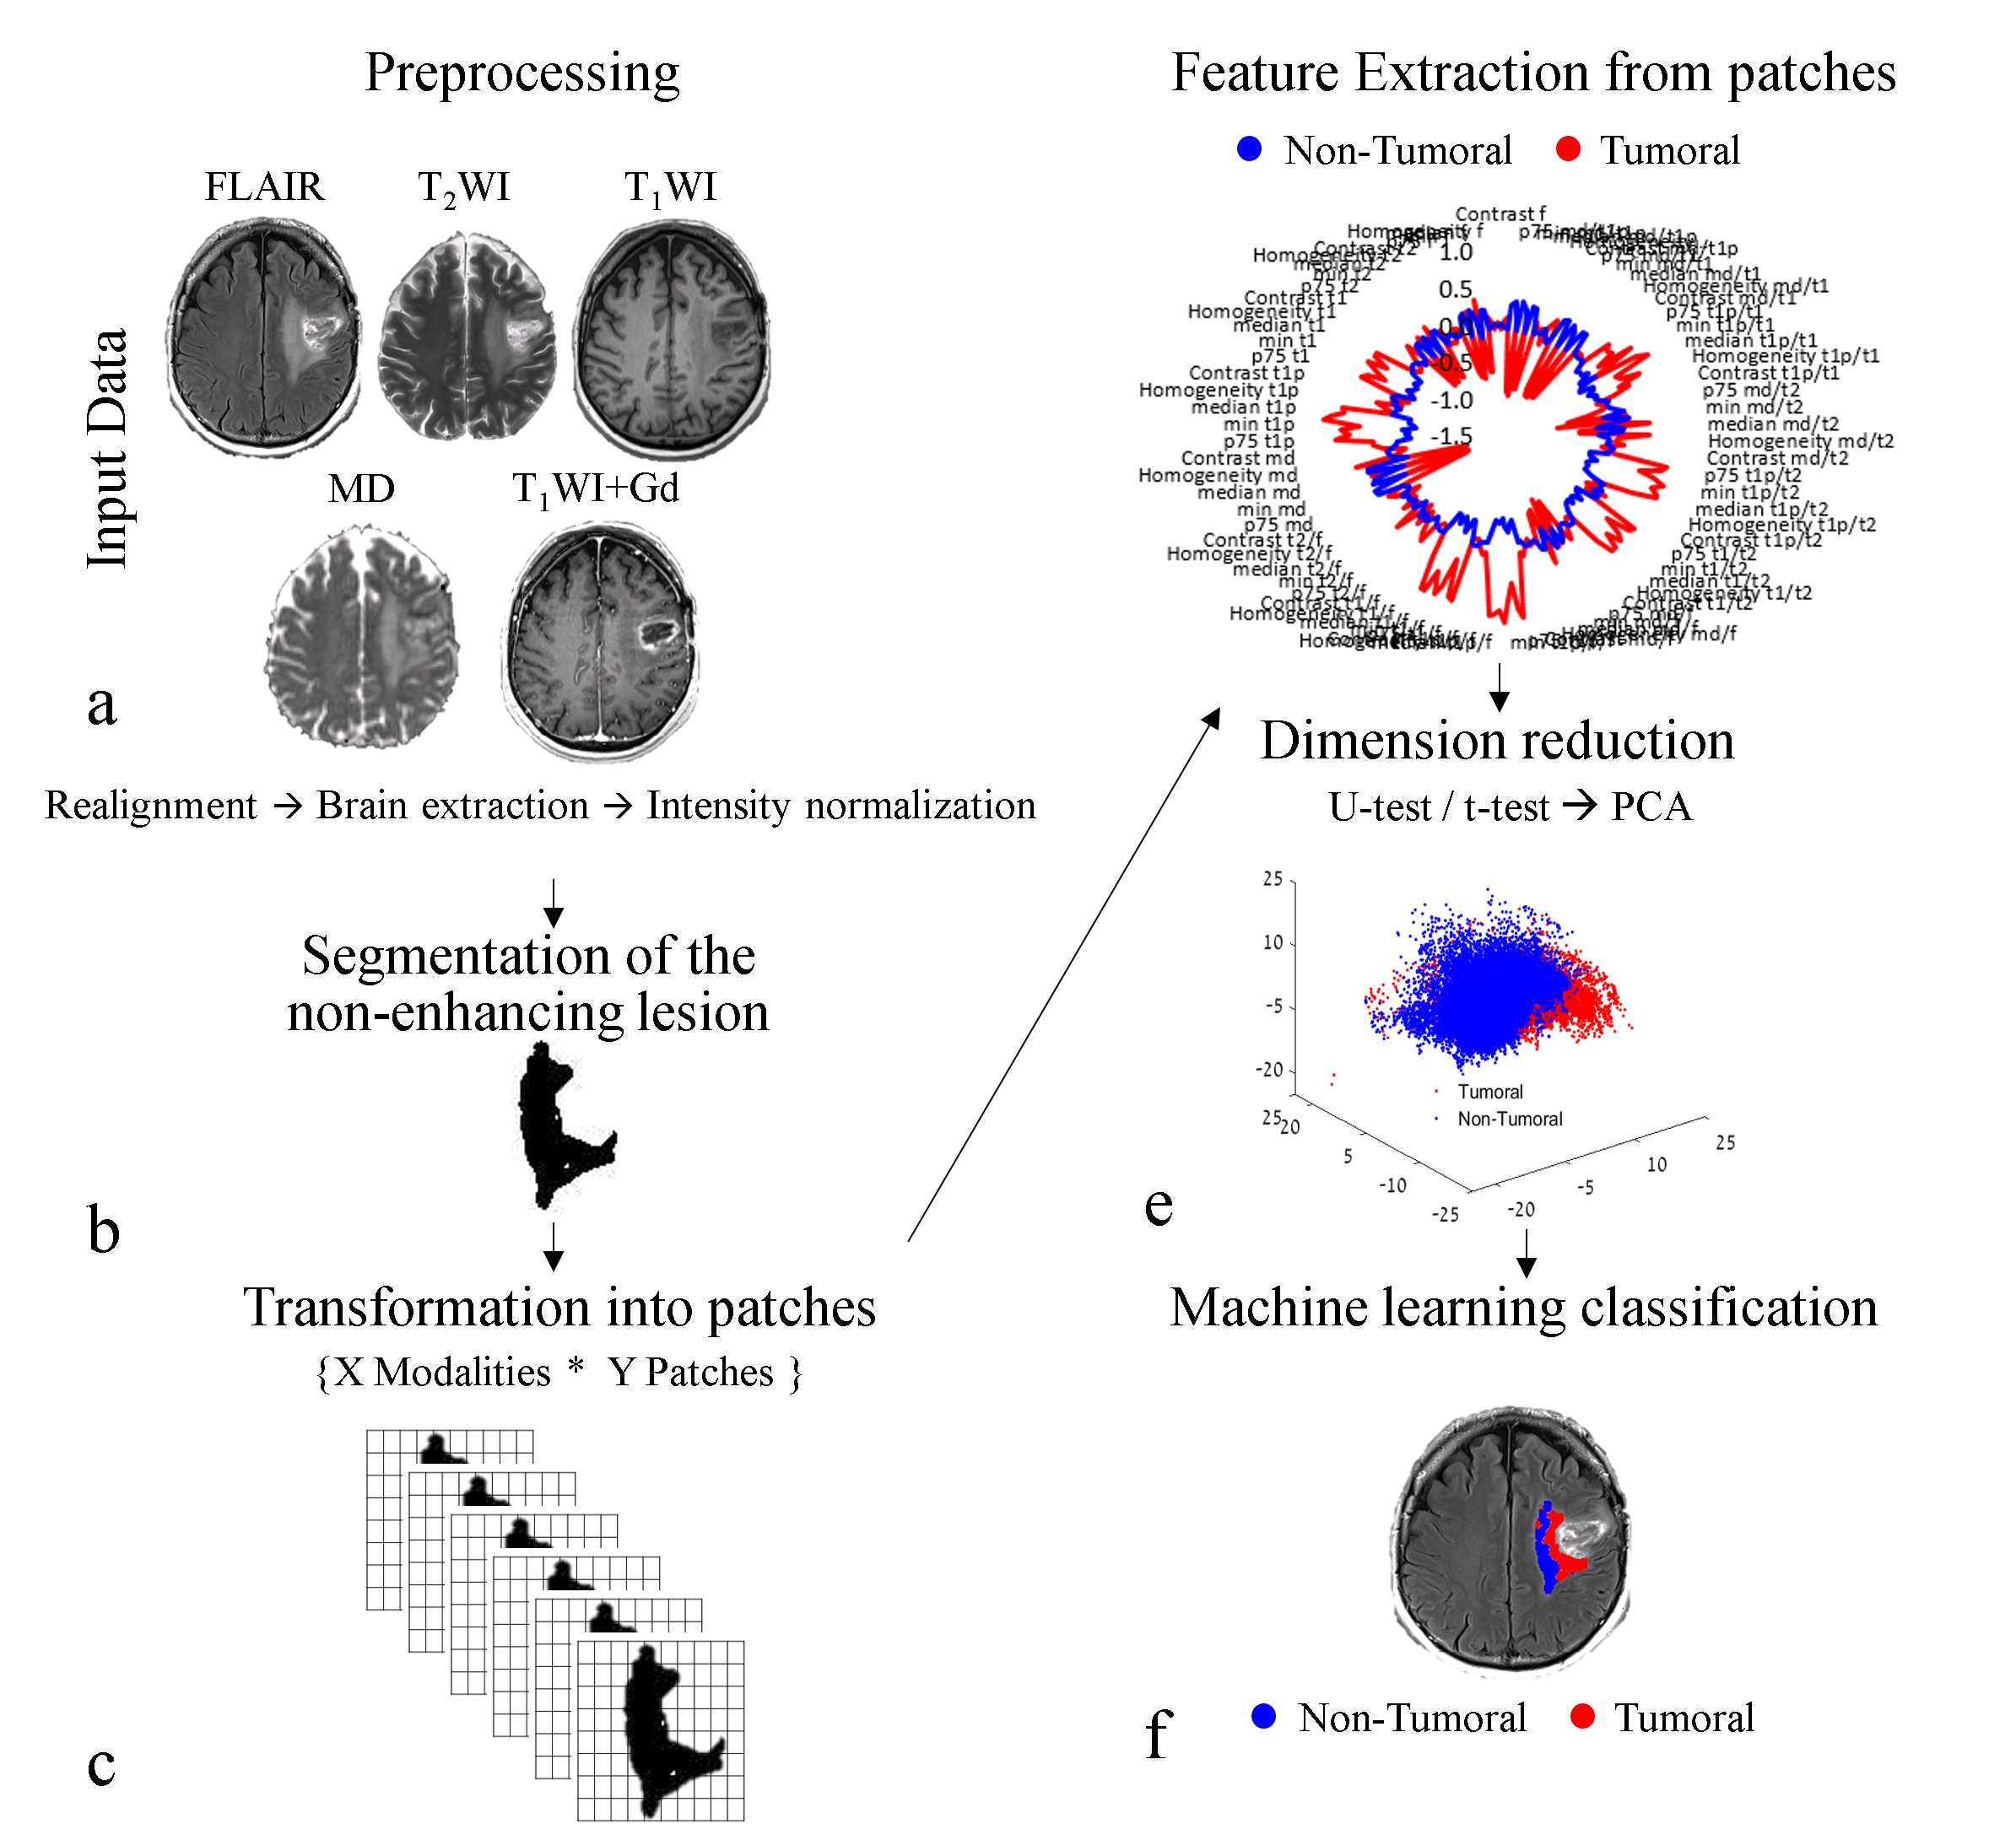
Analysis pipeline is illustrated in Figure 1. Analysis was performed using MATLAB, FSL, and DUSTER2 and included:
Preprocessing: Included coregistration of all images to the FLAIR images; skull stripping; calculation of the mean-diffusivity (MD) map from the DTI data and of plasma-volume (vp) and volume-transfer-constant (ktrans) maps from the DCE data; and intensity normalization of all images relative to normal-appearing white-matter (NAWM) VOI.
Segmentation of the enhanced and non-enhanced lesion areas: was performed using AnalyzeDirect software and based on post-contrast T1WI and FLAIR images. In each patient, five slices located in the center of the lesion were manually defined. The target area for classification was set as the mask of the FLAIR hyperintense lesion excluding the enhanced lesion areas.
Transformation into patches: The target area for classification was partitioned into 5*5 voxel patches, extracted in a sliding window manner, with jumps of [1,1] voxels.
Feature Extraction: Fifteen features were calculated for each patch for the five modalities and 10 inter-modalities. The features included first-order statistical features: mean, median, 25th, 75th percentiles, standard deviation, maximum, minimum, variance, kurtosis, skewness, and gray level co-occurrence matrix features3: contrast, correlation, energy, and homogeneity. These resulted in a total of 225 features [15 modalities&inter-modalities * 15 features].
Data Labeling: Tumoral VOIs were defined at the peritumoral area in patients with HGG who were diagnosed with progressive disease; non-tumoral VOIs were defined in patients with brain metastasis, in whom the hyperintensity FLAIR signal is considered pure vasogenic edema4,5.
Classification: Feature selection was performed based on a statistical tests (Mann-Whitney/t-test), and principal-component-analysis (PCA), classification of the patches was performed using various machine learning classifiers. 20 classifiers were tested including various support-vector-machines (SVM), k-nearest-neighbor (kNN) based, decision-trees, and ensemble classifiers.
Evaluation of the classification results: A validation set of 20% of the data was left aside for final validation. The classifiers were trained on a test set: 80% of the labeled data and results were validated in a patient-wise 5-fold manner. Sensitivity, specificity and accuracy were calculated for the 20 classifiers. The classifier that produced the best results (on accuracy) was then trained on the entire test-set and evaluated on the validation set. Mean values of DCE-based vp and ktrans parameters were calculated to assess differences in the vascular characteristics between components.
RESULTS
Classification results: 212 features showed significant differences (p<0.05) between the tumoral and non-tumoral components. Following PCA, 66 components were found to explain 95% of the variance, and were used for classification. The best classification results were obtained using Linear SVM classifier with accuracy=87%, sensitivity=86% and sensitivity =89%. Using the Linear SVM classifier of the validation set resulted in accuracy=91%, sensitivity=91%, and specificity=91%.
Vascular properties of the obtained components: Significant differences were determined between the tumoral and the non-tumoral components and between the tumoral component and the NAWM both for vp and ktrans parameters using one-way ANOVA (p<0.0001).
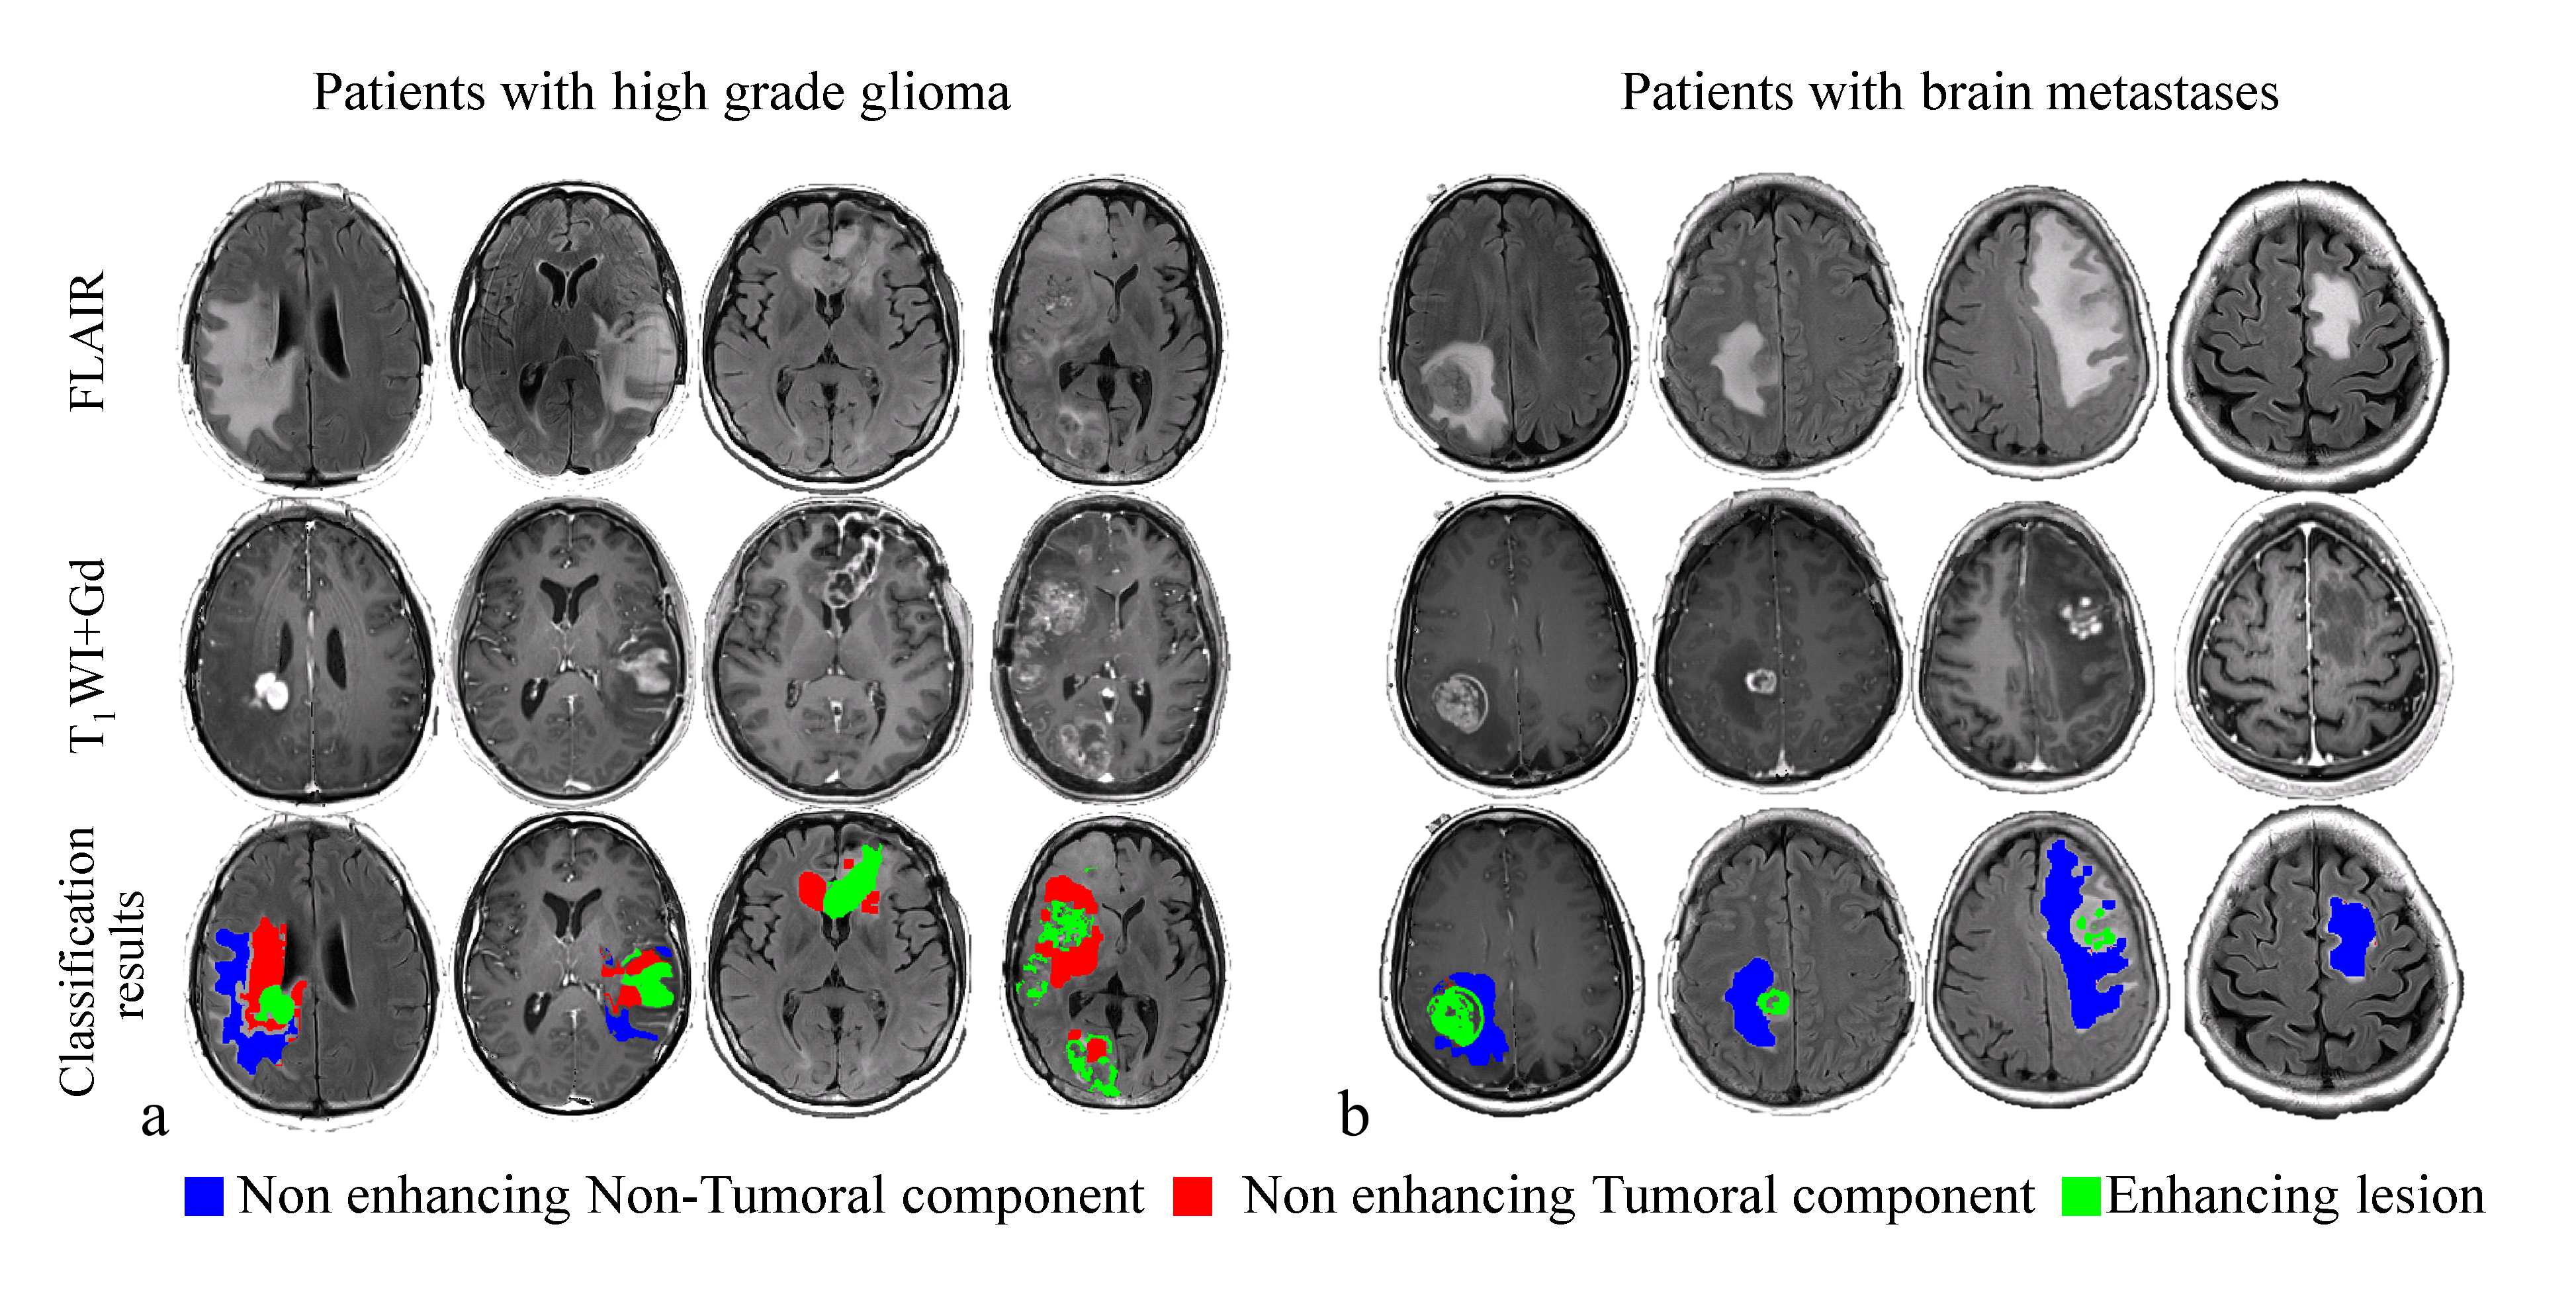
Results in patients: Figure 2 shows classification results obtained in 4 patients with HGG and 4 patients with brain metastases. As expected, in patients with brain metastasis the entire non-enhancing lesion area was classified as non-tumoral component, whereas in patients with HGG, a mixed pattern was obtained, with tumoral components present adjacent to the enhanced lesion area.
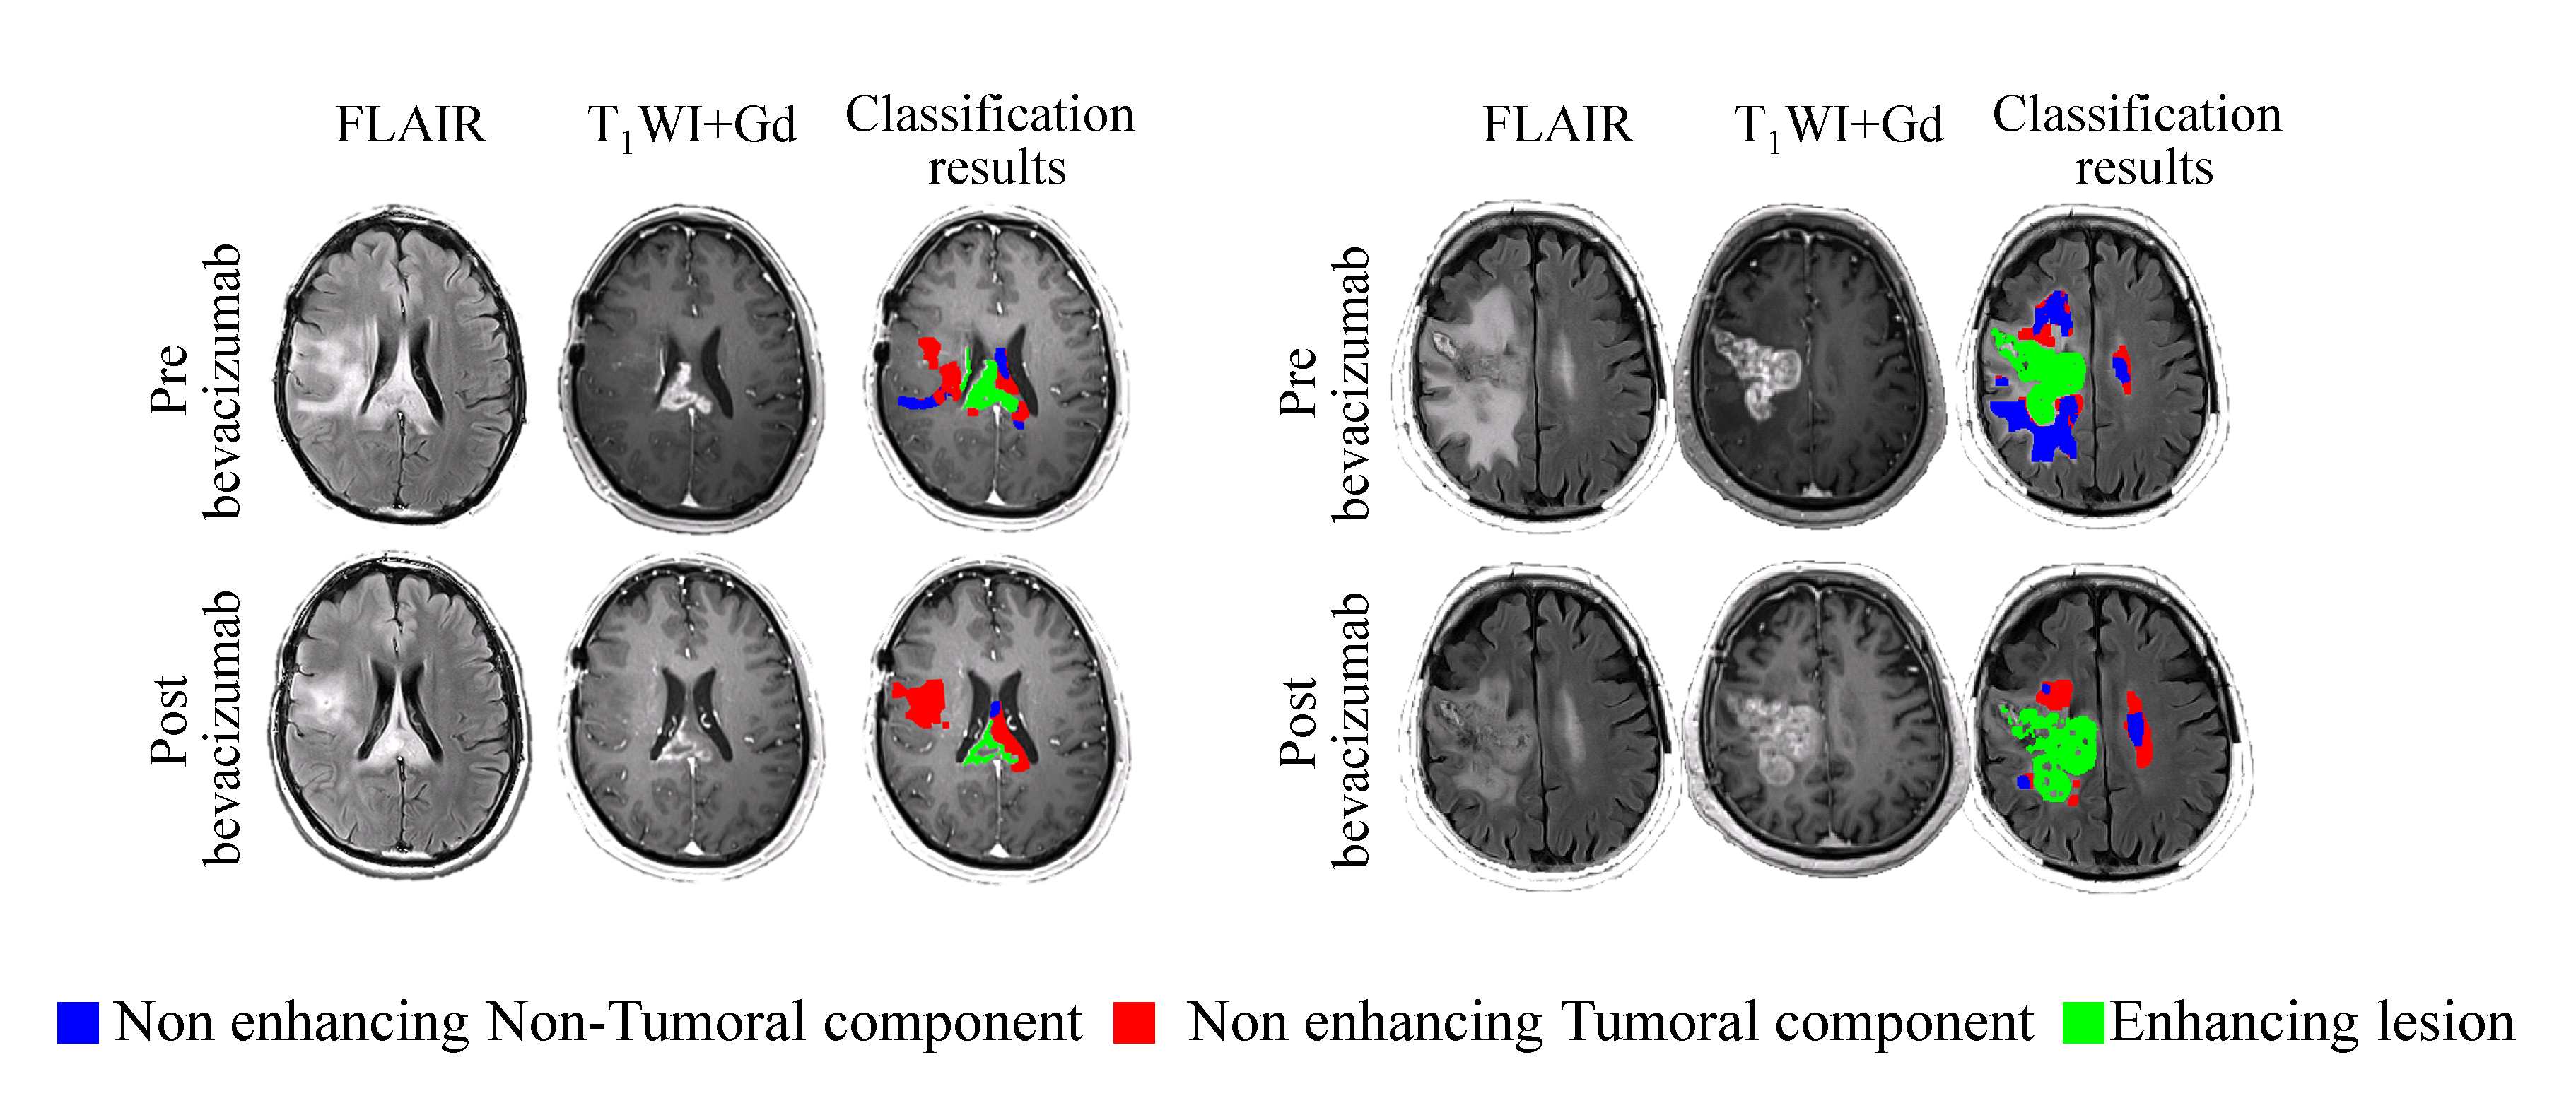
Longitudinal assessment in patients following bevacizumab therapy: Substantial reduction in the area of the non-enhancing lesion over time was detected in 13/15 patients (59±21%). However, classification results in this cohort demonstrated that in 12 patients the reduction was primarily a decrease in the non-tumoral component (with stable or increased infiltrative tumor component) (Figure 3).
DISCUSSION & CONCLUSION
Radiomics patch-based analysis based on conventional MRI can be useful for the classification of the non-enhancing lesion area into tumoral and non-tumoral components at the individual level in patients with HGG. Longitudinal results demonstrate the potential of this method to assist in clinical decision-making and enable early prediction of disease progression in patients with HGG.Acknowledgements
To Tuvia Genut and Faina Vitinshtein for performing the MRI scans and to Vicki Myers for editorial assistanceReferences
- Hattingen E, et al. Quantitative T2 mapping of recurrent glioblastoma under bevacizumab improves monitoring for non-enhancing tumor progression and predicts overall survival. Neuro Oncol 2013.
- Liberman G, et al. DUSTER: Dynamic contrast enhance up-sampled temporal resolution analysis method. Magnetic resonance imaging 2016;34(4):442-450.
- Haralick RM et al. Textural features for image classification. IEEE Transactions on systems, man, and cybernetics 1973(6):610-621.Haralick RM, Shanmugam K. Textural features for image classification. IEEE Transactions on systems, man, and cybernetics 1973(6):610-621.
- Fink KR, et al. Imaging of brain metastases. Surg Neurol Int 2013;4(Suppl 4):S209-219.
- Stummer W. Mechanisms of tumor-related brain edema. Neurosurgical focus 2007;22(5):1-7
Figures