0120
Visual pathway structure and localisation of tumour-induced disturbance in optic pathway glioma: correlations between diffusion-MRI, visual evoked potentials, and optical coherence tomography1UCL Great Ormond Street Institute of Child Health, University College London, London, United Kingdom, 2Opthalmology Department, Great Ormond Street Children’s Hospital, London, United Kingdom, 3Haematology and Oncology Department, Great Ormond Street Children’s Hospital, London, United Kingdom
Synopsis
Optic pathway glioma (OPG) is a childhood tumour of the visual pathway. Clinical management of OPG remains challenging, as the extent of tumour infiltration of the visual pathway is not perceptible on conventional MRI. We used diffusion-MRI to delineate the visual pathway in OPG patients. Advanced ophthalmological assessment was also performed using visual evoked potentials (VEP) and optical coherence tomography. We demonstrate that fractional anisotropy (FA) in the optic pathway correlates with retinal nerve-fibre layer thickness and VEP response, and tumour invasion anterior to the optic chiasm can be detected via inter-ocular differences in optic nerve FA.
Introduction
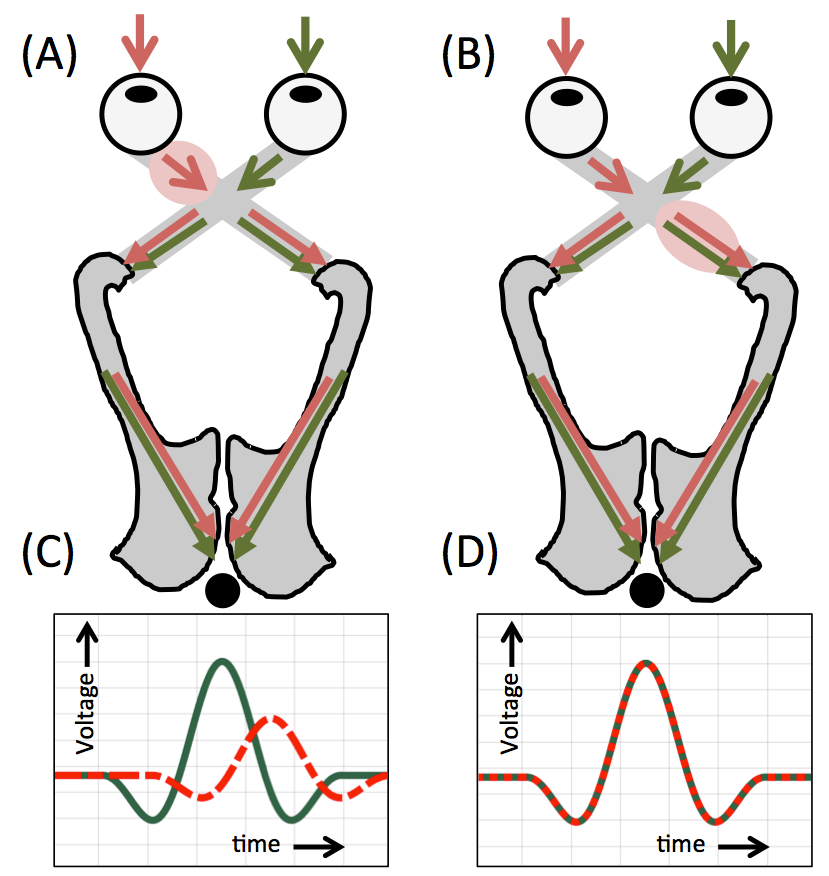
Optic pathway glioma (OPG) is a childhood tumour of the visual pathway. Despite having low-grade histological features, OPGs infiltrate along the visual apparatus, and as such up to half of patients suffer some degree of visual loss.1,2 Recent studies have demonstrated the utility of diffusion-MRI for delineating the visual pathway in OPG patients, and have shown correlations between visual acuity (VA) and both fractional anisotropy (FA) and mean diffusivity (MD) in this region.3,4 However, VA measurements can be difficult to obtain in younger or severely visually-impaired patients, and more advanced techniques, such as visual evoked potentials (VEPs) or optical coherence tomography (OCT), may have higher sensitivity and specificity for detection of visual deterioration.5–8 The aim of this study was to investigate the relationship between diffusion-MRI and both VEP and OCT in OPG patients. Furthermore, we hypothesised that asymmetries in the above metrics may provide further information regarding the position of a functional disturbance, relative to the optic chiasm (Fig 1).Methods
Data acquisition
Twenty-six patients (0.6-16.9 years) being treated for OPG at our institution were included in this study. Ophthalmological assessment included monocular and binocular VEP assessment with flash (FVEP) and pattern-reversal (PRVEP) stimuli 9, with signal measured using a mid-occipital electrode referred to a mid-frontal electrode. OCT was also used, where possible, to measure global retinal nerve fibre layer thickness (GRNFLT) in each eye. MRI was acquired using a Siemens 3.0T Prisma scanner. The diffusion-MRI sequence included two diffusion-weighting ‘shells’ at b=1000 and 2200 s/mm2 with 60 encoding directions per shell. Each patient’s MRI scan was matched to their closest ophthalmological assessment (median 68 days difference).
Analysis
Diffusion-MRI data were processed using a multi-shell multi-tissue constrained spherical deconvolution model.10 Probabilistic tractography was then used to delineate the optic nerves, tracts, and radiations, using the methodology described in 4. Median values of FA, MD, axial diffusivity (AD) and radial diffusivity (RD) were measured in these regions in each patient. The amplitude and latency of the major positive peak (P1/P100 for FVEP/PRVEP) 9 evoked by flash and pattern stimulation were measured. To quantify left/right eye differences in all parameters, an inter-ocular difference (IOD) value was used, where IOD = (right eye - left eye) / mean(right eye, left eye). Patients were classified as having an IOD in VEP response if monocular stimulation evoked FVEPs which differed in amplitude by more than 25% of the mean of the left- and right-eye value for that patient.
Results
FVEP measurements (binocular and monocular) were successfully obtained in 23/26 patients. Binocular/monocular PRVEPs were obtained in 21/26 and 10/26 patients respectively. OCT measurements of GRNFLT were successfully acquired in 10/26 patients.
Global Retinal Nerve Fibre Layer Thickness
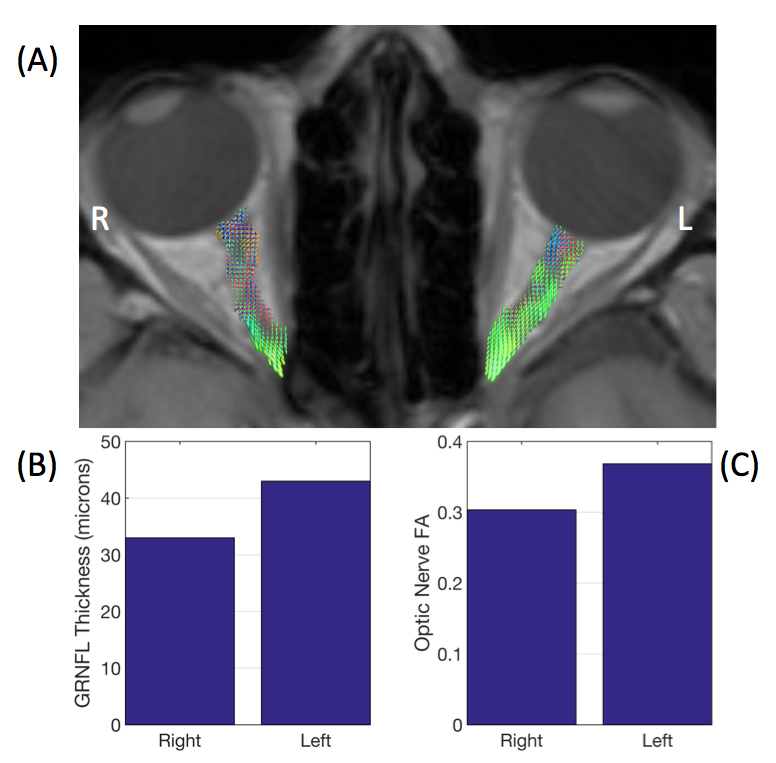
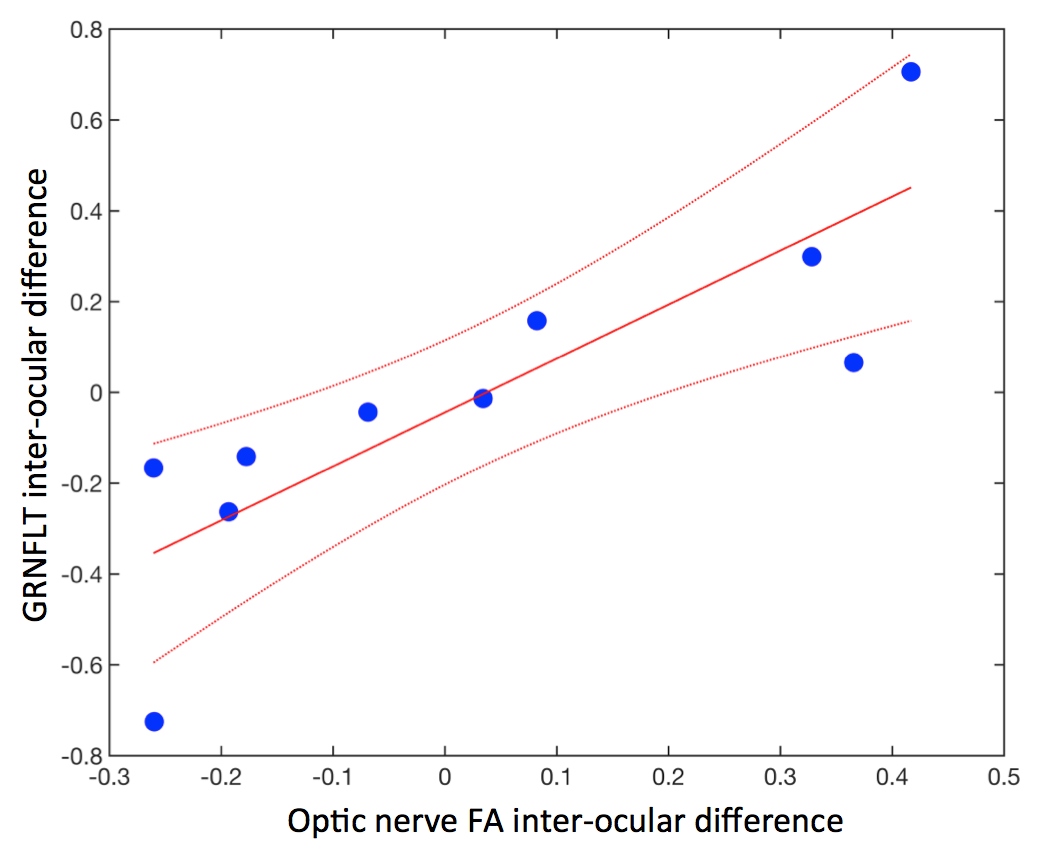
An example patient with an IOD in GRNFLT is shown in Fig 2. Overall, median FA in the optic nerve corresponding to a patient’s worst-eye (lowest FVEP amplitude) showed a significant positive correlation with GRNFLT (R2=0.54, p=0.016), with lower FA associated with a thinner nerve-fibre layer. IOD values in optic nerve FA were also positively correlated with IOD in GRNFLT (R2=0.70, p=0.0025, Fig 3).
‘End-to-End’ Optic Pathway Structure
Using binocular PRVEPs, the median FA across the entire optic pathway (optic nerves to radiations) showed a significant negative correlation with peak latency (R2=0.23, p=0.038), with lower FA associated with longer latency. There was also a trend for longer PRVEP latency and higher RD (R2=0.19, p=0.059).
Anterior Visual Pathway
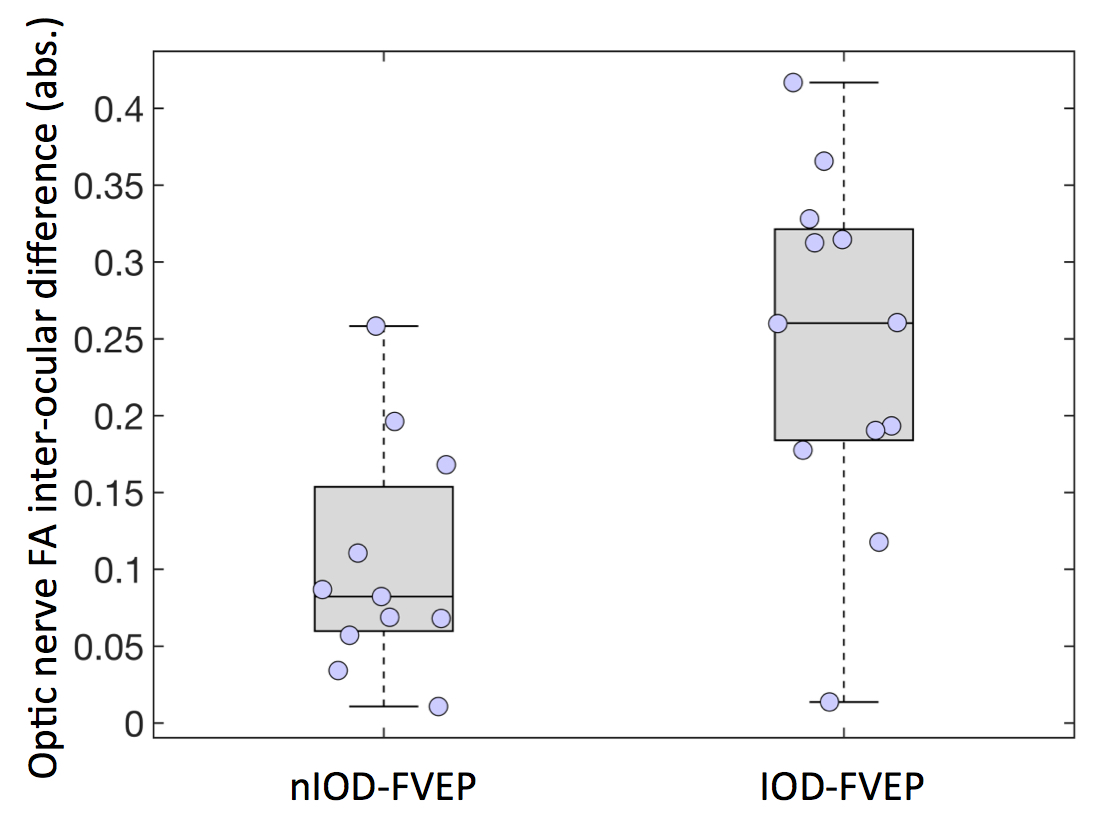
A significantly higher IOD in optic nerve FA values was found in patients with an IOD in FVEP response (IOD-FVEP), compared to those with no IOD in FVEP response (nIOD-FVEP; IODFA = 0.25±0.11 and 0.10±0.07 respectively, p=0.0020, unpaired t-test, Fig 4). A similar pattern was seen in optic nerve RD values (IODRD = 0.13±0.11 (IOD-FVEP) and 0.05±0.06 (nIOD-FVEP), p=0.045). This did not hold true in the optic tracts or radiations, in which no significant differences in IOD values of any of the diffusion-MRI metrics, between the IOD-FVEP and nIOD-FVEP groups, were found.
Discussion
In this study, we demonstrated the concordance of three independent assessments of visual pathway function in OPG patients, using diffusion-MRI, VEPs, and OCT. Inter-ocular differences in left- and right-eye VEP responses are indicative of a functional disturbance anterior to the optic chiasm.9 We found that patients demonstrating this also show an IOD in FA and RD in the optic nerves. As such, an IOD in optic nerve FA or RD could be used to assess the margin of tumour invasion anterior to the optic chiasm in OPG patients, which may not be possible to delineate using conventional MRI.Acknowledgements
We thank the patients and staff at Great Ormond Street Children's Hospital for their help in conducting this study. We are also grateful to our funders: Great Ormond Street Hospital Children's Charity and Children with Cancer UK (CwCUK-15-203).References
1. Balcer LJ, Liu GT, Heller G, et al. Visual loss in children with neurofibromatosis type 1 and optic pathway gliomas: relation to tumor location by magnetic resonance imaging. Am J Ophthalmol. 2001;131(4):442-445.
2. Listernick R, Charrow J, Greenwald M, Mets M. Natural history of optic pathway tumors in children with neurofibromatosis type 1: A longitudinal study. J Pediatr. 1994;125(1):63-66. doi:10.1016/S0022-3476(94)70122-9.
3. de Blank PMK, Berman JI, Liu GT, Roberts TPL, Fisher MJ. Fractional anisotropy of the optic radiations is associated with visual acuity loss in optic pathway gliomas of neurofibromatosis type 1. Neuro-Oncol. 2013;15(8):1088-1095. doi:10.1093/neuonc/not068.
4. Hales PW, Smith V, Dhanoa-Hayre D, et al. Delineation of the visual pathway in paediatric optic pathway glioma patients using probabilistic tractography, and correlations with visual acuity. NeuroImage Clin. October 2017 (in press). doi:10.1016/j.nicl.2017.10.010.
5. Kelly JP, Weiss AH. Detection of tumor progression in optic pathway glioma with and without neurofibromatosis type 1. Neuro-Oncol. 2013;15(11):1560-1567. doi:10.1093/neuonc/not120.
6. Kelly JP, Leary S, Khanna P, Weiss AH. Longitudinal measures of visual function, tumor volume, and prediction of visual outcomes after treatment of optic pathway gliomas. Ophthalmology. 2012;119(6):1231-1237. doi:10.1016/j.ophtha.2011.12.035.
7. Ng Y, North KN. Visual-evoked potentials in the assessment of optic gliomas. Pediatr Neurol. 2001;24(1):44-48. doi:10.1016/S0887-8994(00)00230-7.
8. Falsini B, Ziccardi L, Lazzareschi I, et al. Longitudinal assessment of childhood optic gliomas: relationship between flicker visual evoked potentials and magnetic resonance imaging findings. J Neurooncol. 2008;88(1):87-96. doi:10.1007/s11060-008-9537-1.
9. Aminoff MJ, Goodin DS. Visual Evoked Potentials. J Clin Neurophysiol. 1994;11(5):493.
10. Jeurissen B, Tournier J-D, Dhollander T, Connelly A, Sijbers J. Multi-tissue constrained spherical deconvolution for improved analysis of multi-shell diffusion MRI data. NeuroImage. 2014;103:411-426. doi:10.1016/j.neuroimage.2014.07.061.
Figures