0115
Imaging vascular inflammation as a marker for T-cell infiltration in preclinical tumor models.1Biomedical Imaging, Genentech, South San Francisco, CA, United States, 2Genentech, South San Francisco, CA, United States
Synopsis
Checkpoint inhibitors, adoptive T-cell transfer and tumor vaccination are different cancer immunotherapies which have demonstrated clinical efficacy in certain patients1-3. All of these therapies require sufficient infiltration of cytotoxic T-cells into the tumor and direct contact with cancer cells. However, the reasons why certain tumors present with high T-cell infiltration while others do not are poorly understood. We therefore set out to assess if imaging vascular adhesion molecule 1 (VCAM-1) expression in the tumor vasculature could explain some of the observed differences in T-cell infiltration.
Purpose
To assess if imaging of VCAM-1 density could predict T-cell infiltration in murine tumor models.Methods
C57BL/6 mice (n=4) were inoculated with 5E5 EL4-GFP cells and NOD/SCID mice (n=4) with 5E5 E.G7-OVA-GFP cells s.c. on the hind leg. Once tumors had reached a volume > 400 mm3, baseline MRI was performed followed by i.v. infusion of 1E7 tdTomato positive OTI T-cells (these cells recognize OVA) and follow up MRI 2 or 3 days thereafter. MRI was performed on a 7T horizontal bore scanner (Bruker, Ettlingen, Germany) with a 86 mm volume transmit and a 4-channel phased array receive only cryoprobe. Tumors were embedded in dental paste to reduce susceptibility artifacts from the tumor/air boundary. Pre-contrast imaging included T2, ADC, T2* mapping as well as T2*-w acquisitions and DCE. Following pre-contrast imaging, animals were removed from the magnet and 4.5 mg Fe/kg micron sized iron oxide particles (MPIO) conjugated to either VCAM-1 (VCAM-MPIO) or Rat-IgG (IgG-MPIO) were infused via a tail vein catheter similar to a previously published protocol4. Mice were kept anesthetized outside of the magnet for 40 minutes after which T2* mapping and T2*-weighted acquisitions were repeated. The following imaging parameters were used: T2-mapping: RARE: TR 3000 ms, TE 14, 28, 42, 56, 70, 84 ms, NSA 1, 25.6x25.6 mm2 0.5 mm slice thickness, 20 slices, Matrix 128x128; Stimulated-echo diffusion: TR 3000 ms, TE 8.7 ms, maximum diffusion gradient 37 G/cm, δ/Δ 1/140 ms, b-values (100, 300, 600, 900, 1200) NSA 1; T2* Multi-gradient-echo; TR 900, TE 3, 7, 11, 15, 19, 23, 27, 31 ms, FA 60°, Matrix 196x196, NSA 1. T2*-w GE: TR 50 ms, TE 6 ms, FA 15°, 25.6x25.6x20 mm3, Matrix 213x213x83 (120 µm isotropic), NSA1.Results
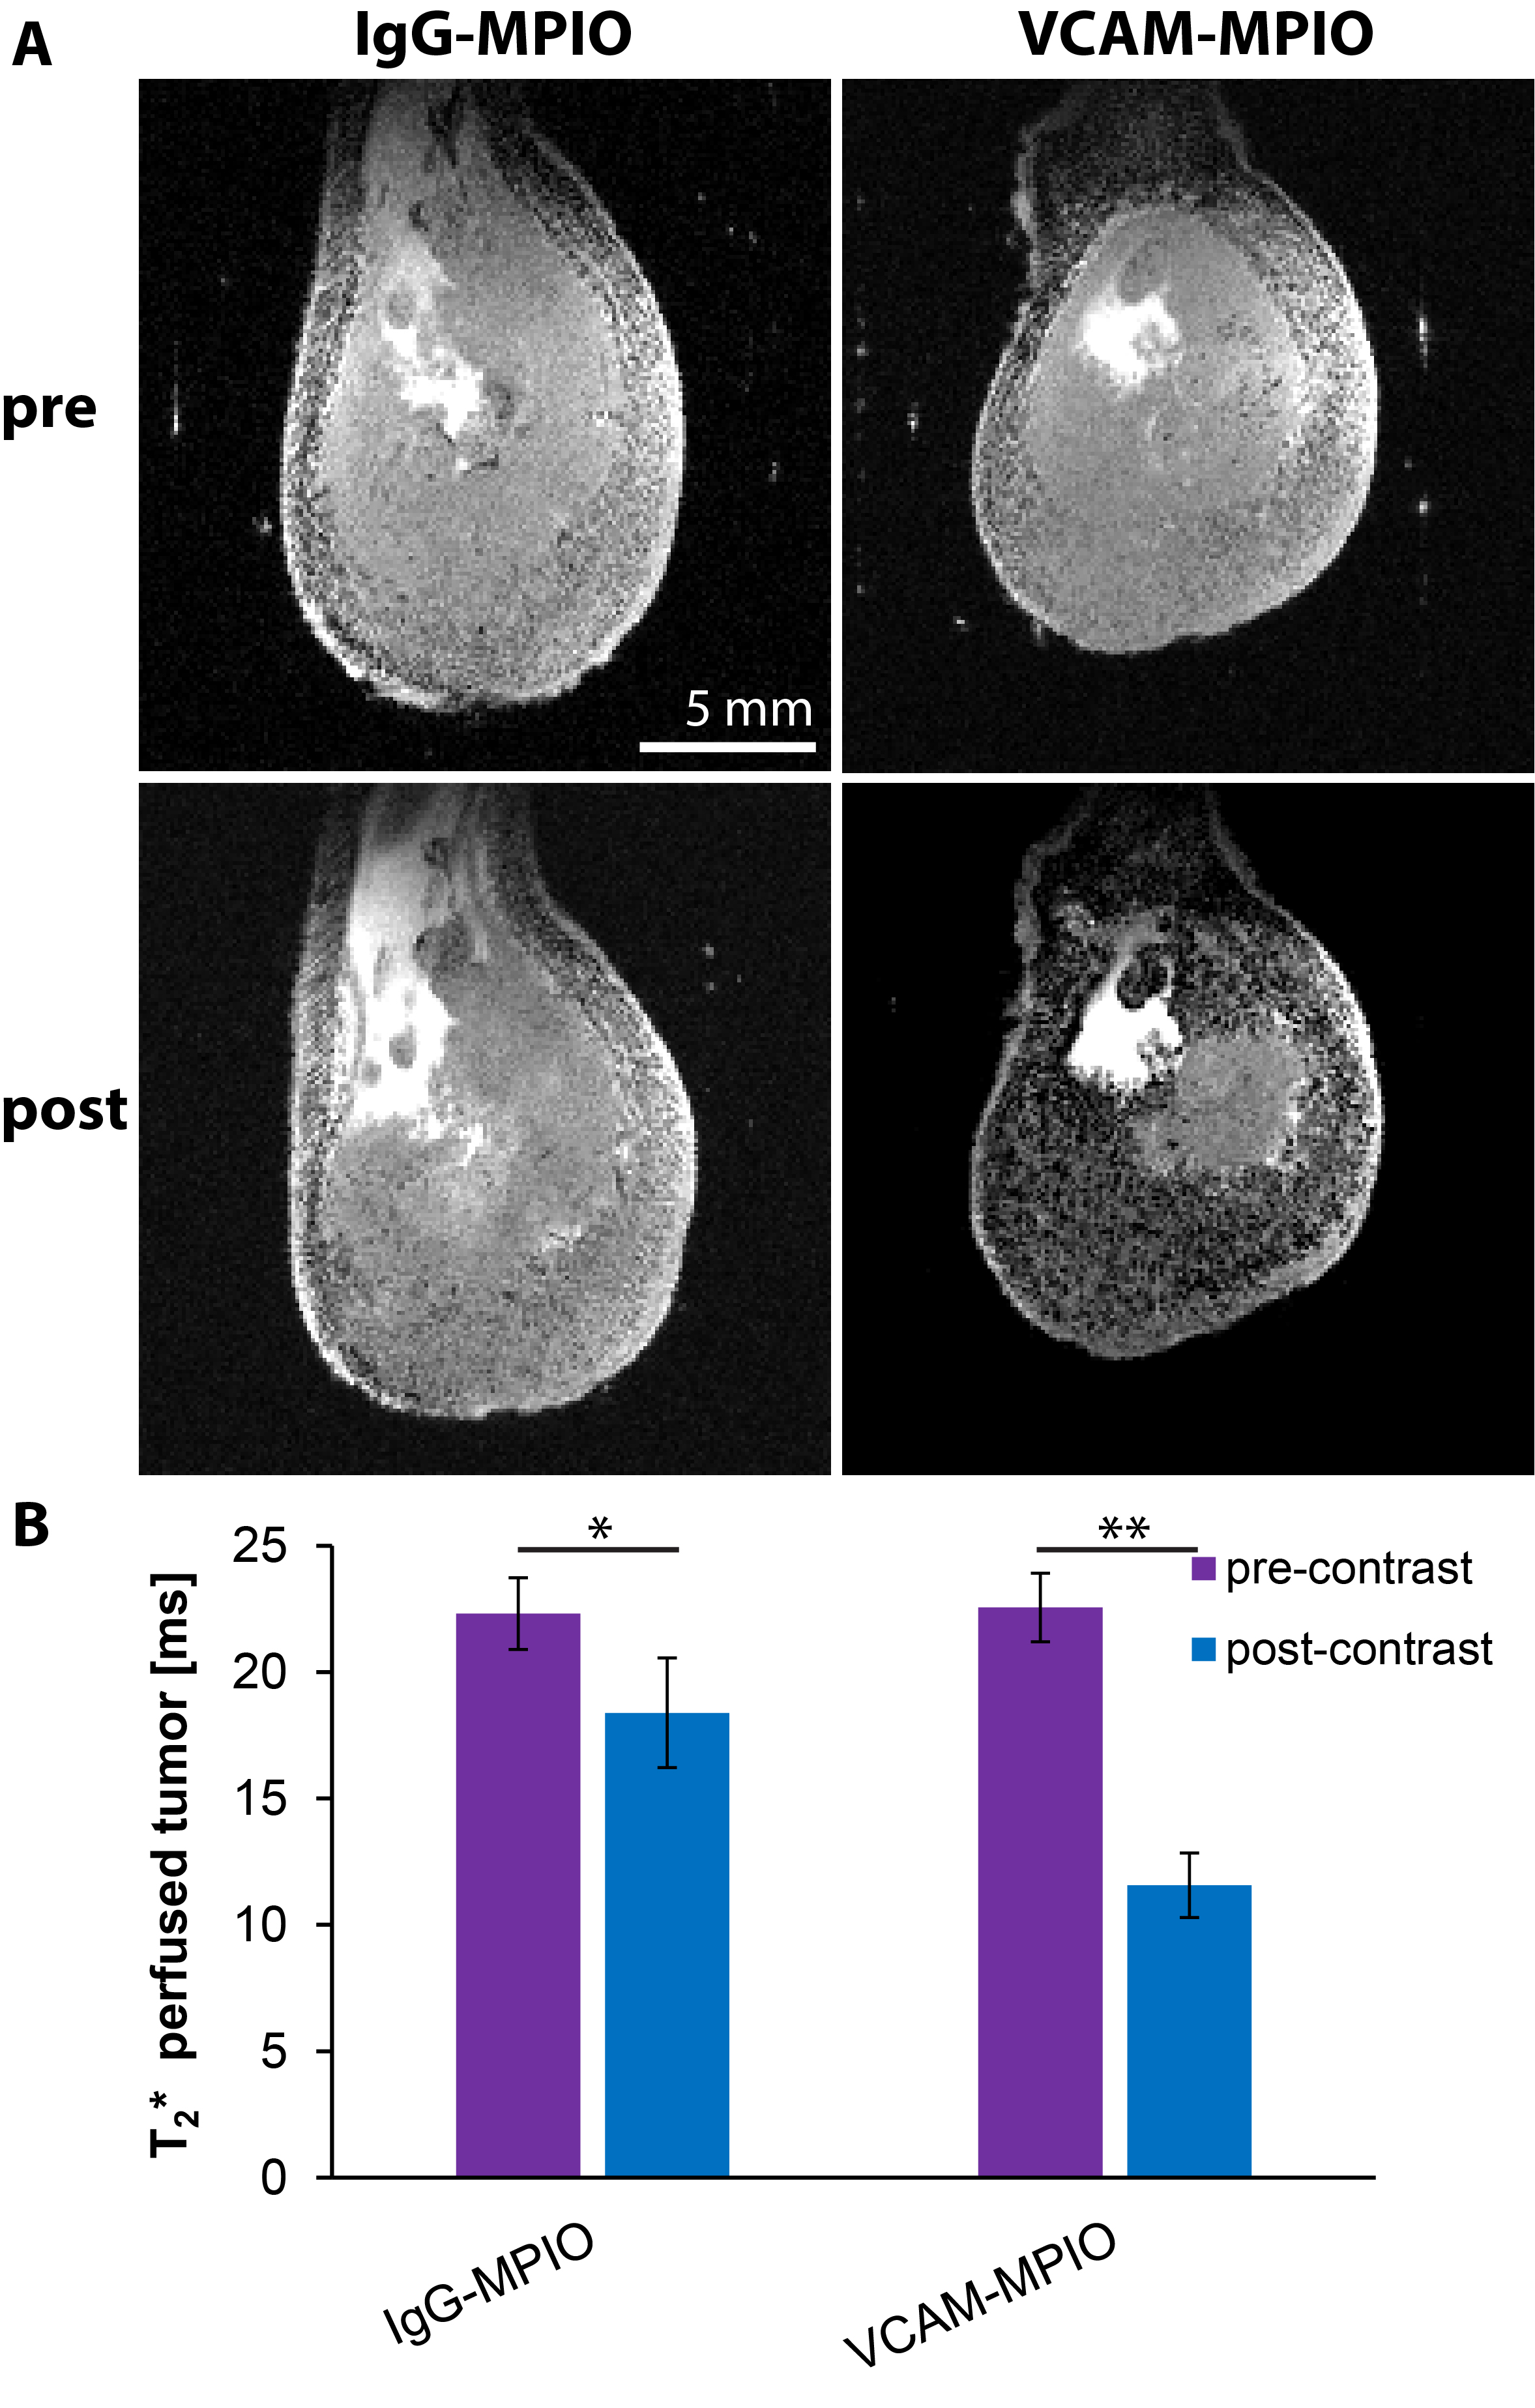
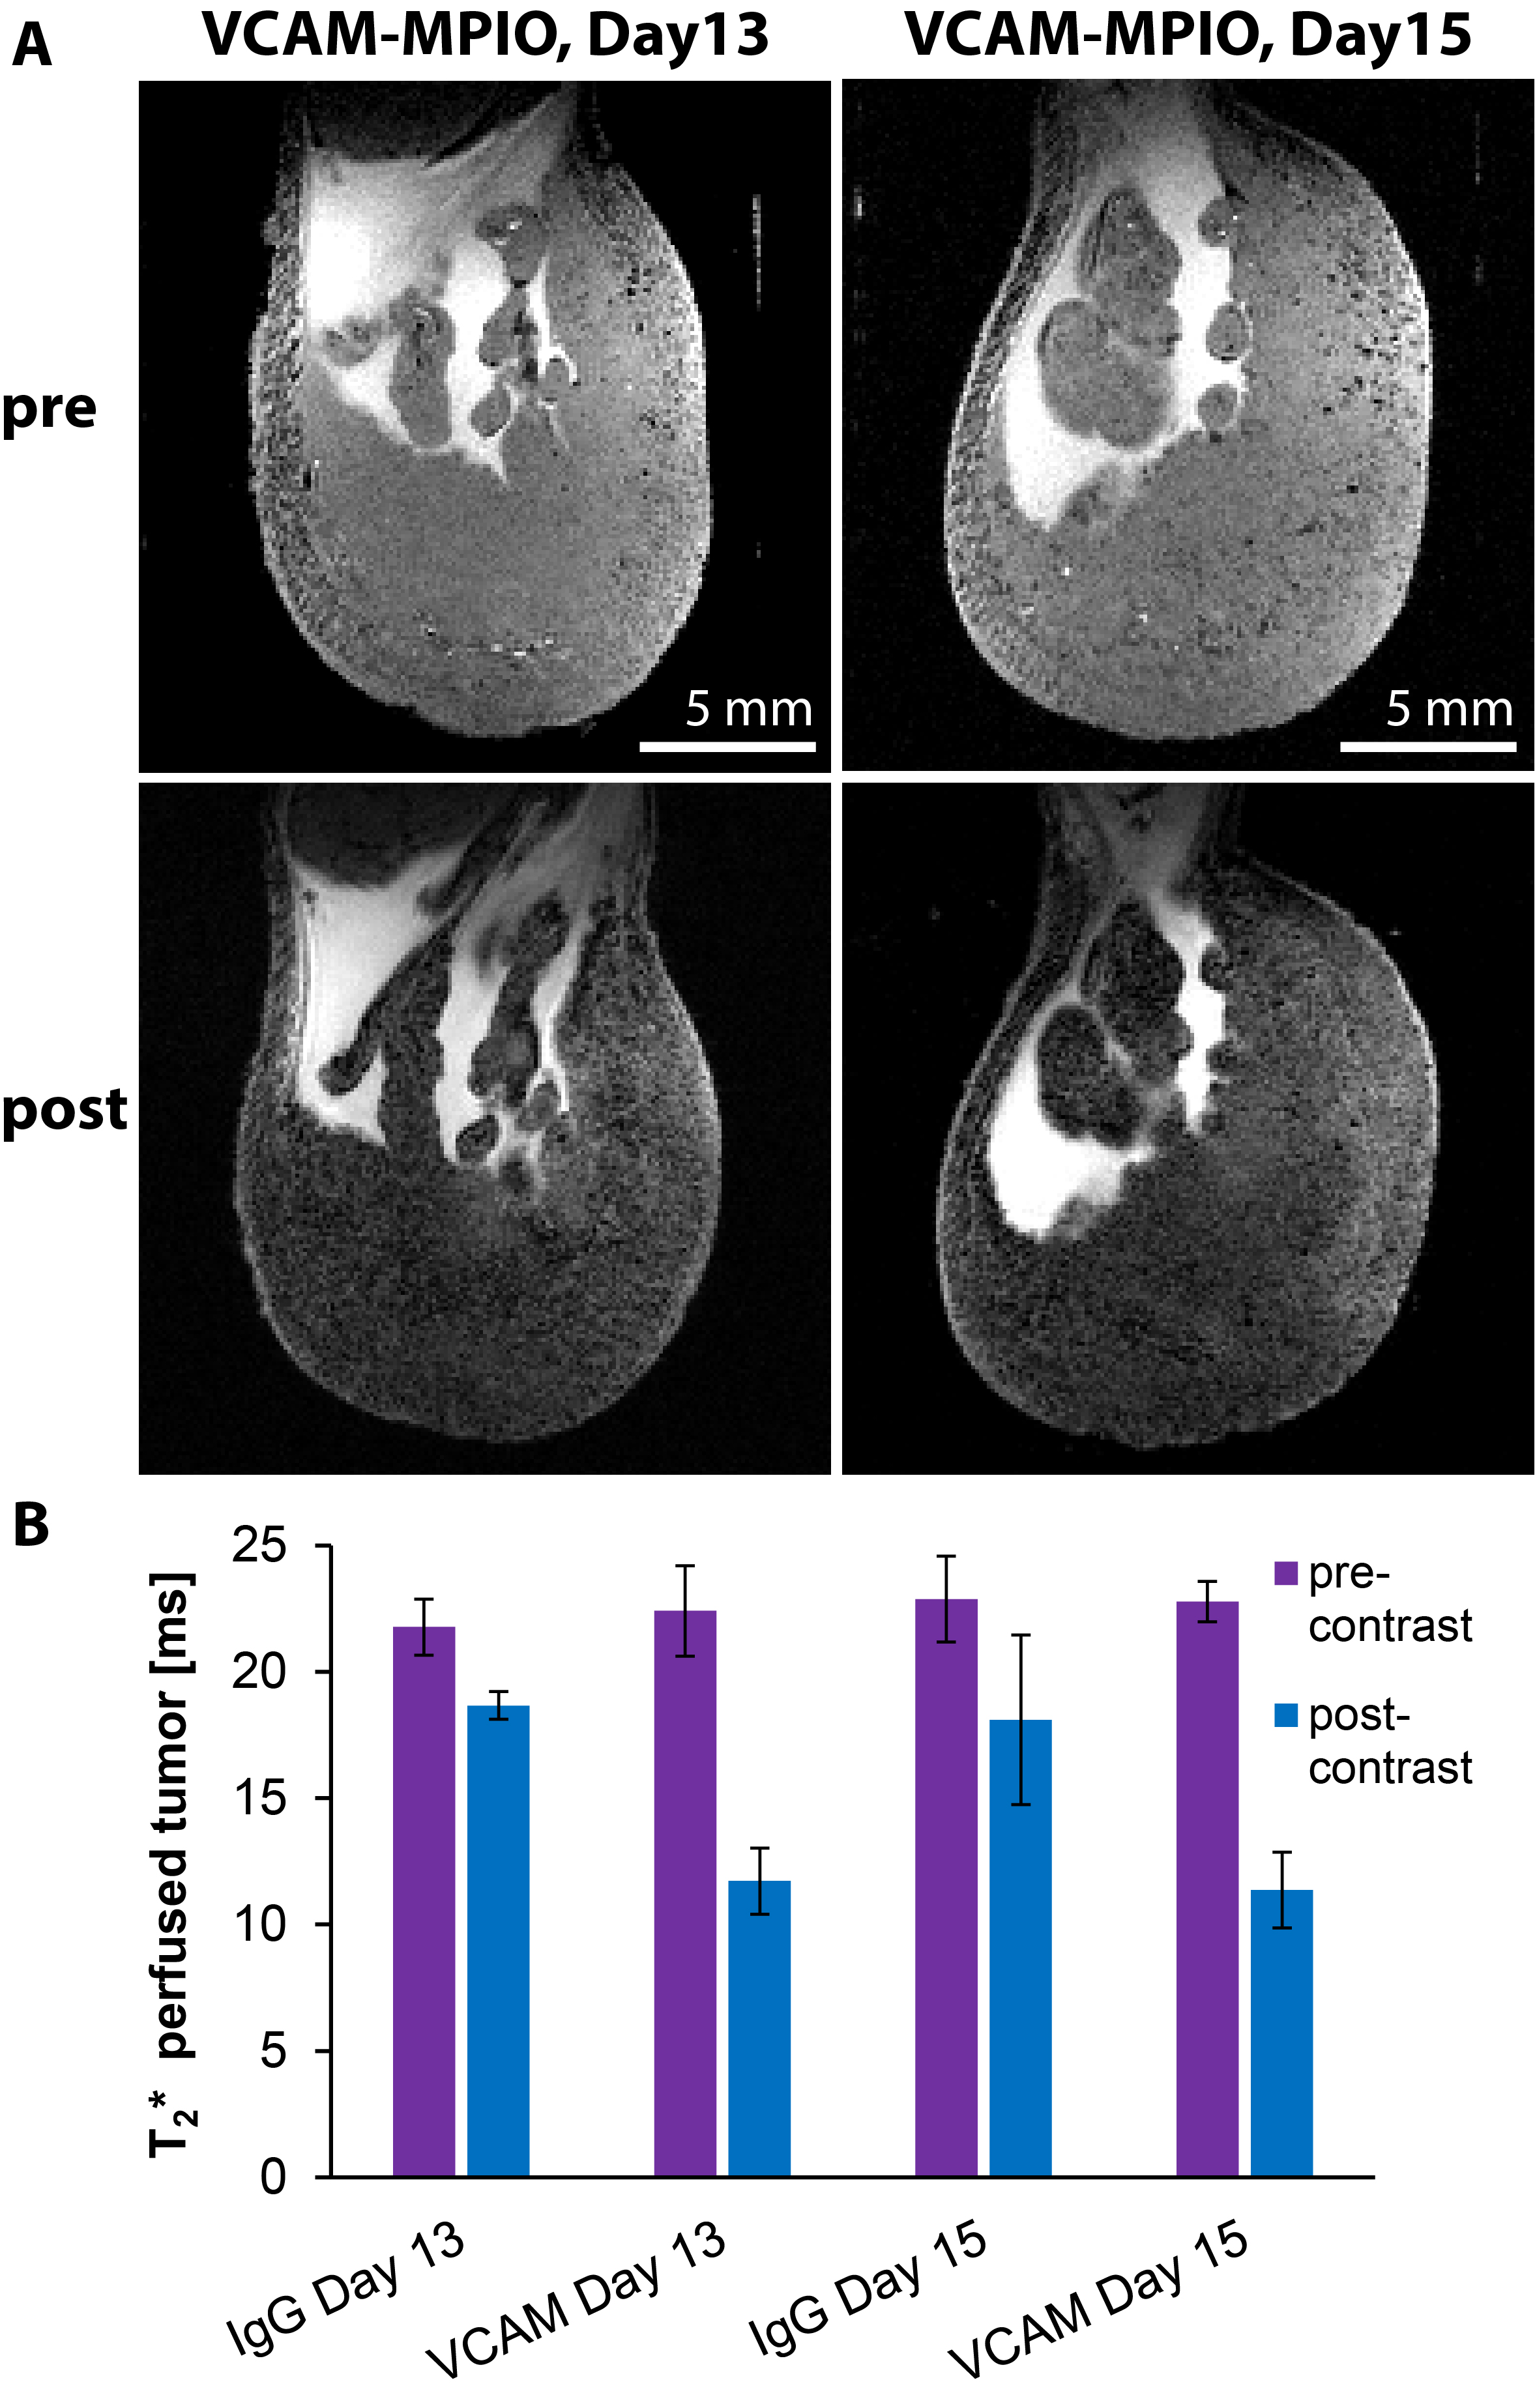
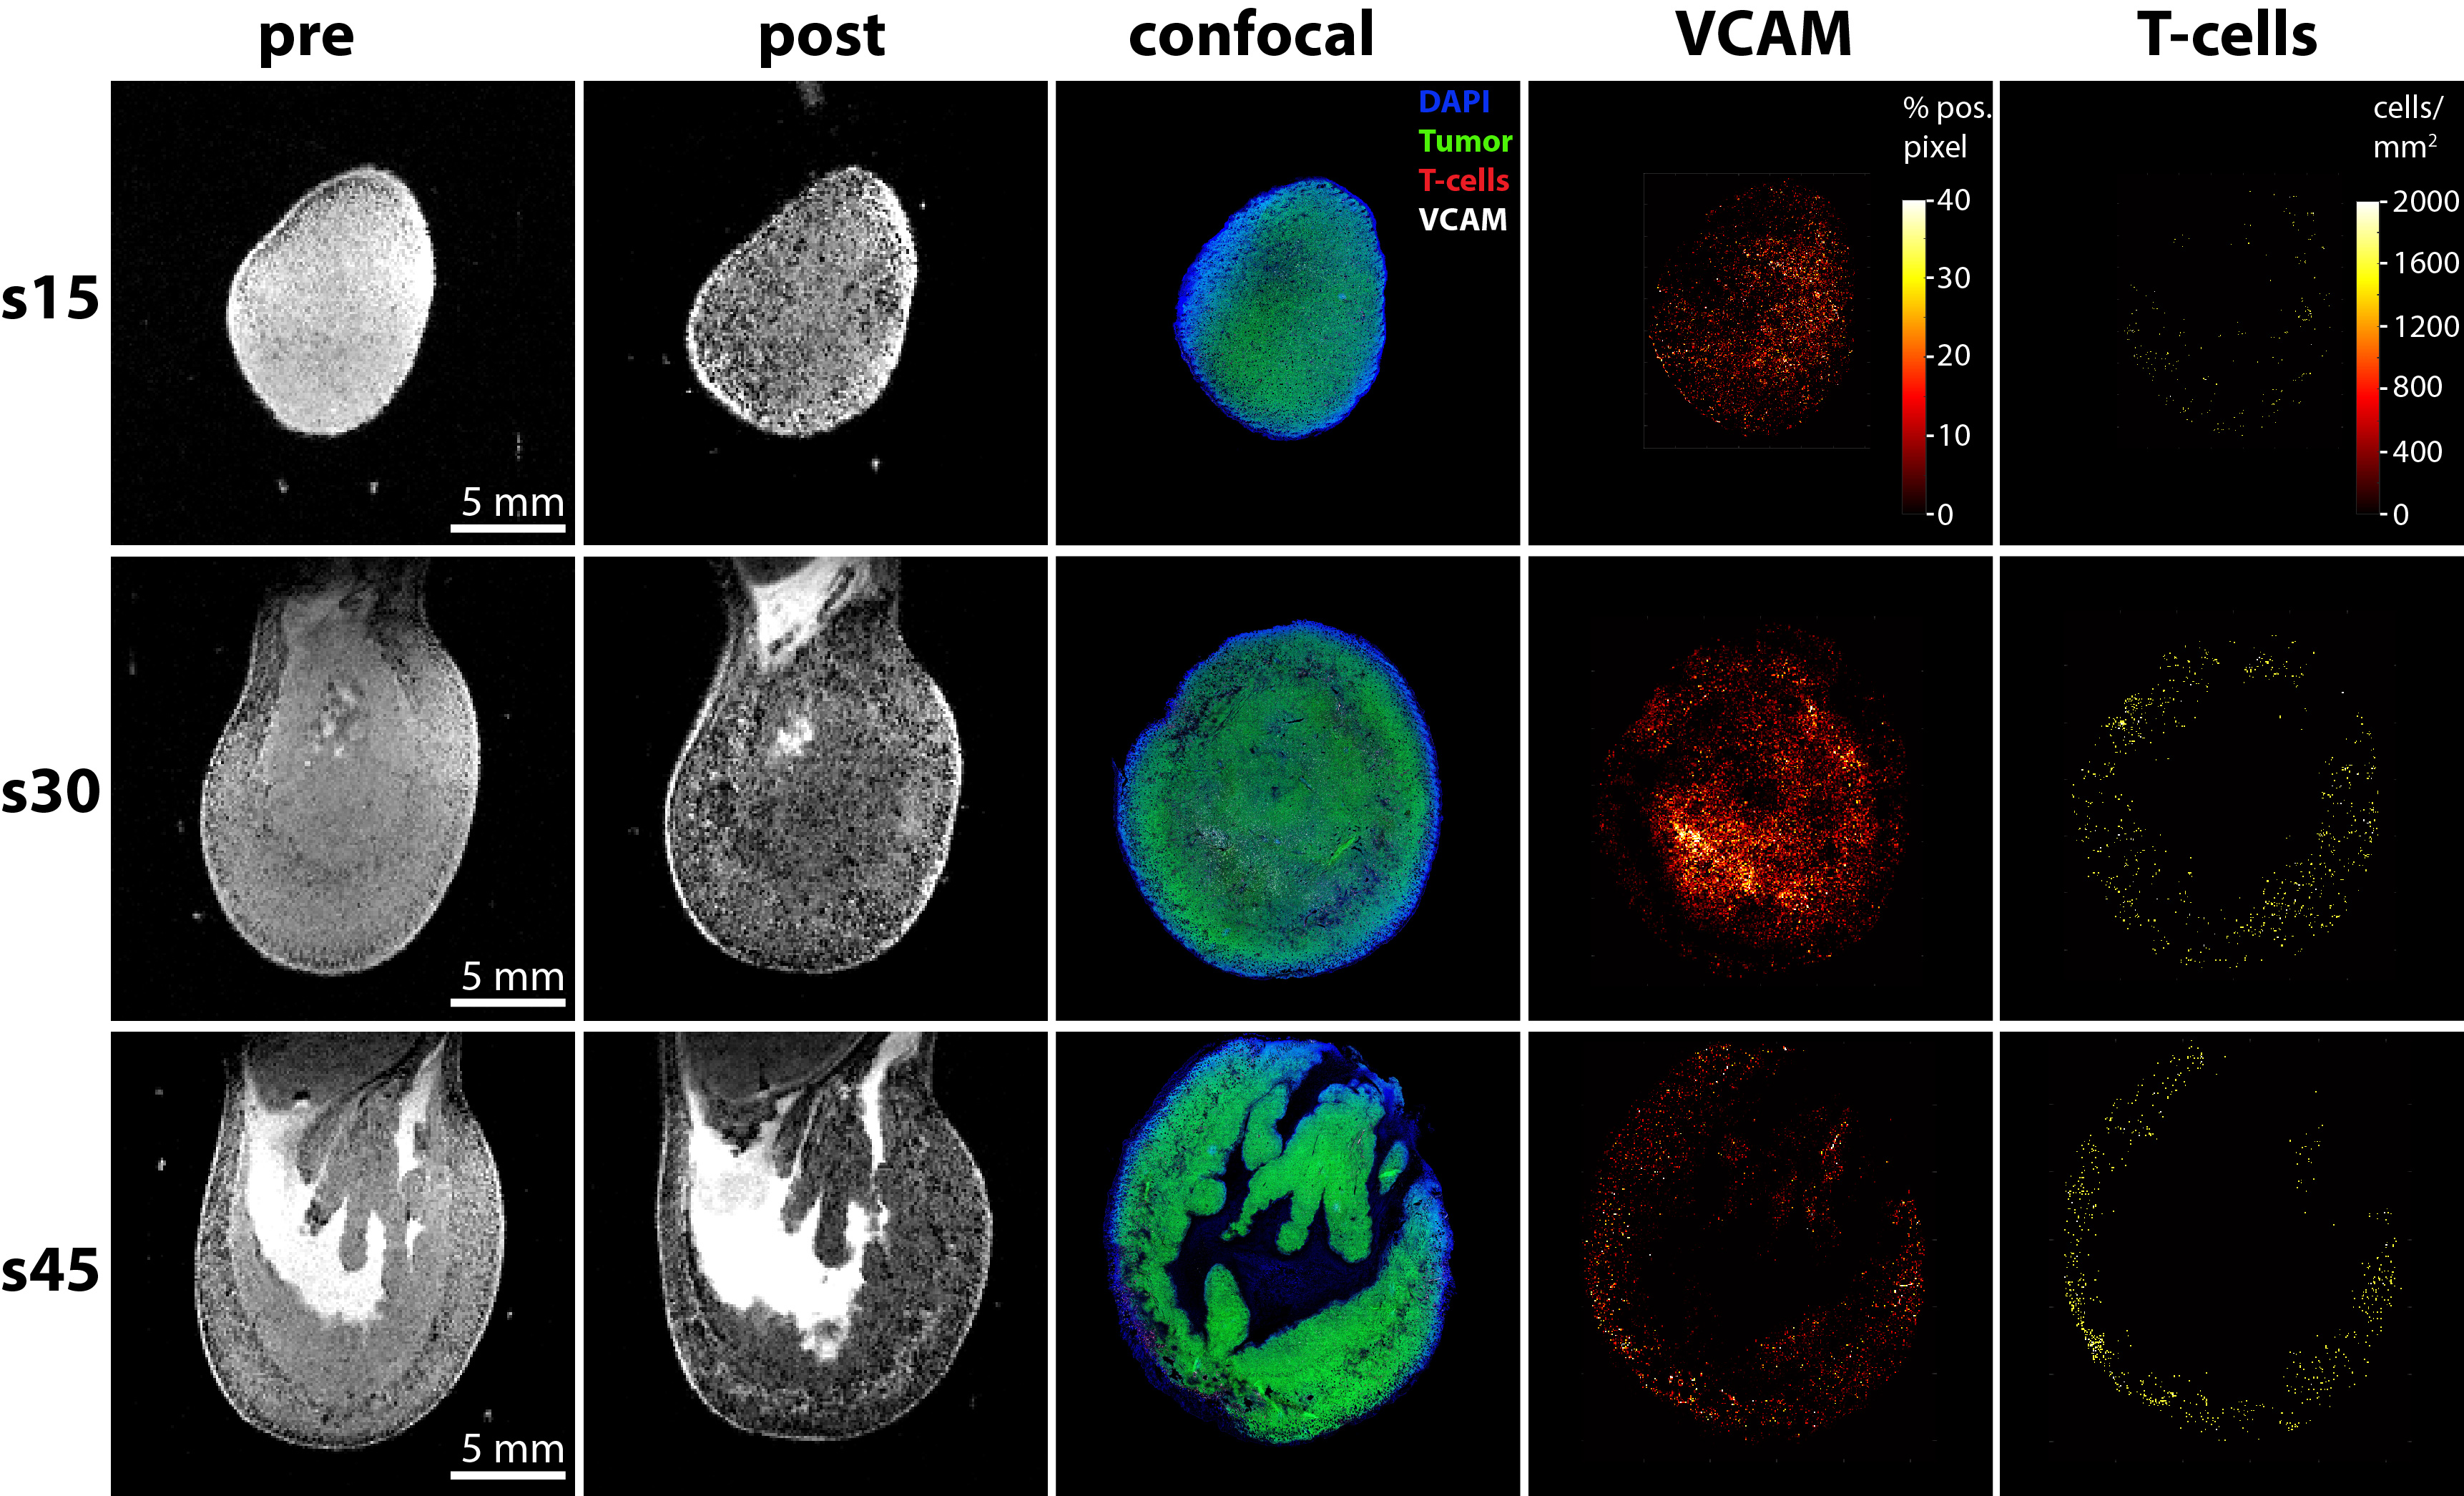
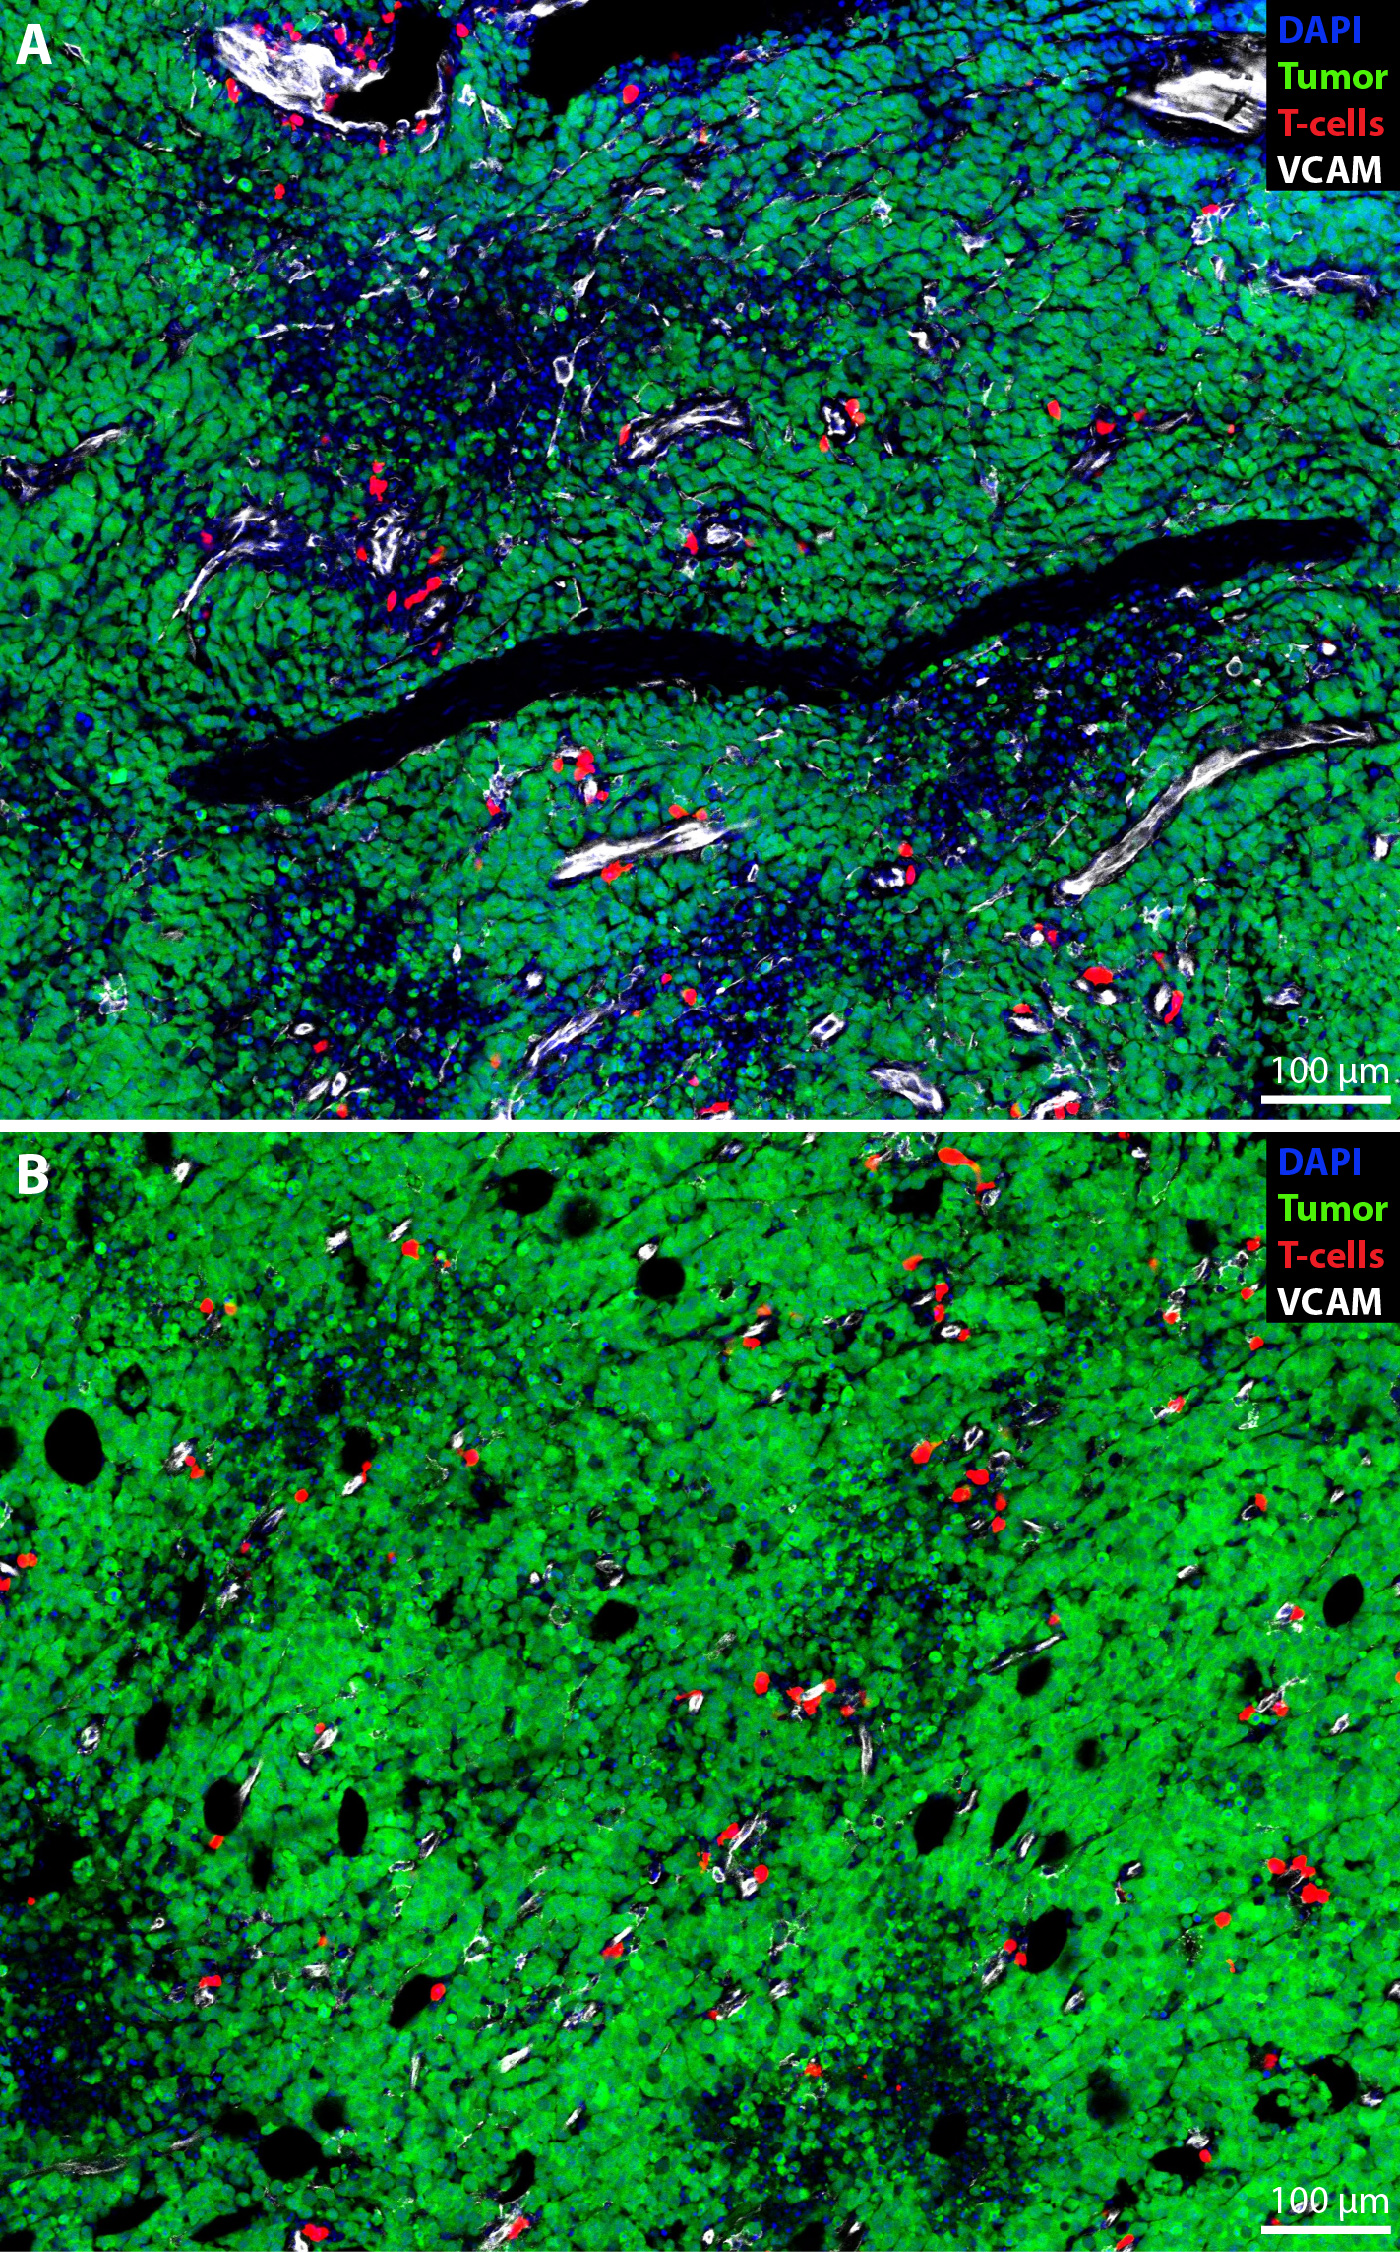
The administration of VCAM-MPIO led to a significant drop in T2* and the appearance of hypointense spots throughout the tumor tissue on T2*-weighted images. In contrast, IgG-MPIO administration led to a small change in T2* and few hypointense spots (Figure 1). To assess if repeated imaging with MPIOs in tumors would be feasible, we repeated VCAM-MPIO and IgG-MPIO imaging 2 days after the first imaging session. Pre-contrast images were not significantly different between imaging sessions. Furthermore, the VCAM-MPIO induced change in T2* was similar between imaging sessions (Figure 2). We next conducted the same experiments in NOD/SCID mice with E.G7-OVA-GFP tumors and administered T-cells that can recognize this tumor line after the first imaging session. Imaging was repeated 3 days later and tumors were excised for histology. We observed a good correspondence between VCAM-MPIO contrast, VCAM-1 density and T-cell density (Figure 3). However, T-cell density decreased towards the center of the tumor while VCAM density remained constant particularly for slices in the middle of tumors. Analysis of confocal microscopy data showed T-cells were always found in close proximity to VCAM positive blood vessels at this time point (Figure 4). Finally, we also observed signs of cytotoxic activity indicated by clearance of GFP positive tumor cells in areas of T-cell accumulation.Discussion
The feasibility of MPIO-based VCAM-1 expression imaging has been demonstrated previously for the brain4 and cardiovascular system5. However, its suitability for tumor imaging and the role of VCAM-1 as potential biomarker for T-cell extravasation has not been evaluated. We have demonstrated that VCAM-MPIO administration generates strong T2* changes in inflamed tumor models. We also show that bound MPIOs are cleared within 2 days enabling repeated assessment of VCAM-1 expression in the same tumor. Finally, T-cells were generally found in close proximity to VCAM-1 positive vessels 3 days after adoptive transfer indicating the relevance of VCAM-1 as a marker for T-cell extravasation. Nonetheless, areas with high VCAM-1 expression lacking T-cells were also detected, particularly in tumor centers. This indicates that either perfusion or other parameters such as chemokine gradients or additional adhesion molecules are required to predict T-cell extravasation. Ongoing experiments will validate the role of VCAM-1 expression in other tumor models as well as during immune checkpoint blockade.Conclusion
Imaging VCAM-1 expression might be a suitable biomarker for T-cell extravasation.Acknowledgements
We would like to thank Luke Xie and Cecile Chalouni for helpful discussions.References
1 Dudley, M. E. et al. Cancer regression and autoimmunity in patients after clonal repopulation with antitumor lymphocytes. Science 298:850-854 (2002).
2 Hodi, F. S. et al. Improved survival with ipilimumab in patients with metastatic melanoma. N Engl J Med 363:11-723 (2010).
3 Michael, A., Relph, K., Annels, N. & Pandha, H. Prostate cancer vaccines. Expert Rev Vaccines 12:253-262 (2013).
4 McAteer, M. A. et al. In vivo magnetic resonance imaging of acute brain inflammation using microparticles of iron oxide. Nat Med 13:1253-1258 (2007).
5 Kelly, K. A. et al. Detection of vascular adhesion molecule-1 expression using a novel multimodal nanoparticle. Circ Res 96:327-336 (2005).
Figures