0114
Correlation of tissue pH via 31P-MRSI with MTRasym derived from APT-CEST-MRI in glioblastoma and normal appearing white matter1Neuroradiology, University Hospital Frankfurt, Frankfurt am Main, Germany, 2Brain Imaging Center, Goethe University Frankfurt, Frankfurt am Main, Germany
Synopsis
The pH-value as physiological marker for clinical diagnosis can be measured with special hardware over 31P-MRSI. APT-CEST MRI offers an alternative method for such quantification but is challenging because of magnetization transfer from other tissue compartments.
To evaluate the role of pH for APT-CEST, we investigated 12 patients with first diagnosis of glioblastoma and 11 healthy controls, based on asymmetric analysis of magnetization transfer (MTRasym) and calculated pH maps over 31P-MRSI.
Our results show a high correlation between both parameters and support the hypothesis that an enhancement of MTRasym at 3.5ppm is associated with increased pH.Introduction
The pH-value is a potential physiological marker for clinical diagnosis as it is altered by several pathologies such as tumor, stroke or inflammation. The tissue pH can be measured non-invasively via 31P-MRSI, by evaluating the spectral distance between the peaks of inorganic phosphate (Pi) and creatine phosphate (PCr). Since 31P-MRSI requires special hardware, Amid Proton Transfer-Chemical Exchange Saturation Transfer (APT-CEST) MRI has been suggested as an alternative method for pH quantification with the additional advantage of increased spatial resolution. To detect the pH dependent CEST effect, an asymmetric analysis for the magnetization transfer (MTRasym) is needed 1. However, CEST imaging is challenging as contrasts depend on multiple factors such as sequence parameters and magnetization transfer effects arising from dissolved proteins, peptides, amino acids and metabolites 2.
The goal of this study was to assess the suitability of APT-CEST for pH assessment by correlating pH-values measured via 31P-MRSI with APT-CEST MRI contrast, which was obtained by calculating MTRasym values at 3.5 ppm distance from the water signal.
Methods
General: Measurements were performed on 12 patients with first diagnosis of glioblastoma and 11 healthy controls. All subjects gave written informed consent before participation. All measurements were performed with a 3T whole-body MRI-scanner (MAGNETOM Trio, Siemens Healthcare, Erlangen, Germany).
APT-CEST MRI: Data were acquired with a body TX-coil and an 8-channel phased-array head RX-coil. Imaging was based on a two-dimensional CEST-EPI sequence (TR=4000ms, TE=22ms, voxel-size=3x3x5mm3), using a saturation module that comprised eight rectangular radio frequency (RF) pulses (pulse duration=250ms, inter-pulse delay=250ms, B1=1µT). Z-spectra were recorded applying RF irradiations with different offset frequencies ranging from -8 ppm to +8 ppm (measurement repetitions=2, offset increment=0.5) and from +/-3 to +/-4 ppm (measurement repetitions=8, offset increment=0.1).
31P MRSI: Data were acquired with a three-dimensional CSI sequence, using a double tuned 1H/31P coil. Parameters were TR=2000ms, FA=60° and a voxel size of 17.5x17.5x25mm3. The spectra were analyzed voxel-wise with jMRUI, employing a nonlinear least-square fitting algorithm in the time domain.
Data Analysis: For each subject, Z-spectra were determined voxel-wise, interpolated and corrected for B0 field inhomogeneity. MTRasym was calculated and read out at 3.5 ppm distance from the water resonance. A region-of-interest (ROI)-based evaluation was performed for the following ROIs:
- Controls subjects: four different regions in normal appearing white matter (NAWM).
- Patients: one ROI in the tumor and three ROIs in surrounding NAWM.
Spectroscopic data were used to calculate pH maps according to Petroff et al.3 and to obtain further metabolic information. Resulting pH-values were compared to the MTRasym.
Results
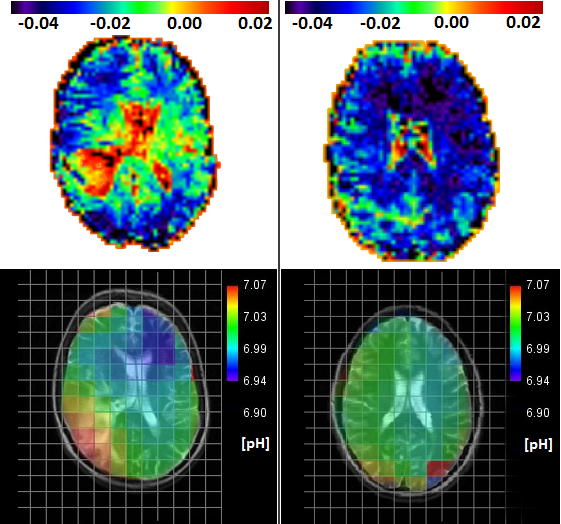
Figure 1 shows representative maps of MTRasym at 3.5ppm (top) and pH (bottom) for a patient (left) and a healthy subject (right). In both cases, MTRasym maps show higher contrasts in cerebrospinal fluid (CSF) than in NAWM. The glioblastoma region shows a similar contrast as CSF compartments, which correspond to increased pH-values within those regions. Healthy subjects exhibit a homogeneous distribution of pH and MTRasym in NAWM.
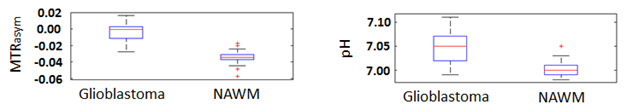
Figure 2 shows boxplots of MTRasym and pH values inside the respective ROIs for both groups. In glioblastoma, both pH (7.05±0.03) and MTRasym (0±0.012) are larger than in NAWM (7±0.01 / -0.34 ±0.007). The t-test showed highly significant differences between NAWM and glioblastoma for pH and MTRasym (p< 0.001).
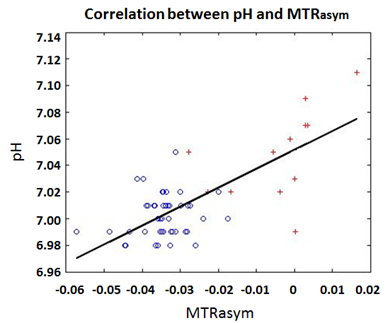
Figure 3 shows a scatter plot of pH versus MTRasym values, both for NAWM (blue circles) and glioblastoma (red crosses). A correlation was found between both parameters (r=0.7). Furthermore, a threshold value of -0.02 for MTRasym may facilitate differentiation between NAWM and glioblastoma.
Discussion and Outlook
The results presented here support the hypothesis that MTRasym values as measured via APT-CEST MRI are strongly correlated with pH-values. Although increased MTRasym may be just the result of modified solid-state MT contrast in tumor 4. Our results clearly indicate a role of intracellular pH hinting at APT-CEST as important mechanism. Also, the data suggest that MTRasym might be used to distinguish between NAWM and tumor infiltrated tissue.For future studies it is planned to correct MTRasym maps for inhomogeneity of the transmitted RF field (B1) 5 and to investigate additional acquired MT maps to clarify the contrast of MTRasym even further.
Conclusion
Increased pH in glioblastoma regions correlates with higher MTRasym values, while NAWM in patients and health subjects are not significantly different. The results suggest that MTRasym enhancement at 3.5 ppm is associated with increased pH.Acknowledgements
No acknowledgement found.References
1. van Zijl Peter C.M., Yadav N. Chemical Exchange Saturation Transfer (CEST): what is in a name and what isn’t? Magn Reson Med. 2011;65(4):927-948
2. van Zijl Peter C.M. ,et al. Magnetization Transfer Contrast and Chemical Exchange Saturation Transfer MRI. Features and analysis of the field-dependent saturation spectrum.Neuroimage 2017
3. Petroff OA,et al. Cerebral Intracellular pH by 31P nuclear magnetic resonance spectroscopy. Neurology 1985;35(6)781-8
4. Kurki T, Lundbom N., Valtonen S. Tissue characterization of intracranial tumours: the value of magnetisattion transfer and conventional MRI.Neuroradiology 1995; Issue 7:pp515-521
5. Volz S.,Nöth U.,Rotarska-Jagiela A. Deichmann R. A fast B1-mapping method for the correction and normalization of magnetization transfer ratio maps at 3T. Neuroimage 2010;49(4)2015-26
Figures