0113
Carbon Nanodots as Diamagnetic CEST MRI Contrast Agents for Cell Labeling1Department of Radiology and Radiological Science, Johns Hopkins University, School of Medicine, Baltimore, MD, United States, 2Department of Neurology, Johns Hopkins University, School of Medicine, Baltimore, MD, United States, 3Kennedy Krieger Institute, Baltimore, MD, United States, 4Institute for Cell Engineering, The Johns Hopkins University School of Medicine, Baltimore, MD, United States, 5F.M. Kirby Research Center for Functional Brain Imaging, Kennedy Krieger Institute, Baltimore, MD, United States
Synopsis
Carbon nanodots (
Purpose
Carbon nanodots (Cdots) belong to zero-dimensional nanocarbons with sizes typically below 10 nm1. Depending on the synthetic conditions, several moieties containing oxygen and/or nitrogen evolve at their surfaces, such as carboxyl, hydroxyl, amine, amide, etc. While Cdots are endowed with intrinsic multiple fluorescence emissions, the weak fluorescence in the NIR window (650-900 nm) renders them unsuitable for in vivo optical imaging2. The purpose of this study is to characterize the CEST signal of arginine-modified Cdots (Arg-Cdots) and to explore their possible application in cell labeling.Methods
Typically, Arg-Cdots were prepared from the condensation reaction of glucose (1 g) with arginine (0.5 g) by microwave irradiation for 10 min, and then completely purified through dialysis (1 kDa MWCO). Afterwards, the Cdots were dried at 80 oC, weighted, and dispersed in PBS (pH 7.4, 10 mM) at a final concentration of 100 mg/mL. To achieve high efficiency of cell labeling, we prepared cationic liposomes (EPC/DOPE/DOTAP, 50/25/25% molar) encapsulating Arg-Cdots (lipo@Arg-Cdots) according to the literature3. In brief, the three components of lipids in chloroform were mixed and dried to a thin film with air flow. 0.5 mL of Arg-Cdots solution (100 mg/mL) was added and the film was hydrated at 50 oC for 2 h. After that, the solution was extruded through polycarbonate membranes (400, 100, and 50 nm successively) to obtain the lipo@Arg-Cdots. To label U-87 MG cells, lipo@Arg-Cdots were added into culture medium at a final concentration of 1 mg/mL, and incubated with cells at 37 oC for 12 h. The labeled cells were then collected and encapsulated into alginate microcapsules using a previously reported method4. The unlabeled cells were used as the control. All MRI measurements were performed at 37 oC using a Bruker 9.4 T vertical MR scanner with a 20-mm birdcage transmit/receive coil. CEST spectra were calculated from the mean of sample ROIs after correction of B0 inhomogeneity using the WASSR method. CEST contrast was quantified by MTRasym = (S-Δω - S+Δω)/S0Results and Discussions
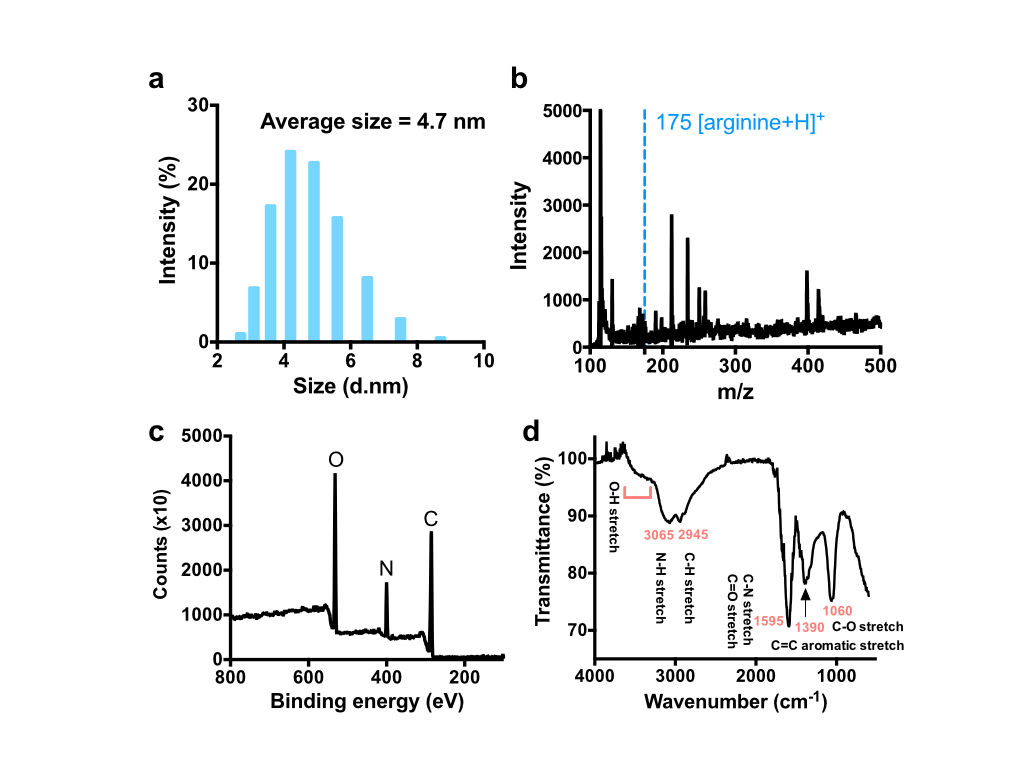
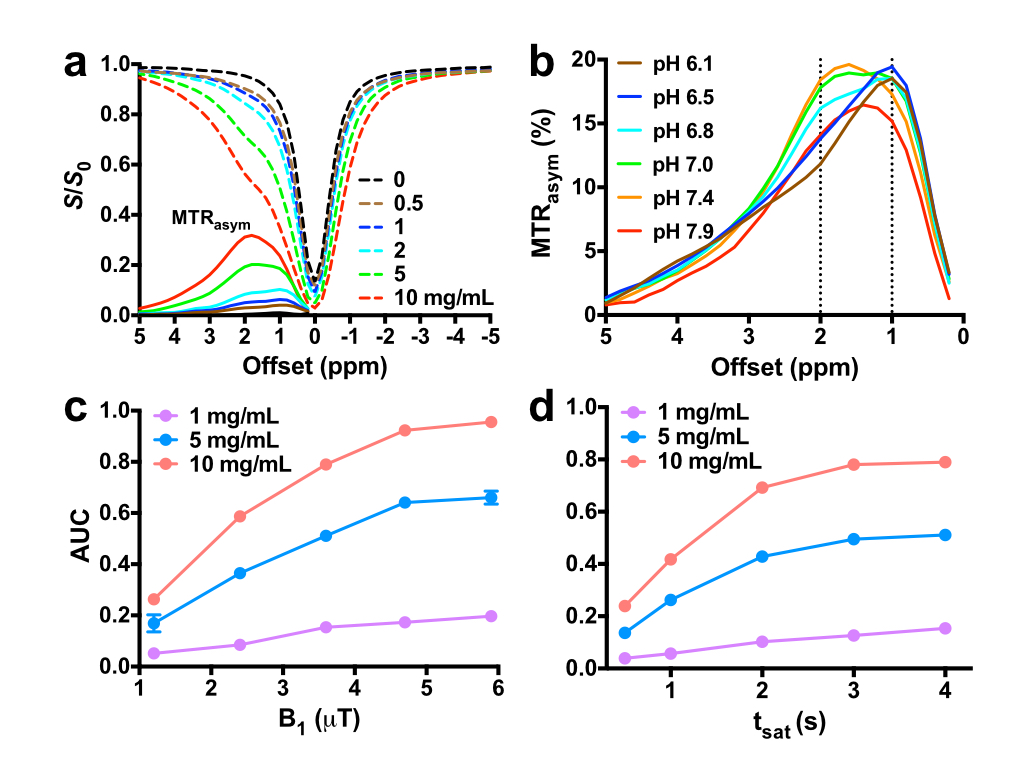
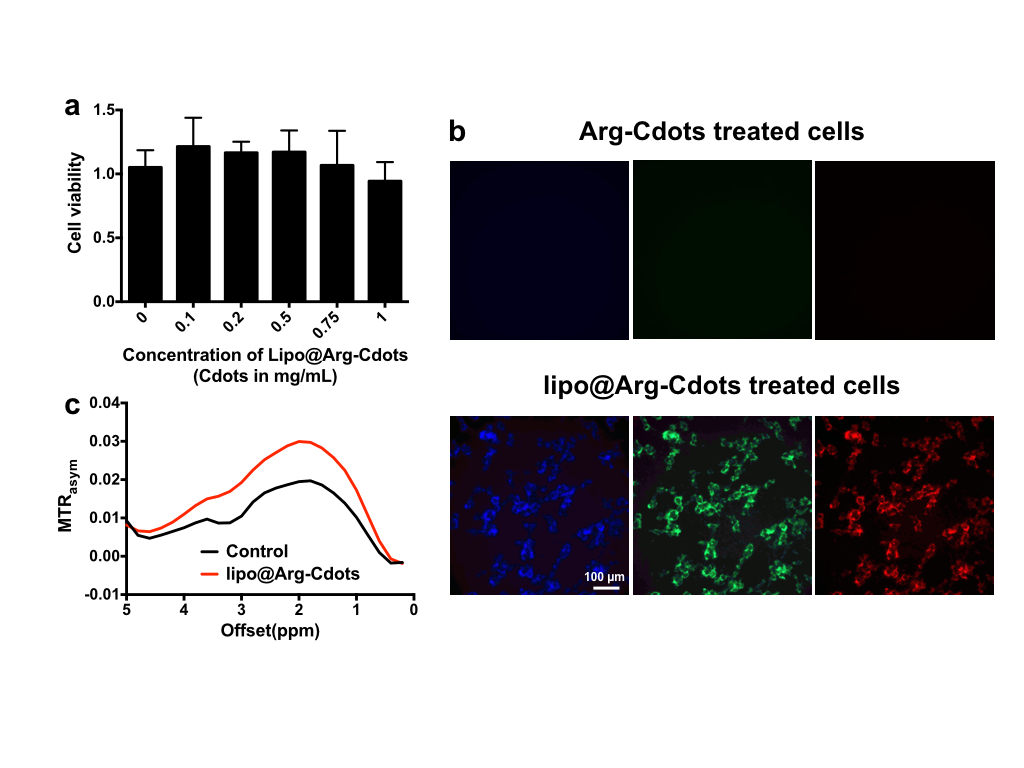
Dynamic light scattering (DLS) result showed that the average size of Arg-Cdots was 4.7 nm (Figure 1a). There was no peak assigned to the presence of arginine in matrix-assisted laser desorption/ionization-mass spectrometry (MALDI-MS) trace (Figure 1b), indicating high purity of the prepared Arg-Cdots. X-ray photoelectron spectroscopy (XPS) revealed that the Cdots contained C, N, and O, and Fourier-transform infrared spectroscopy (FTIR) further designated peaks attributed to -OH, -NH, and -COOH groups (Figures 1c&d). At pH 7.4, the Arg-Cdots clearly exhibited a broad CEST MTRasym signal resonant at 1-2 ppm (Figure 2a), which we attribute to hydroxyl protons and arginine-derived guanidyl protons5. The CEST contrast of Arg-Cdots showed a pH-dependent pattern, as shown in Figure 2b. At lower pH values (pH = 6.1 and 6.5), the maximum MTRasym value was obtained at an offset of +1 ppm, corresponding to the frequency offset of rapidly exchanging hydroxyl protons; while at higher pH values (pH = 7.0 and 7.4), the MTRasym value at +2 ppm due to the contribution of guanidyl protons surpassed that of hydroxyl protons. We also studied the effects of saturation power (B1) and saturation time (tsat) individually (Figures 2 c&d). At tsat = 4 s, the optimal B1 was 4.7 μT at which the signals were almost stable; and at B1 = 3.6 μT, the signals reached a plateau when tsat was 3 s. Prior to CEST MRI of the labeled cells, we investigated the toxicity of the lipo@Arg-Cdots to cells, and it showed insignificant cytotoxicity after 24 h even at a concentration of 1 mg/mL (Figure 3a). Then fluorescence imaging results identified the transport of Arg-Cdots inside cells with the help of liposomes. Compared to the cell group incubated with bare Arg-Cdots, the lipo@Arg-Cdots treated group emitted significantly enhanced multiple fluorescence under different excitations (Figure 3b). Figure 3c shows the difference of CEST contrast between labeled cells and unlabeled cells encapsulated in microcapsules. The labeled group showed a 50% higher CEST signal at +2 ppm than non-labeled one. This preliminary cell study clearly shows the feasibility of using Cdots as a safe diamagnetic CEST MRI contrast agent with excellent biocompatibility for cell labeling.Conclusions
In this study, we demonstrated that carbon nanodots exhibited a relatively sensitive, pH-dependent CEST MRI contrast effects. To the best of our knowledge, it is the first demonstration of using nanoparticles as diamagnetic CEST MRI contrast agents. Furthermore, the preliminary cell study proves the feasibility of using Cdots-liposome constructs to label cells.Acknowledgements
Supported by NIH grants R03EB021573, R01CA211087, R21CA215860, and R01EB015032.References
(1) Baker, S. N. and Baker, G. A. Luminescent Carbon Nanodots: Emergent Nanolights. Angew. Chem. Int. Ed. 2010, 49, 6726-6744.
(2) Zhang, J. and Yu, S. H. Carbon dots: large-scale synthesis, sensing and bioimaging. Mater. Today 2016, 19, 382-393.
(3) Gasperini, A. A. M. et al. Association between Cationic Liposomes and Low Molecular Weight Hyaluronic Acid. Langmuir 2015, 31, 3308-3317.
(4) Liu, G. et al. Monitoring Enzyme Activity Using a Diamagnetic Chemical Exchange Saturation Transfer Magnetic Resonance Imaging Contrast Agent. J. Am. Chem. Soc. 2011, 133, 16326.
(5) Chan, K. W. Y. et al. MRI-detectable pH nanosensors incorporated into hydrogels for in vivo sensing of transplanted-cell viability. Nat. Mater. 2013, 12, 268-275.
Figures