0106
Imaging glutathione depletion in the rat brain using ascorbate-derived hyperpolarized MR and PET probes1Radiology and Biomedical Imaging, University of California, San Francisco, San Francisco, CA, United States, 2UC Berkeley-UCSF Graduate Program in Bioengineering, University of California, Berkeley and San Francisco, CA, United States, 3Radiology, Memorial Sloan Kettering Cancer Center, New York, NY, United States
Synopsis
We studied brain redox capacity using ascorbate-derived hyperpolarized (HP) 13C MR and 11C PET probes. We first demonstrated the molecular transport and biodistribution features of the ascorbic acid (VitC)-dehydroascorbate (DHA) pair by leveraging both HP MR and PET modalities. We then showed that HP 13C DHA could detect redox modulation of the brain in a pharmacologic glutathione-depletion rat model. In conclusion, HP 13C DHA MR has the potential for non-invasive evaluation of brain redox capacity.
Introduction
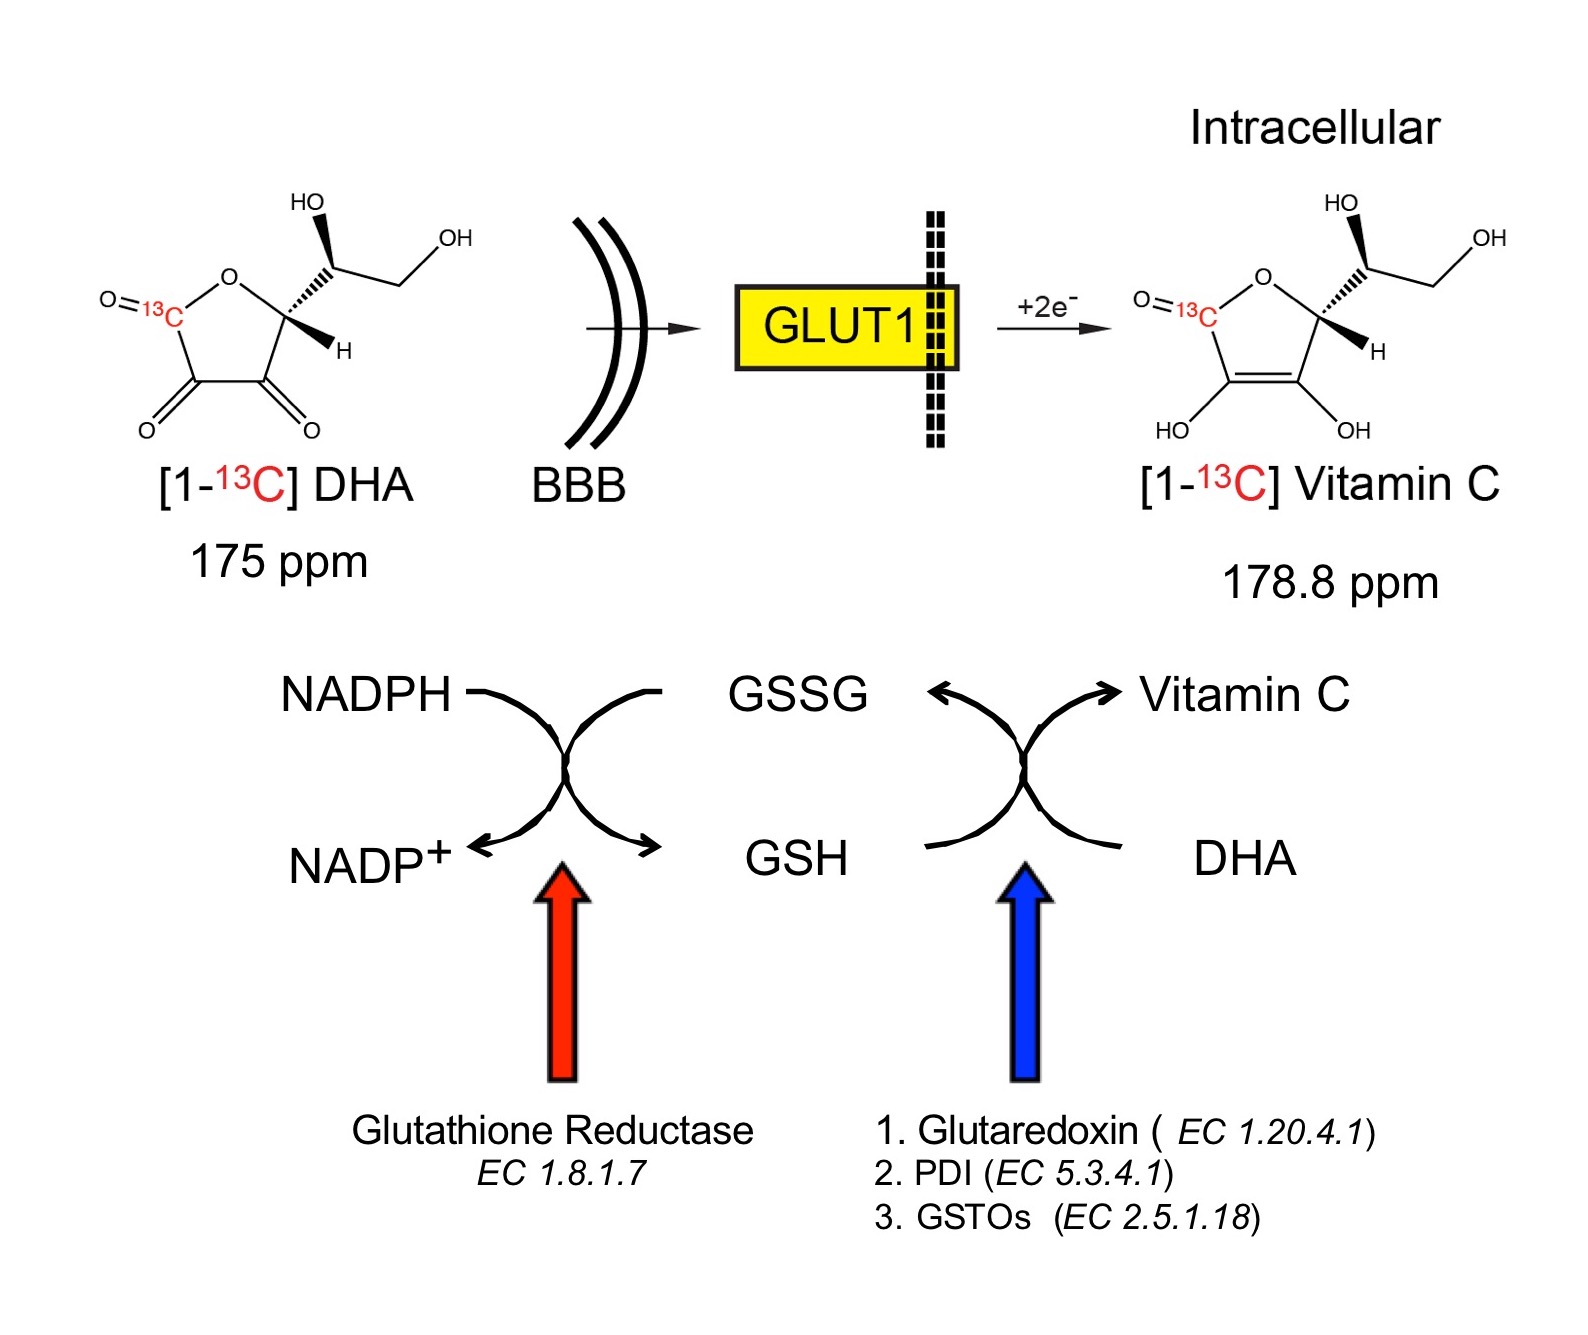
Dysregulated oxidative stress is implicated in neurodegenerative, neuropsychiatric and other brain disorders1,2. Non-invasive evaluation of redox capacity could provide insights into disease processes and monitor therapeutic response. Ascorbic acid (VitC) and dehydroascorbate (DHA) are a critical, high-concentration brain redox pair3,4, which in combination with glutathione (GSH) protect the brain against oxidative stress5 (Fig.1). Hyperpolarized (HP) MR with 13C DHA has enabled in vivo assessment of redox capacity in rodent prostate6, kidney7, and liver8. We hypothesized that HP-MR with ascorbates can also assess redox capacity of the brain. To this end, we first studied the transport and compartmentalization of DHA and VitC in the brain with HP 13C probes and 11C PET radiotracers. Then we modulated GSH content in rats and studied the changes in brain redox capacity using both HP-MR and PET.Methods
Ascorbate-derived probes and imaging methods: [1-13C] DHA and VitC were polarized as previously described9, and 1.3ml of 21mM DHA or 50mM VitC was subsequently injected via tail vein over 12 seconds. In vivo data were acquired on a 3T MR scanner using either a single-time-point 2D chemical shift imaging (CSI) sequence or dynamic 1D slice-selective spectroscopy. 11C DHA and VitC were synthesized using previously published methods10, and PET imaging on a μPET-CT scanner was performed 0-40 minutes after tail vein injection, followed by internalized radioactivity counts on dissected organs using a gamma counter 1 hour after injection (biodistribution study).
Five groups of Sprague-Dawley rats were studied: (1) 2D CSI with HP DHA and VitC, respectively, to study the transport and localization of metabolites in the head region; (2) dynamic 1D spectroscopy, at 1 day before and 2 hours after diethyl maleate (DEM) treatment (4.6mmol/kg IP)11, to study the real-time DHA-VitC conversion rate; (3) PET with 11C DHA and VitC, respectively, to study uptake and biodistribution features of ascorbates probes; (4) PET with 11C DHA on rats with and without DEM treatment to study 11C probe retention rate in oxidative stress; (5) in vitro GSH assay on brain tissue collected from a separate cohort of rats without prior studies to validate the redox modulation.
Results and Discussion
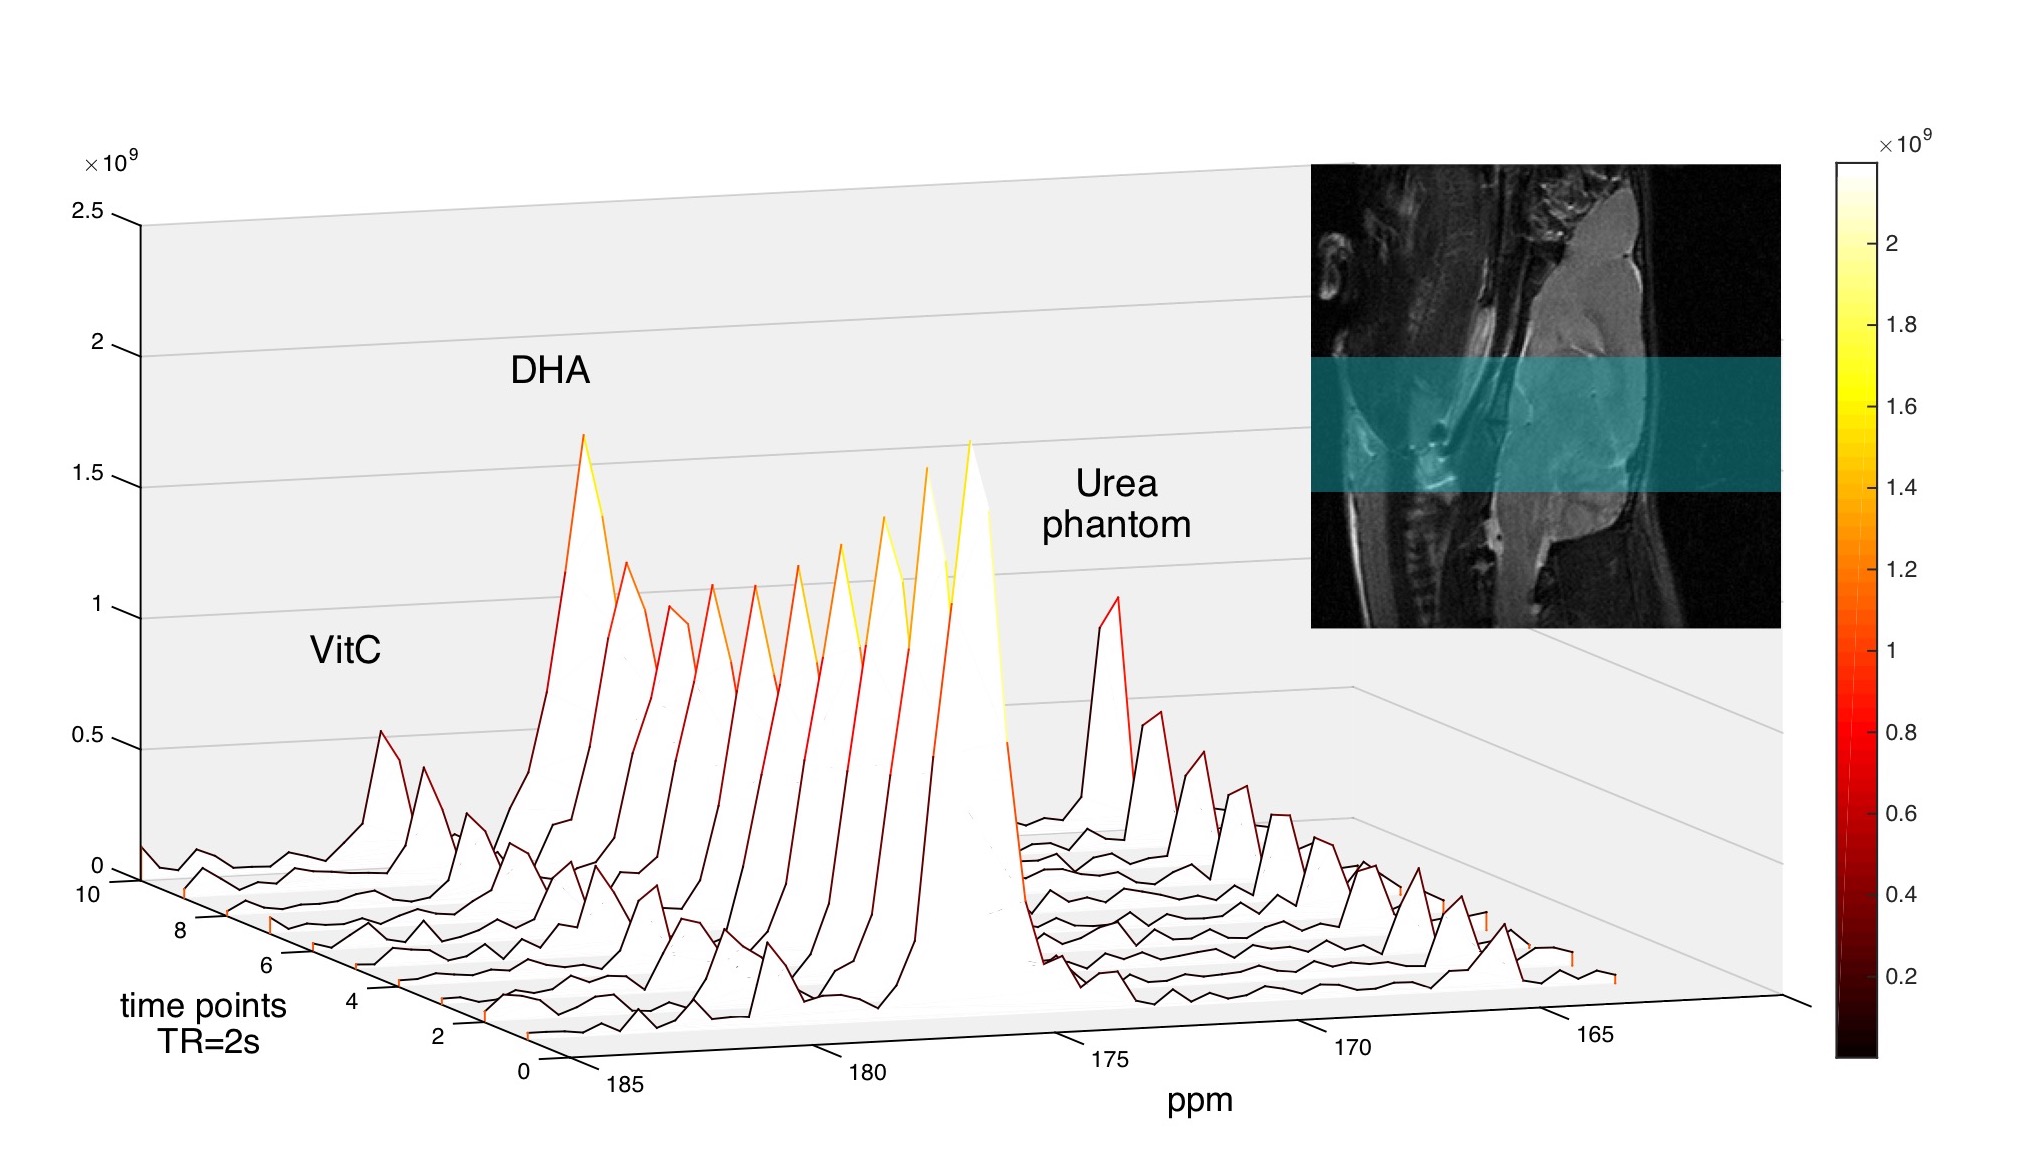
In the 2D CSI with HP DHA, VitC resonance is observed only in the brain voxels (Fig.2a), with VitC/(DHA+VitC) = 0.4757±0.1474 (n=6, estimated from 18 brain voxels), consistent with the transport and blood-brain-barrier penetration features of DHA10. In the 2D CSI with HP VitC (n=3), considerably lower VitC is observed in the brain than surrounding tissues, and no DHA resonances in observed in the brain (Fig.2b), consistent with the slow transport process of VitC3,10.
In the dynamic HP DHA study (Fig.3), we asked whether DHA-VitC conversion rate is correlated with GSH content. Since VitC is mainly produced in the brain while DHA presents in both brain and surrounding tissues, we focused analysis on the kinetic rates of VitC production. The apparent kinetic rate (KVitC) is estimated via linear fitting of dynamic VitC SNR after T1 decay correction, based on the pseudo-zero-order kinetic model assuming GSH or GLUT1 is the rate-limiting factor for DHA-VitC conversion. We found KVitC significantly decreased (to ~ 45% of baseline) after DEM treatment (Fig.4a). In vitro GSH assay confirmed that brain GSH content in the DEM-treated subjects is significantly lower than the control subjects (~ 45% of control) (Fig.4b).
To demonstrate the pseudo-zero-order kinetic model, dynamic 1D spectroscopy was repeated on a separate cohort of rats (n=3) with 12mM HP DHA (60% dose of control group), which showed similar KVitC and total VitC SNR to control group (Fig.4c), suggesting VitC production rate is independent of HP DHA concentration at our experimental dose.
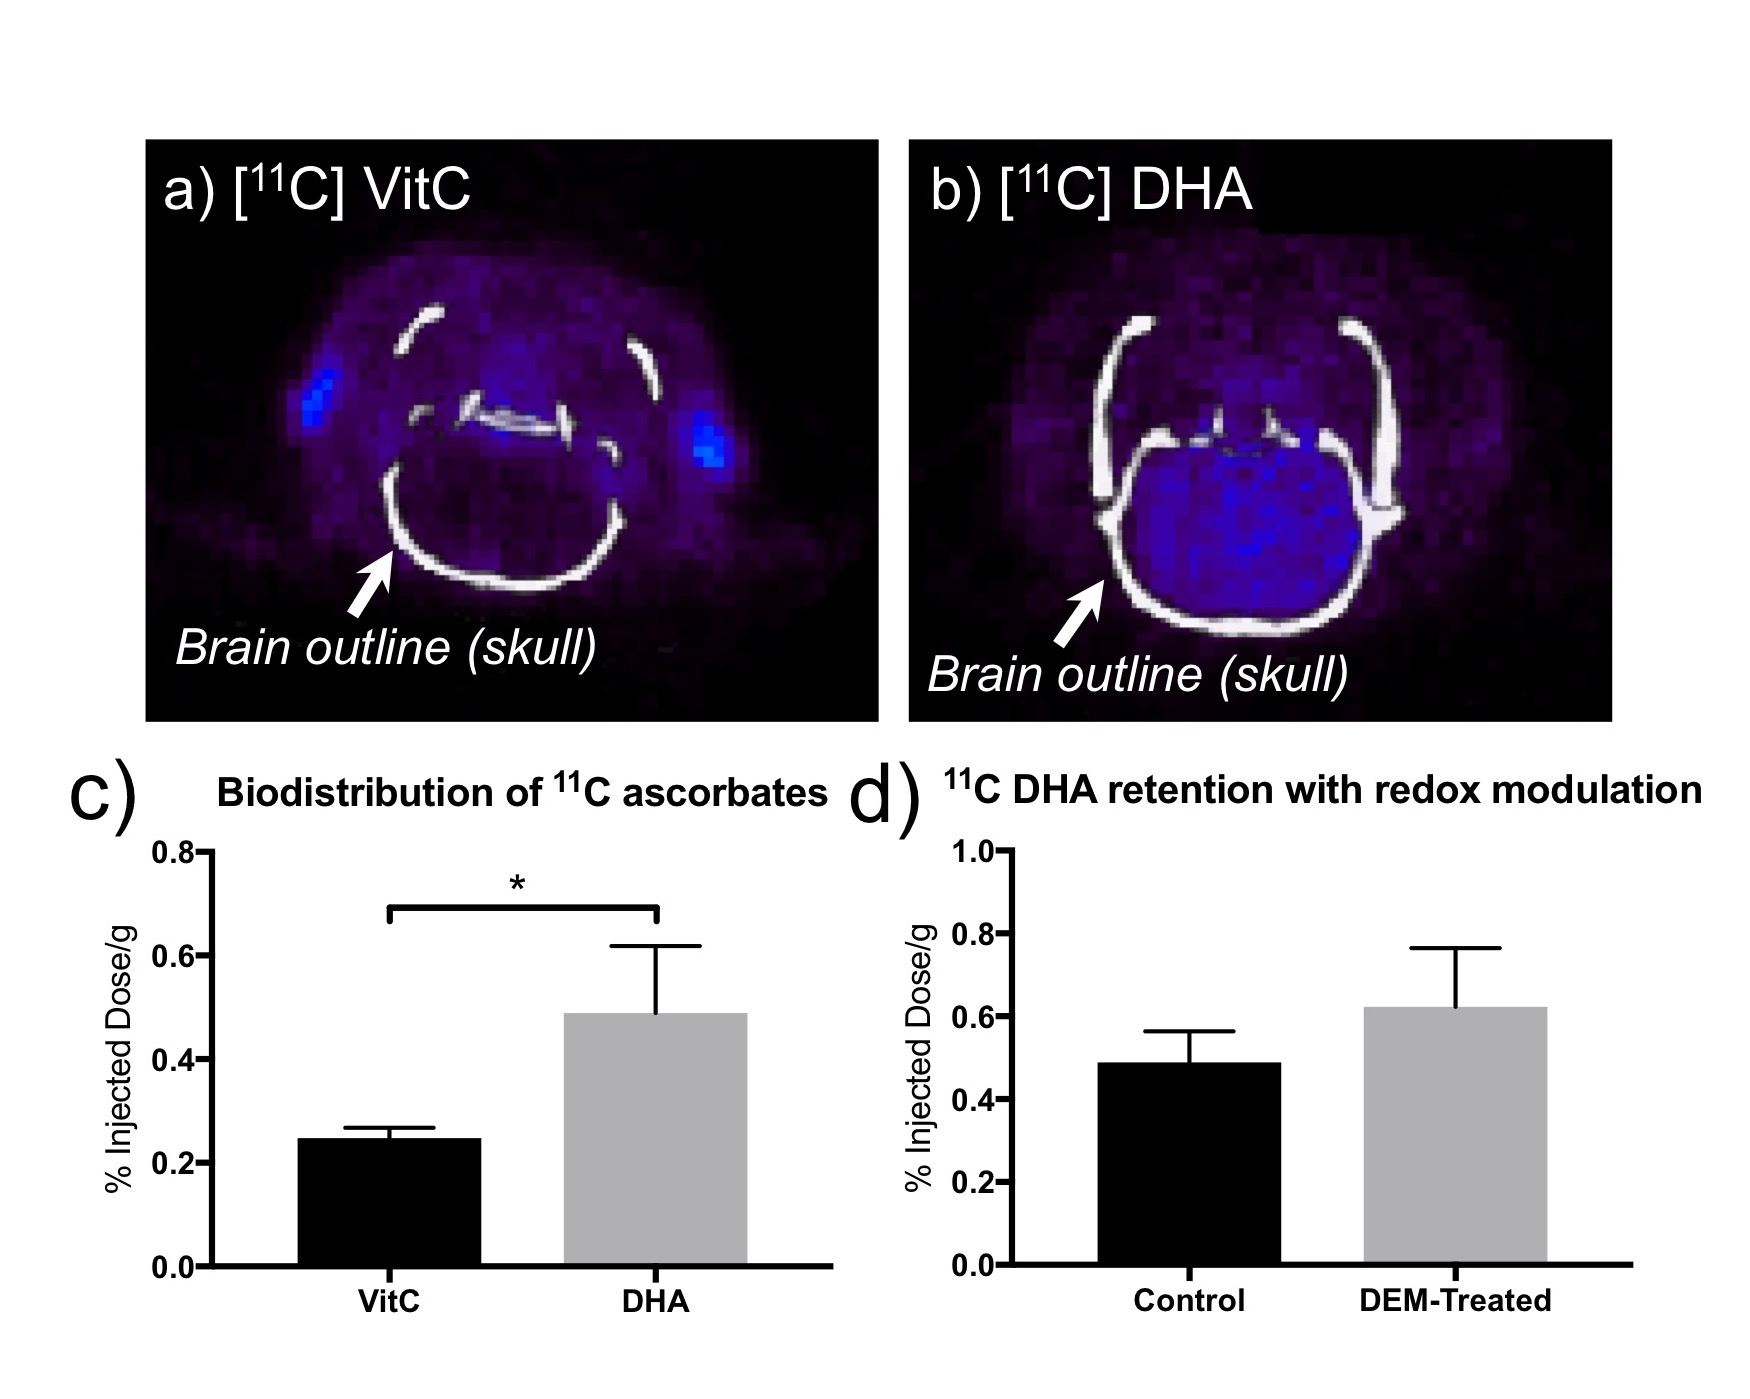
In PET studies with 11C ascorbates, 11C VitC showed less uptake in the brain than 11C DHA, consistent with HP-MR observations (Fig.5a, b, c). However, PET with 11C DHA showed no significant difference in 11C probe retention between control and DEM-treated subjects, i.e. insensitive to changes in redox capacity (Fig.5d). This exemplifies the advantage of studying real-time conversion by HP-MR over probe retention rate by PET.
Conclusion
We demonstrated the molecular transport and biodistribution features of DHA and VitC in the brain by both HP-MR and PET, and found that the kinetic rates of VitC production from HP DHA is correlated with brain GSH content. Hyperpolarized [1-13C]DHA can assess brain GSH content non-invasively, and potentially allow visualization of oxidative stress in numerous brain pathologies.Acknowledgements
This research is supported by NIH R01CA166766, P41EB013598, UCSF Department of Radiology and Biomedical Imaging seed grant. We thank Drs. Robert Bok, Romelyn Delos Santos for their assistance in experiments, and all members of David Wilson and John Kurhanewicz Labs.References
1. Gu, F., Chauhan, V. & Chauhan, A. Glutathione redox imbalance in brain disorders. Curr Opin Clin Nutr Metab Care 18, 89–95 (2015).
2. Bains, J. S. & Shaw, C. A. Neurodegenerative disorders in humans: the role of glutathione in oxidative stress-mediated neuronal death. Brain Res Brain Res Rev 25, 335–358 (1997).
3. Agus, D. B. et al. Vitamin C crosses the blood-brain barrier in the oxidized form through the glucose transporters. J Clin Invest 100, 2842–2848 (1997).
4. Cisternas, P. et al. The oxidized form of vitamin C, dehydroascorbic acid, regulates neuronal energy metabolism. J Neurochem 129, 663–671 (2014).
5. Meister, A. Glutathione, ascorbate, and cellular protection. Cancer Res 54, 1969s–1975s (1994).
6. Keshari, K. R. et al. Hyperpolarized [1-13C]dehydroascorbate MR spectroscopy in a murine model of prostate cancer: comparison with 18F-FDG PET. J Nucl Med 54, 922–928 (2013).
7. Baligand, C. et al. Hyperpolarized (13) C magnetic resonance evaluation of renal ischemia reperfusion injury in a murine model. NMR Biomed (2017). doi:10.1002/nbm.3765
8. Wilson, D. M. et al. Hyperpolarized (13)C spectroscopic evaluation of oxidative stress in a rodent model of steatohepatitis. Sci Rep 7, 46014 (2017).
9. Keshari, K. R. et al. Hyperpolarized 13C dehydroascorbate as an endogenous redox sensor for in vivo metabolic imaging. Proc Natl Acad Sci U S A 108, 18606–18611 (2011).
10. Carroll, V. N. et al. [(11)C]Ascorbic and [(11)C]dehydroascorbic acid, an endogenous redox pair for sensing reactive oxygen species using positron emission tomography. Chem Commun (Camb) 52, 4888–4890 (2016).
11. Weber, C. A., Duncan, C. A., Lyons, M. J. & Jenkinson, S. G. Depletion of tissue glutathione with diethyl maleate enhances hyperbaric oxygen toxicity. Am J Physiol 258, L308-12 (1990).
Figures