0103
Multimodal Assessment of Orbital Immune Cell Infiltration and Tissue Remodeling During Development of Graves’ Disease by 1H/19F MRI1Experimental Cardiovascular Imaging, Heinrich Heine University, Düsseldorf, Germany, 2University of Essen, Essen, Germany
Synopsis
The purpose of the present study was to evaluate key molecular and cellular features of Graves’ orbitopathy by simultaneous monitoring of alterations in morphology, inflammatory patterns, and tissue remodeling. Beyond anatomical 1H MRI, we employed T2 mapping for visualization of edema, chemical exchange saturation transfer for detection of hyaluronan, and 19F MRI for tracking of in situ labeled immune cells after intravenous injection of perfluorcarbons. In particular, 19F MRI allowed a sensitive demarcation of inflammatory foci in the orbit, even when other markers indicated only weak or no signs of tissue alterations.
Introduction
Graves’ disease is an autoimmune condition of the thyroid gland caused by thyrotropin receptor (TSHR) stimulating autoantibodies, leading to overproduction of thyroid hormones. A frequent complication is Graves’ orbitopathy (GO), also known as thyroid eye disease, where inflammation of the orbit associated with increased adipogenesis and deposition of hyaluronan results in detrimental remodeling of the orbital soft tissue (1,2) – in the worst case, it can lead to blindness.
Treatment of GO patients remains difficult, since current diagnostics are limited in encompassing the complex phenotype and the highly variable pathogenesis of the disease. Beyond careful ophthalmological examination when clinical symptoms occur, modern imaging modalities are mainly confined to visualize the expansion of pathologically affected orbital tissue (3,4). However, patient-specific therapy would greatly benefit from additional knowledge about the degree of the underlying inflammation and a more detailed characterization of the ongoing remodeling processes. Thus, the present study aimed at developing an MRI-based approach which takes account of the complex pathogenesis of GO and addresses several key characteristics of the disease in one imaging session.
Materials and Methods
To this end, we utilized a murine model of GO induced
by immunization with a human TSHR A-subunit plasmid (5,6). Altogether 52 mice were used: 27 GOs and 25 controls immunized with b-galactasidose
plasmid (Ctrl). From these, 17 GO and 12 Ctrl mice were subjected to multimodal
MRI at 9.4T, while 23 mice only underwent histology. Beyond anatomical 1H
MRI, we employed T2 mapping for visualization of edema, chemical exchange
saturation transfer (CEST) for detection of hyaluronan, and 19F MRI
for tracking of in situ labeled
immune cells after intravenous injection of perfluorcarbons (PFCs). The full
experimental protocol took around 60-90 min and was well tolerated by all mice.Results and Discussion
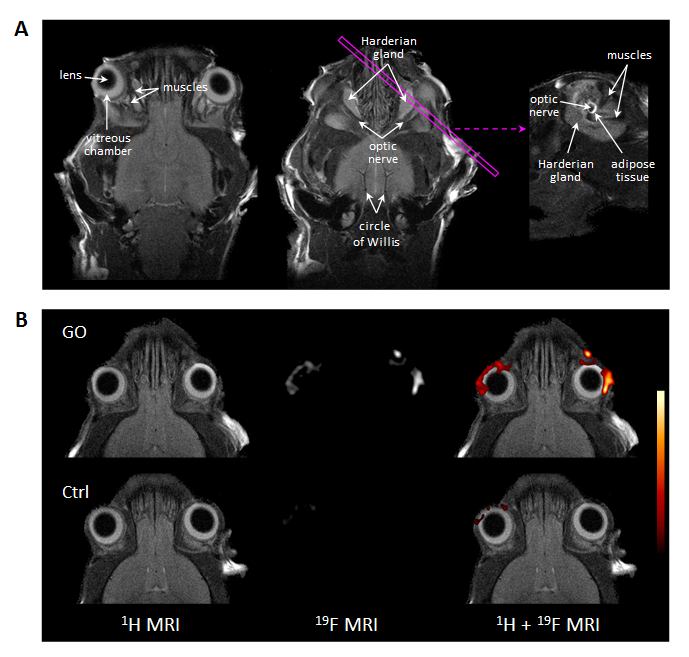
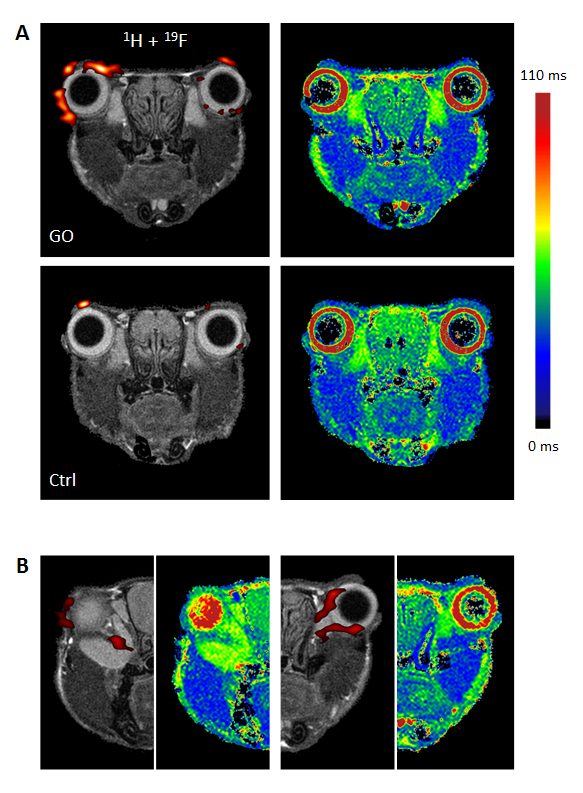
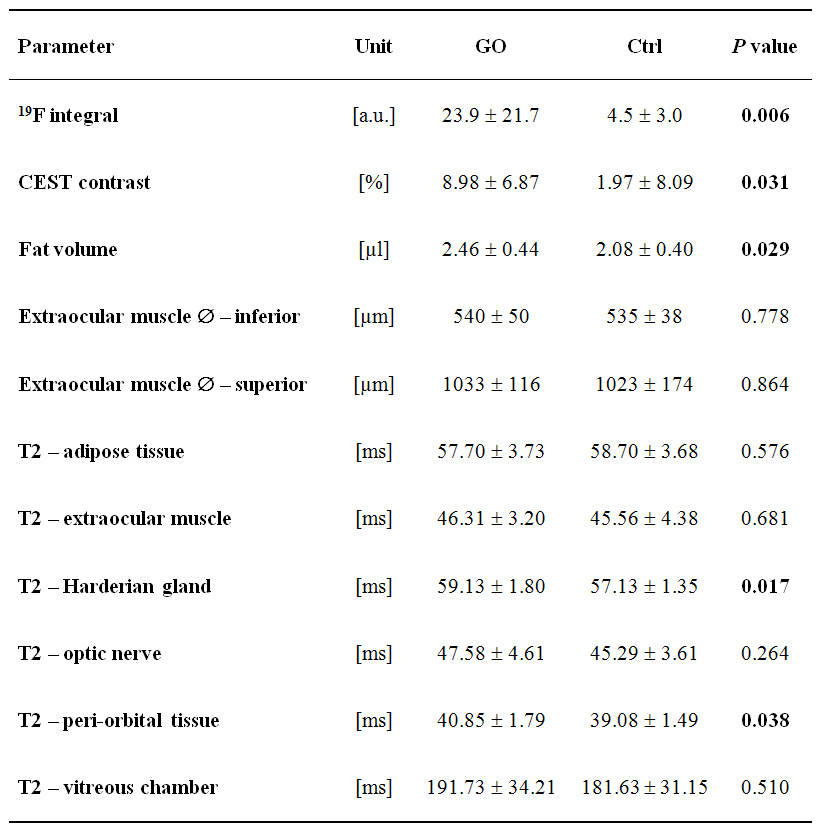
In T2-weighted 1H MRI scans acquired with an in-plane resolution of 50x50 µm2, the anatomy of the murine orbit could be visualized in great detail. Anatomically corresponding 1H and 19F MR images from GO mice demonstrated a marked accumulation of 19F signal around the eyeballs (Figure 1). Besides the predominant peri-orbital localization of infiltrated PFCs, retro-orbital regions around the optic nerve were affected too (Figure 2). In contrast, healthy Ctrls exhibited only minor 19F signals in the orbit (Figure 1+2). In parallel, T2 mapping indicated onset of edema in peri-orbital tissue and adjacent ocular glands (P=0.038/0.017; Figure 2, Table 1).
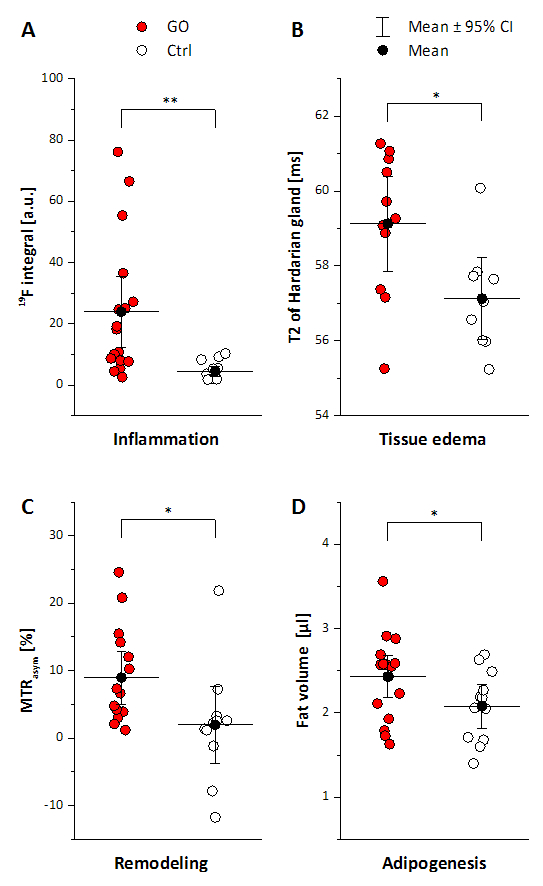
Accompanying remodeling processes in the orbital extracellular matrix were assessed by exploiting the strong susceptibility of CEST signals to alterations in tissue GAG/hyaluronan content (7). Orbits of GO mice clearly exhibited enhanced CEST contrast as compared to Ctrl mice (Table 1; P=0.031). Concomitanty, a moderate expansion of retrobulbar fat (P=0.029) was apparent, but no signs for extraocular myopathy were detectable (Table 1). Overall, the MR data reveal characteristics of GO in mice to parallel those in human patients, recapitulating orbital inflammation and expansion of the orbital tissues due to edema, adipogenesis, and deposition of hyaluronan. 19F MRI provided the highest significance level to discriminate between healthy and diseased mice (P=0.006, Figure 3), and furthermore showed the best correlation with clinical eye signs (P=0.0007). Linear regression of the significant different MRI parameters, however, revealed only weak or no correlations indicating a primarily independent development/progression of the disease characteristics. This assumption is further supported by the occurrence of 19F signals at sites that were not characterized by increased T2, CEST contrast or adipose tissue expansion.
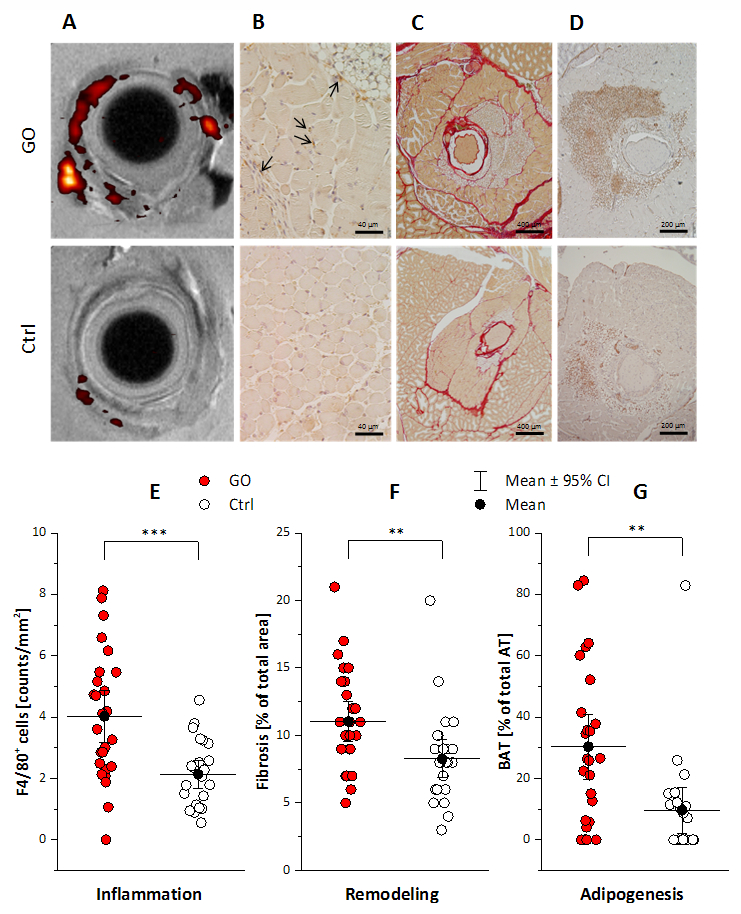
Infiltration patterns of inflammatory cells were corroborated by examination of excised tissue after fixation: 3D high resolution 1H/19F MRI (isotropic voxel size 40 µm) confirmed the prevalent PFC deposition in the peri-orbital tissue of GO mice. Further histological analysis of orbital tissue with regard to immune cell infiltration, fibrosis, and adipogenesis mainly supported the in vivo findings (Figure 3). Quantification of these data revealed an elevated abundance of macrophages, increased collagen deposition, and enlargement of brown/beige fat depots in orbits of GO compared to Ctrl mice. The differences and significance levels for the individual parameters were similar to the MRI data (Figure 4).
Conclusion
In the present study, we demonstrate that multimodal 1H/19F MRI permits a comprehensive analysis of several hallmarks of GO pathology with simultaneous assessment of orbital immune cell infiltration, development of edema, alterations in the extracellular matrix, and quantification of fat and muscle dimensions. In particular, 19F MRI allowed a sensitive demarcation of inflammatory foci in the orbit, even when other markers indicated only weak or no signs of tissue alterations.Acknowledgements
We gratefully thank Bodo Steckel (Heinrich Heine University), Mareike Horstmann (University of Duisburg-Essen, Germany) and Alexandra Brenzel (Imaging Center Essen IMCES, University Duisburg-Essen) for excellent technical assistance.References
- Bahn RS. Graves’ ophthalmopathy. N Engl J Med. 2010;362(8):726–738.
- Shan SJC, Douglas RS. The pathophysiology of thyroid eye disease. J Neuroophthalmol. 2014;34(2):177–185.
- Gonçalves ACP, Gebrim EMMS, Monteiro MLR. Imaging studies for diagnosing Graves’ orbitopathy and dysthyroid optic neuropathy. Clinics. 2012;67(11):1327–1334.
- Kawa MP, Machalińska A, Wilk G, Machaliński B. Graves’ ophthalmopathy imaging evaluation. In: Soto DS, editor. Thyroid Disorders - Focus on Hyperthyroidism. Rijeka: InTech; 2014. p. 141–167.
- Moshkelgosha S, So P-W, Deasy N, Diaz-Cano S, Banga JP. Cutting edge: retrobulbar inflammation, adipogenesis, and acute orbital congestion in a preclinical female mouse model of Graves’ orbitopathy induced by thyrotropin receptor plasmid in vivo electroporation. Endocrinology. 2013;154(9):3008–3015.
- Berchner-Pfannschmidt U, Moshkelgosha S, Diaz-Cano S, et al. Comparative assessment of female mouse model of Graves’ orbitopathy under different environments, accompanied by proinflammatory cytokine and T-cell responses to thyrotropin hormone receptor antigen. Endocrinology. 2016;157(4):1673–1682.
- Ling W, Regatte RR, Navon G, Jerschow A. Assessment of glycosaminoglycan concentration in vivo by chemical exchange-dependent saturation transfer (gagCEST). Proc Natl Acad Sci U S A. 2008;105(7):2266–2270.
Figures