0102
A novel iterative sparse deconvolution method for multicolor 19F-MRI1Department of Biomedical Engineering and Physics, Academic Medical Center, Amsterdam, Netherlands, 2Translational and Molecular Imaging Institute, Icahn School of Medicine at Mount Sinai, New York, NY, United States, 3Department of Radiology, Academic Medical Center, Amsterdam, Netherlands
Synopsis
We introduce a new deconvolution approach for
Introduction
MRI with 19F-labeled nanoparticles is rapidly gaining popularity in the pre-clinical arena as a method to quantify the presence of immune and inflammatory cells. These nanoparticles are avidly taken up by the monocyte-macrophage system after intravenous injection, and then trafficked to sites of inflammation. 19F nanoparticle MRI is therefore a promising approach for the development of quantitative inflammation imaging in various diseases. The several fluorinated compounds available for nanoparticles formulation, such as Perfluorooctylbromide(PFOB) and perfluoro-crown ether(PFCE), differ in terms of chemical structure and characteristic MR spectra. This enables unambiguous discrimination using imaging or spectroscopy, which can be exploited to simultaneously discriminate populations of labeled cells, a concept referred to as “multicolor” 19F-MRI. Several methods (such as CSI, spectrally-selective excitation, and DIXON1,2) have been explored to image multiple fluorinated compounds simultaneously, and compensate for the chemical shift artifacts associated with complex 19F spectra. However, these methods require lengthy acquisitions and deliver suboptimal SNR per unit time, and are therefore not well-suited for in vivo 19F MRI within feasible scan times. Alternatively, deconvolution-based approaches have been proposed to correct for chemical shift artifacts3,4.
We introduce a new deconvolution approach for multicolor imaging of different 19F compounds with complex spectra. The method exploits the sparse nature of 19F images by iterative sparse deconvolution, removes the chemical shift artifacts associated with multiple peaks in the 19F spectra, and efficiently separates multiple 19F compounds.
Methods
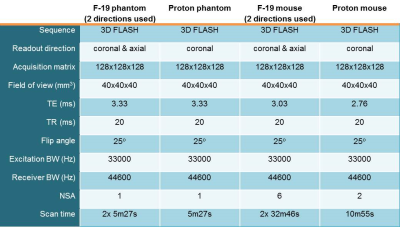
Theory: Our proposed method is based on the sequential acquisition of images with orthogonal readout directions. While in our experiments we have used a 3D gradient recalled echo(GRE) acquisition (see Table 1 for imaging parameters), this method does not impose any specific requirements in this sense, and can be applied to 2D or 3D imaging of any type (e.g. FSE/GE) optimized to SNR per unit time. However, imaging requires a broadband excitation to excite all peaks in the 19F spectra and a Cartesian or pseudo-Cartesian (in 3D) k-space filling, which leads to well-defined chemical shift artifacts. The acquisitions with two orthogonal readout directions result in two k-spaces, referred to as the column vectors yh and yv. The full measurement model is described by:
$$\begin{pmatrix}\vec{y}_{h}\\\vec{y}_{v}\end{pmatrix}=\begin{pmatrix}{FC_h}&{FI}\\{FC_v}&{FI}\end{pmatrix}\begin{pmatrix}\vec{x}_{PFOB}\\\vec{x}_{PFCE}\end{pmatrix}+\vec{\eta}=M\vec{x}+\vec{\eta}$$In this model, $$$F$$$ is the Fourier operator, $$$C_h$$$ and $$$C_v$$$ are the circular convolution operators which convolve an image with the spectrum of PFOB in either readout direction with the relative voxel shifts calculated based on the PFOB spectrum with 7 peaks, and $$$\vec{\eta}$$$ represents measurement noise. Because the PFCE spectrum has only one peak at 0 ppm, the sampling convolution operator of this compound is the identity operator $$$I$$$. Solving for $$$\vec{x}$$$ yields separate images for PFOB and PFCE. While this can be solved as a pseudo-inverse problem, to avoid noise amplification in the reconstruction, the equation is rewritten as the following optimization problem: $$\vec{x}=\mathrm{arg\,min}_{x}\:||\vec{y}-M\vec{x}||_{2}^{2}+\lambda||W \vec{x}||_{1}$$ where $$$W$$$ is a sparsifying transform operator, such as a wavelet transform or a total-variation operator, and $$$M$$$ contains the Fourier and convolution matrices. This equation is solved by a non-linear conjugate gradient algorithm5. Numerical measurement simulations were performed for various SNR levels, to compare the two reconstruction approaches.
Imaging experiments: Acquisitions were performed with a Bruker 7T pre-clinical scanner. Three 1 ml Eppendorf cups containing PFOB or PFCE and one with a 50%/50% PFOB/PFCE mixture were measured. Secondly, a demonstration of our concept was performed in a mouse injected with a PFOB emulsion in both hind leg muscles, and a PFCE emulsion in its left leg only. Scan parameters are listed in Table 1.
Results and discussion
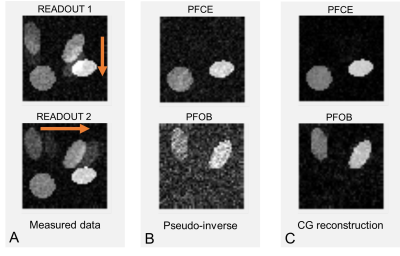
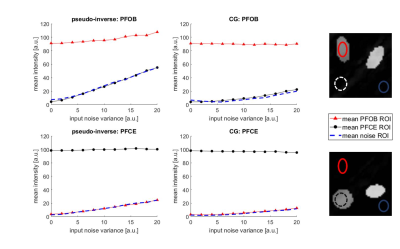
Figure 1 shows numerical simulation results. Two readout directions were simulated, and Gaussian noise was added to the k-space (1A). Reconstruction was performed either as multiplication with the pseudo-inverse (1B) or by using a conjugate gradient method (1C). Importantly, in the CG algorithm, the mean signal intensity is independent of noise level, and the signal of the other compound is fully removed (Fig.2).
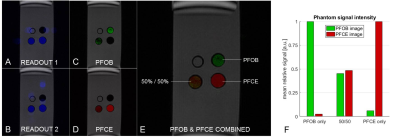
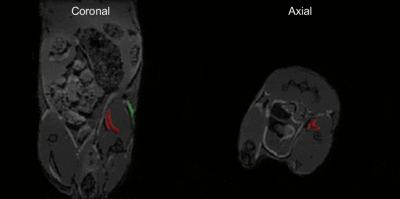
For the phantom bottle scan (Fig.3), we could successfully separate the signal of the two compounds. Relative signal intensity in the mixture phantom was consistent with the compound concentrations. Figure 4 shows slices of the mouse scan. The PFOB and PFCE signal locations are consistent with the injection locations and overlay well with the proton image.
In addition to increased noise robustness, this method gives us flexibility in undersampling, enabling compressed sensing acceleration. Furthermore, this model can easily be expanded to more readout directions and more than two compounds with complex spectra.
Conclusion
We successfully implemented a sequence-independent method for simultaneously measuring two 19F-compounds. Future work will focus on k-space undersampling.Acknowledgements
No acknowledgement found.References
[1] van Heeswijk, Ruud B., et al. "Chemical shift encoding (CSE) for sensitive fluorine‐19 MRI of perfluorocarbons with complex spectra." Magnetic Resonance in Medicine (2017).
[2] Ludwig, Kai D., et al. "A chemical shift encoding (CSE) approach for spectral selection in fluorine‐19 MRI." Magnetic Resonance in Medicine (2017).
[3] Lee, H. K., and Orhan Nalcioglu. "Reblurred deconvolution method for chemical shift removal in F‐19 (PFOB) MR imaging." Journal of Magnetic Resonance Imaging 2.1 (1992): 53-61.
[4] Meissner, Mirko, et al. "Revealing signal from noisy 19F MR images by chemical shift artifact correction." Magnetic resonance in medicine 73.6 (2015): 2225-2233.
[5] Lustig, Michael, David Donoho, and John M. Pauly. "Sparse MRI: The application of compressed sensing for rapid MR imaging." Magnetic resonance in medicine 58.6 (2007): 1182-1195.
Figures
