0101
Evaluation of microstructure heterogeneity from diffusion q-space imaging (QSI), diffusion weighted imaging (DWI) and non-Gaussian diffusion models in whole breast tumour1Aberdeen Biomedical Imaging Centre, University of Aberdeen, Aberdeen, United Kingdom, 2Breast Unit, Aberdeen Royal Infirmary, Aberdeen, United Kingdom, 3School of Medicine, University of Aberdeen, Aberdeen, United Kingdom, 4Pathology Department, Aberdeen Royal Infirmary, Aberdeen, United Kingdom, 5Francis Crick Institute, London, United Kingdom
Synopsis
QSI was compared against conventional DWI and non-Gaussian diffusion models, namely diffusion kurtosis imaging (DKI) and stretched-exponential model (SEM) to evaluate diffusivity heterogeneity for profiling breast tumour cell diversity. We investigated whole breast tumours excised from surgery, with imaging performed overnight on the same day on a clinical system. Asymmetry in diffusivity distribution was quantified as histogram skewness, median and 25th-percentile. Correlation analysis was performed to compare QSI against other models. The skewness of diffusivity distribution derived from QSI was the highest among the models and provided a wider spread of values across cohort, allowing more sensitive clinical applications.
Introduction
Diffusion weighted imaging (DWI) is widely applied for breast cancer diagnosis and prognosis, measuring the changes in the diffusivity of water as a proxy of tumour tissue microstructure. The spatial heterogeneity of the whole tumour, mathematically derived as the asymmetry of diffusivity distribution, is a reflection of cell diversity and is a sensitive response marker to chemotherapy1,2. However, heterogeneity derived from DWI only provides a limited approximation of the underlying cell diversity, due to a crude assumption of free unimpeded diffusion of water3-5. The non-Gaussian diffusion models, namely diffusion kurtosis imaging (DKI) and stretched-exponential model (SEM) have been developed to account for the restriction in diffusion, reducing distortion in diffusivity through kurtosis (AKC) and stretch factor (ALPHA) respectively3,4. Q-space imaging (QSI) observes the diffusion pattern without prior assumption6, and has been shown to be sensitive to cell geometry6 and malignant transformation7. However, the original QSI implementation requires hardware capability (field gradient) not commonly available in clinical setting. The introduction of the QSI expansion model8 negates this challenge, allowing investigation at a cellular scale relevant to breast cancer on clinical systems. We hypothesised that QSI produces highest asymmetry in diffusivity distribution compared to DKI, SEM and conventional DWI in whole breast tumours.Methods
Twenty female patients (age 35-78 years, 10 grade II and 10 grade III) with invasive ductal carcinoma undergoing wide local excision surgery were enrolled. To ensure no delay to pathological reporting, formalin was added to the excised whole tumour specimens and imaged same day overnight. NHS Research Ethics Committee approved the study and prior written informed consent was obtained.
Image Acquisition: Images were acquired on a clinical 3T MRI scanner (Achieva TX, Philips Healthcare, Netherlands) using body coil for transmission and a 32-channel coil as receiver. Three diffusion acquisitions were performed using multi-shot pulsed gradient spin echo sequence, averaged over 3 orthogonal diffusion directions, with FOV of 141x141mm2, 2.2mm slice thickness, matrix size of 64x64, in plane resolution of 2.2x2.2mm2, over 7–10 slices depending on tumour size and saturation bands to supress adjacent formalin signal. Acquisition 1 (DWI) was performed over 2 b-values of 0-800s/mm2, with diffusion time δ/Δ of 15.3/27.5ms, TR/TE of 3000/70ms, single average. Acquisition 2 (DKI and SEM) was performed over 16 equidistant b-values from 0-2400s/mm2, δ/Δ of 18.7/31.5ms, TR/TE of 3100/82ms, 2 averages. Acquisition 3 (QSI) was performed over 32 equidistant q-values from 10.4-655cm-1 (to b-value of 5,000s/mm2), δ/Δ of 24.9/37.8ms, TR/TE of 5900/94ms, single average.
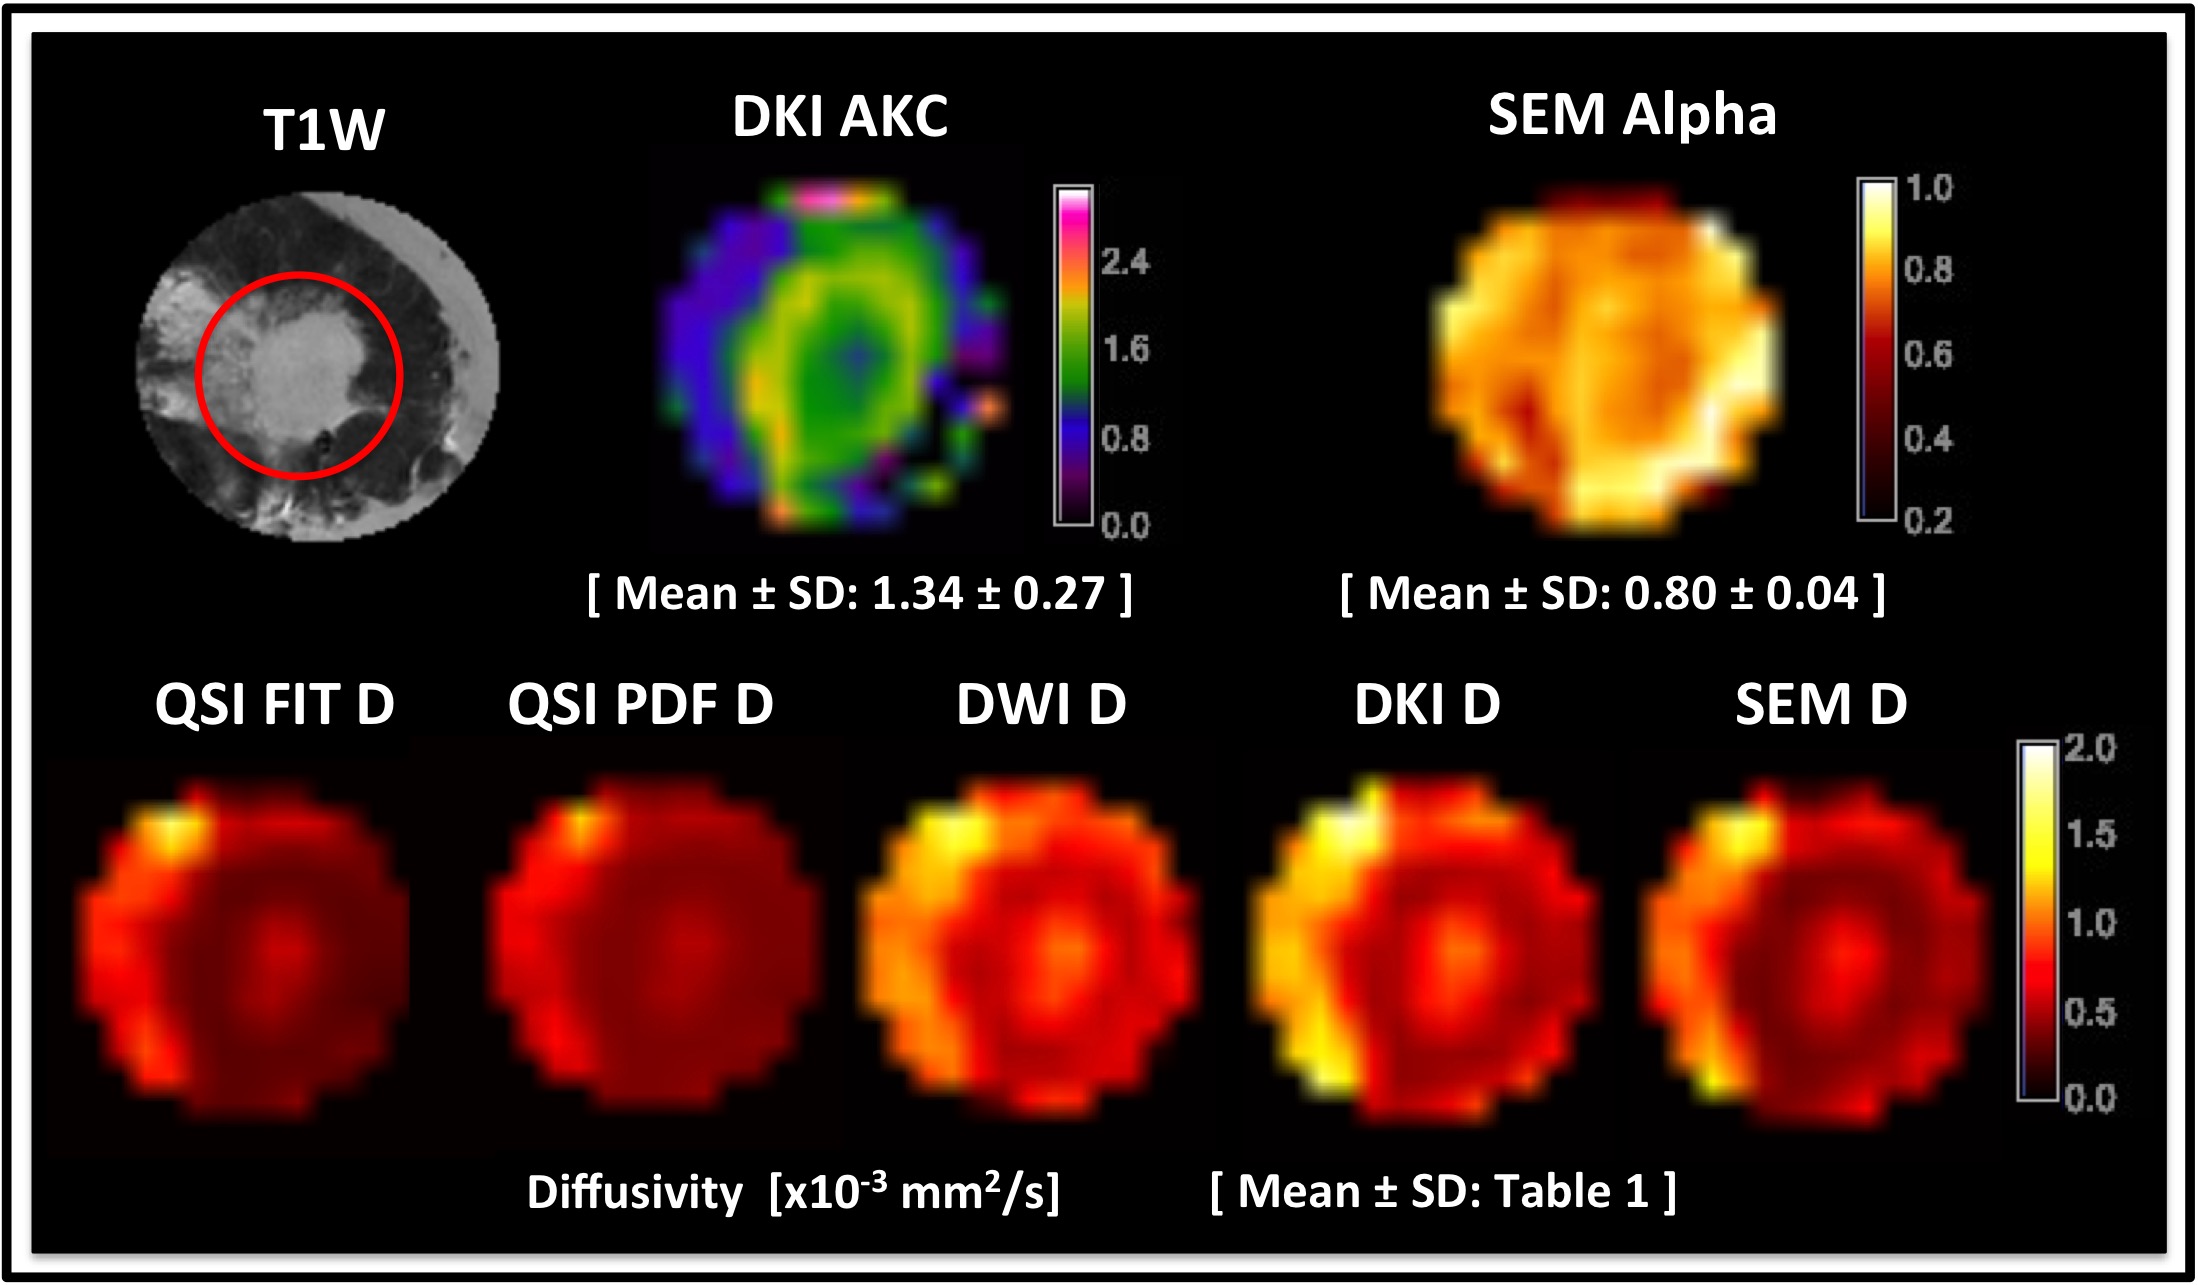
Image Analysis: Diffusivity images from DWI were calculated using logarithmic ratio (Acquisition 1). Diffusivity, and respective AKC and ALPHA images were computed through fitting DKI and SEM models (Acquisition 2)3,4. Two QSI approaches of Fourier transform (QSI PDF) and non-linear fitting approach (QSI FIT) were used to derive diffusivity images converted from diffusion root-mean-squared displacement (Acquisition 3)8,9.
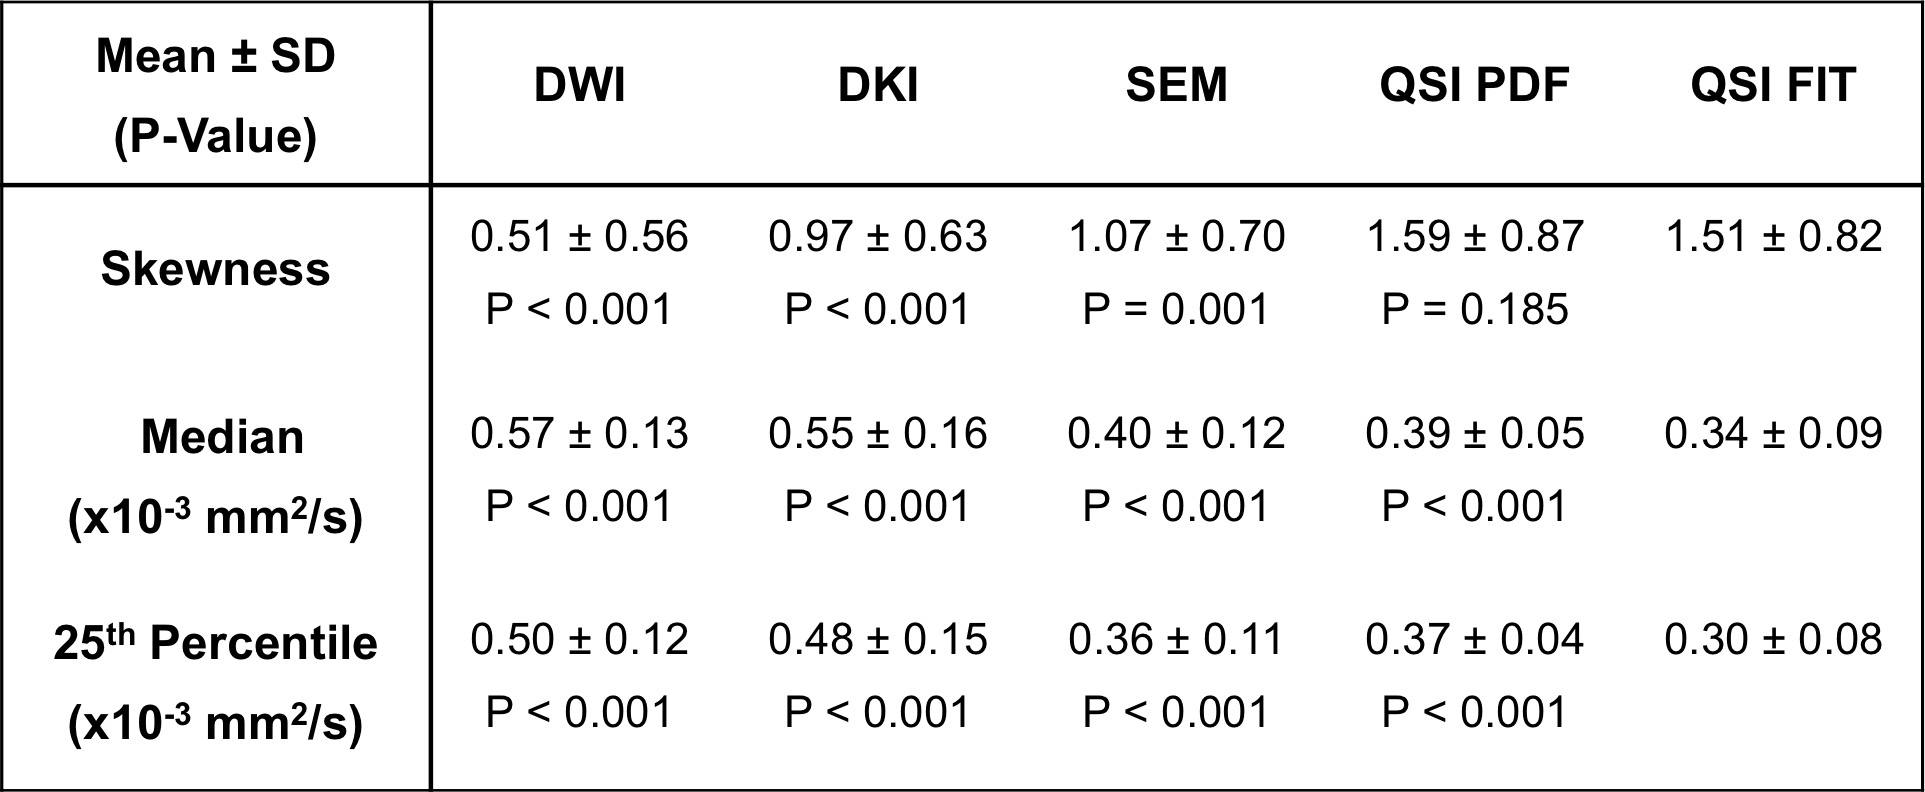
Statistical Analysis: Regions of interest were drawn to delineate tumour core with reference to anatomical and b=800s/mm2 DWI images in MRIcron (University of South Carolina, USA). The asymmetry of diffusivity distribution of each model was quantified as skewness, median and 25th-percentile. Subsequently QSI FIT results were compared against those from other models using paired t-test and correlation analysis.
Results
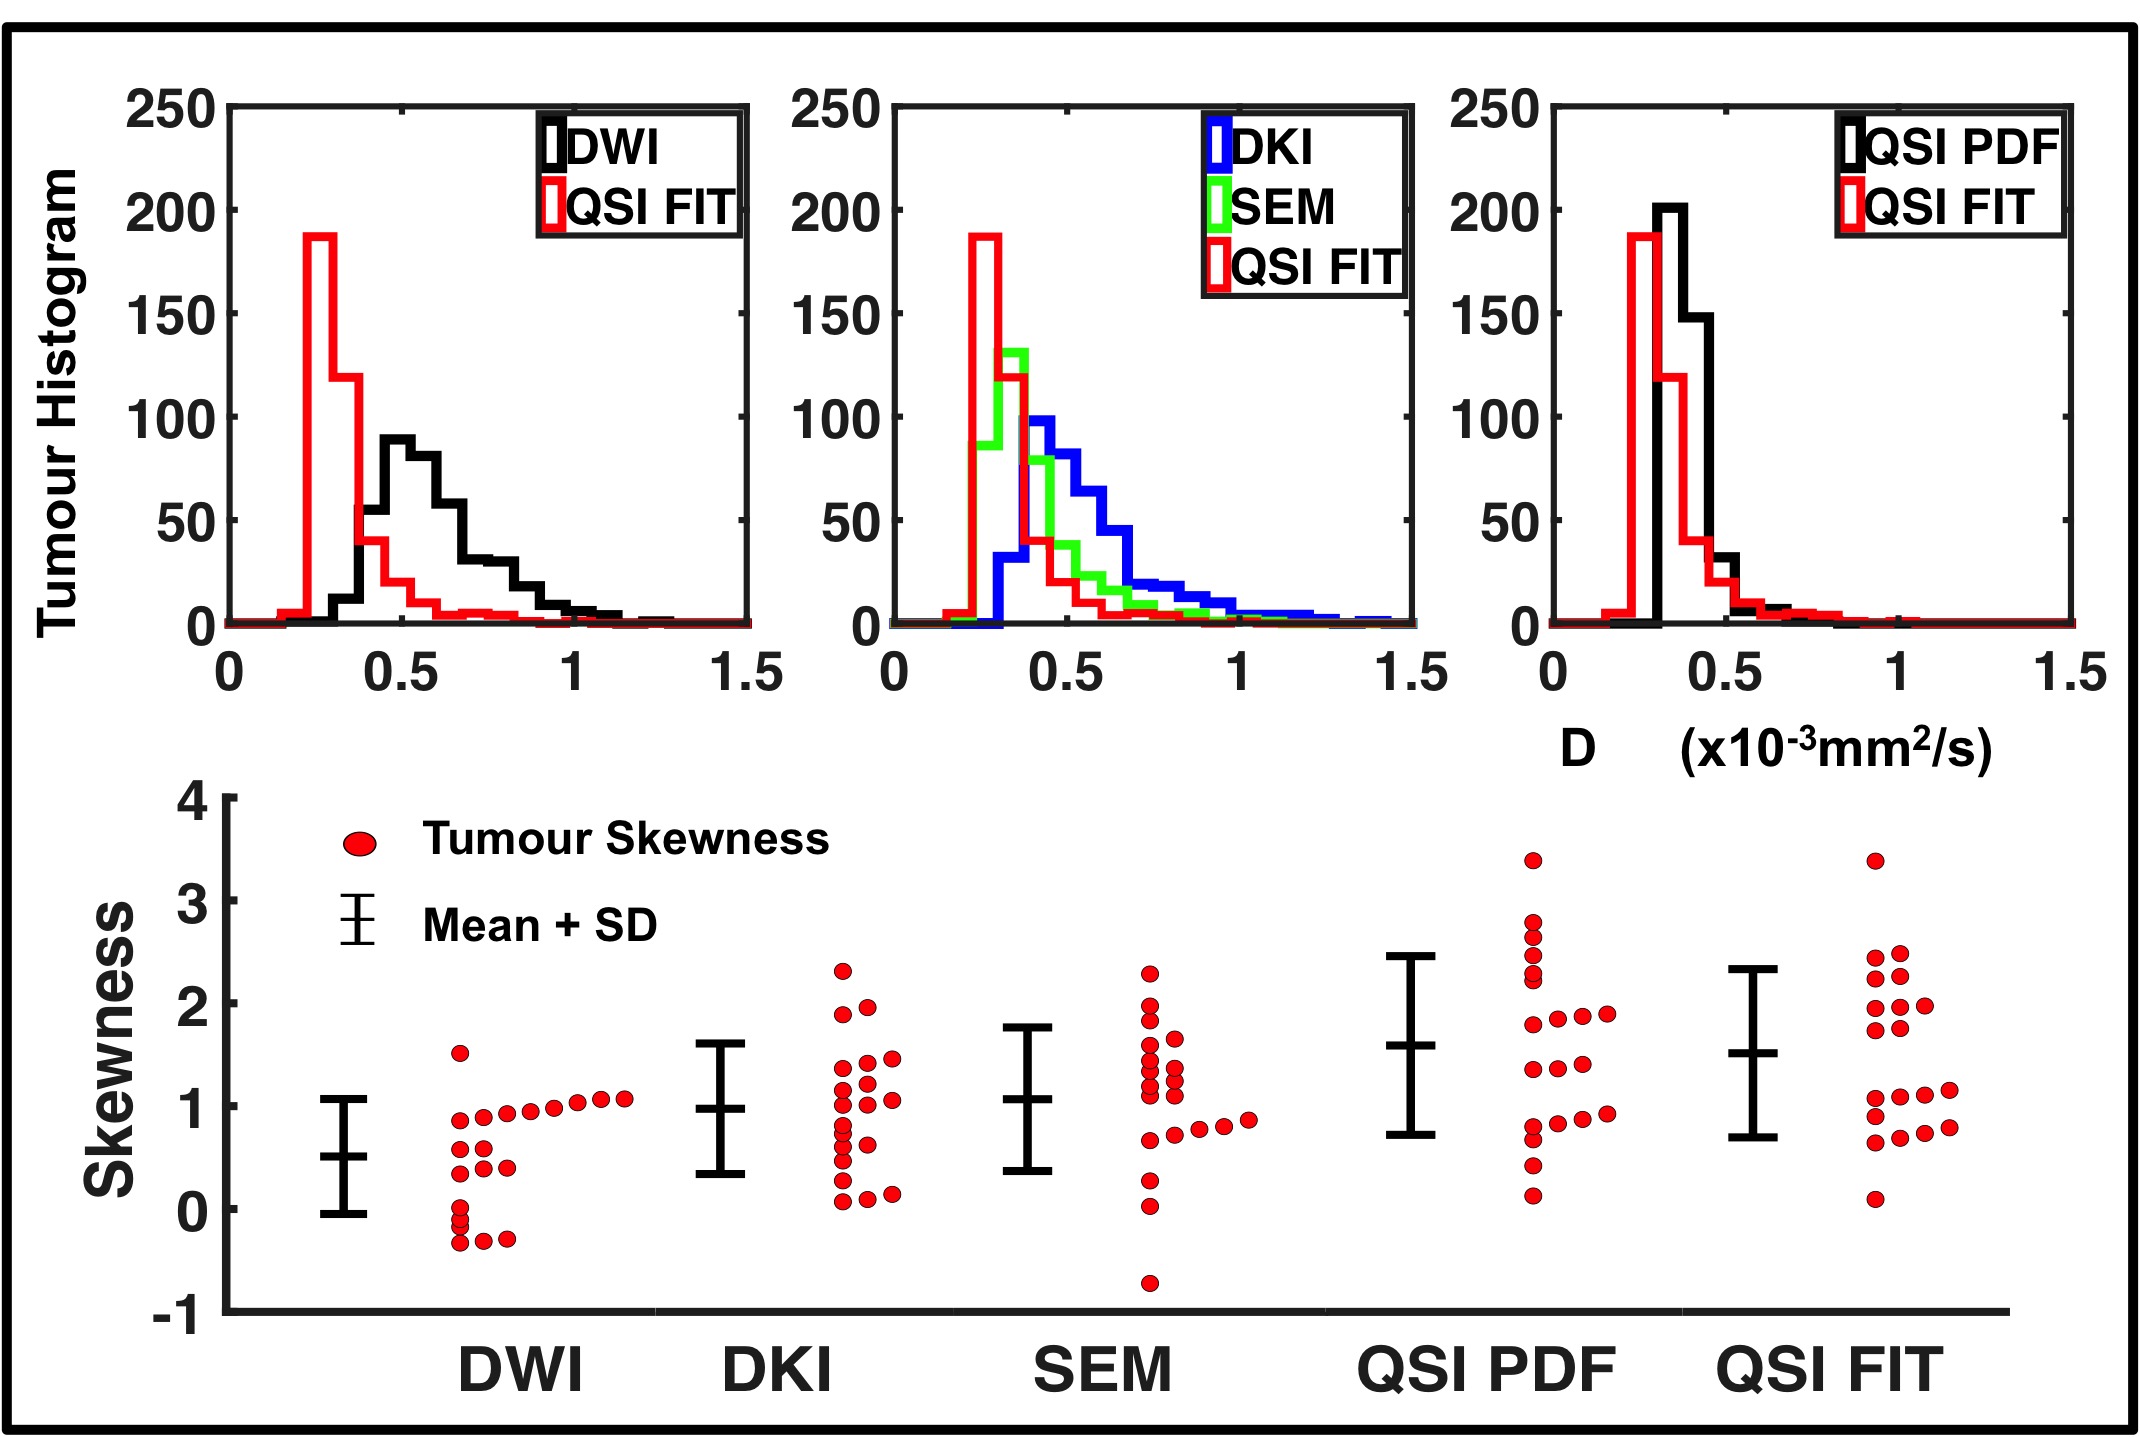
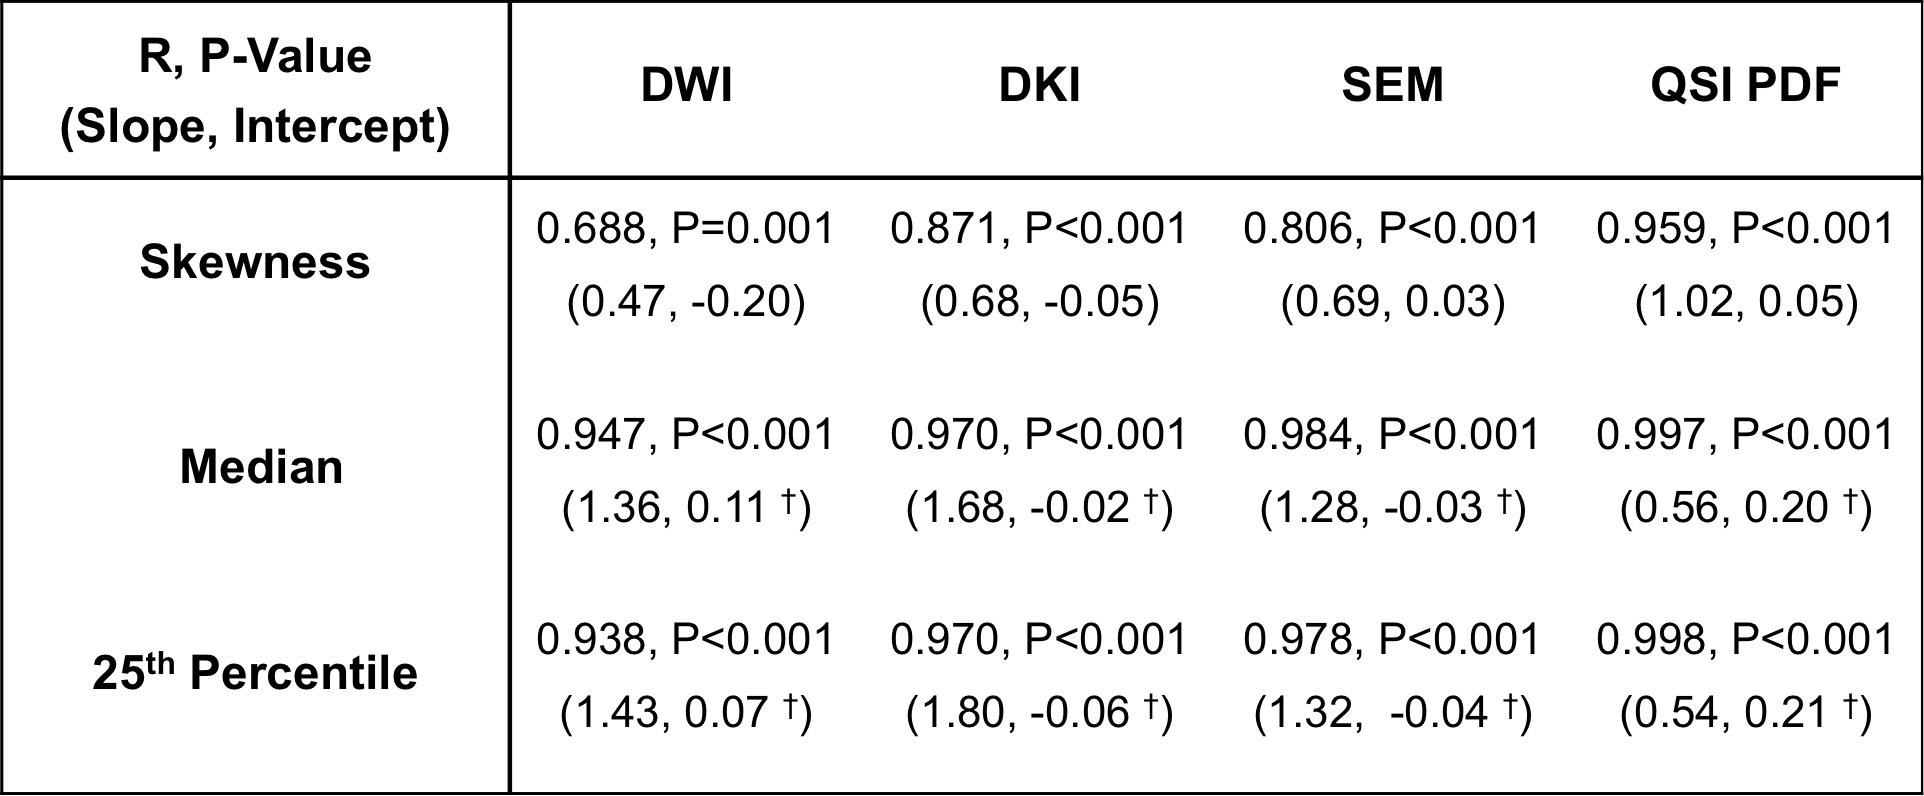
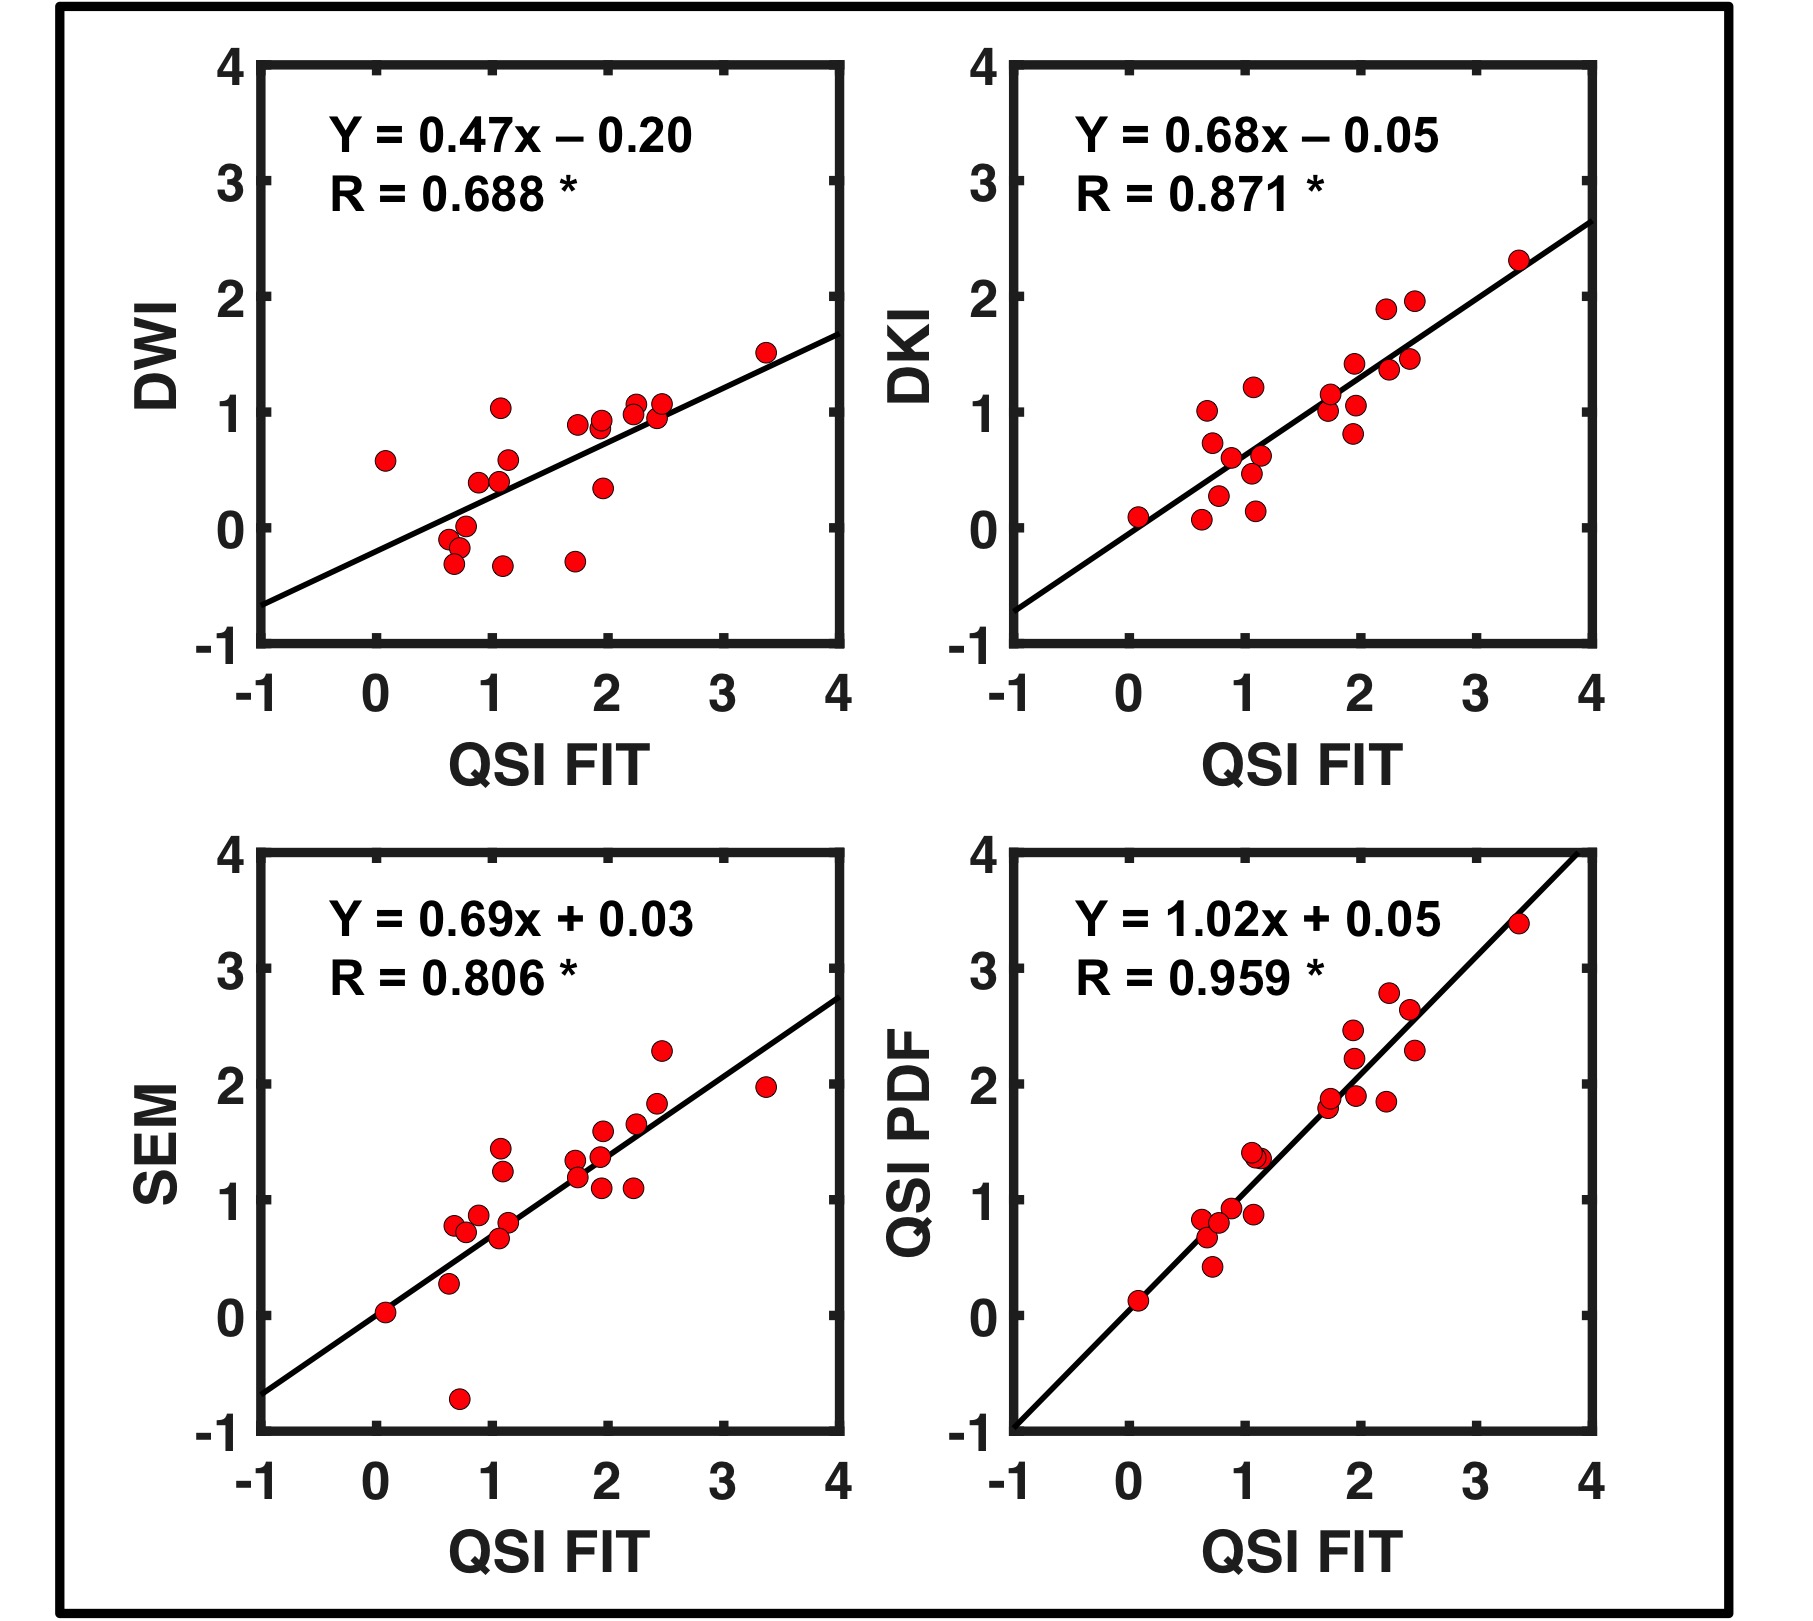
Diffusivity, AKC and ALPHA maps for a typical specimen are shown in Figure 1. QSI FIT showed significantly higher skewness (P≤0.001) than DWI, DKI and SEM, whilst not significantly different to QSI PDF (Figure 2, Table 1). The skewness from QSI FIT showed significant positive correlation (P≤0.001) with those observed in DWI (R=0.688), DKI (R=0.871), SEM (R=0.806) and QSI PDF (R=0.959) (Figure 3, Table 2). The relative contrast in spread (slope) of skewness showed DWI of 0.47, DKI of 0.68, SEM of 0.69 and QSI PDF of 1.02 in ascending order referenced to QSI FIT (Figure 3, Table 2). The slope and intercepts in skewness, median and 25th-percentile are shown in Table 2.Discussion
Asymmetry in diffusivity distributions observed from DWI, DKI, SEM and QSI acquired on a 3T clinical scanner from whole excised breast tumours were compared. The skewness in diffusivity distribution observed by QSI FIT and QSI PDF were not significantly different with close correlation, while the reduced QSI FIT requirement on maximum b-value suits clinical translation. The skewness in QSI FIT was significantly higher than those measured using DWI, DKI and SEM. The skewness from QSI FIT significantly correlated with those from other diffusion models, whilst the linear regression slope and increased spread in QSI skewness indicate increased sensitivity to tumour cell diversity.Conclusion
QSI provides a wider spread of skewness in diffusivity distribution, likely due to no prior assumptions of diffusion pattern.
Acknowledgements
The authors would like to thank Dr Mathew Clemence for clinical scientist support, Sai Man Cheung for logistic support, Bolanle Brikinns for patient recruitment and Gordon Buchan for technical support. The authors would also like to thank Mr Roger Bourne and Ms Mairi Fuller for providing access to the patients. This project was funded by NHS Grampian Endowment Research Grant, and Nicholas Senn is supported by EASTBIO BBSRC PhD studentship.References
1. Kim YJ, Kim SH, Lee AW, et al. Histogram analysis of apparent diffusion coefficients after neoadjuvant chemotherapy in breast cancer. Jpn J Radiol. 2016;34(10):657–66.
2. Just N. Improving tumour heterogeneity MRI assessment with histograms. Br J Cancer. 2014;111(12):2205–13.
3. Jensen JH, Helpern JA, Ramani A, et al. Diffusional kurtosis imaging: The quantification of non-gaussian water diffusion by means of magnetic resonance imaging. Magn Reson Med. 2005;53(6):1432–40.
4. Bennett KM, Schmainda KM, Bennett RT, et al. Characterization of continuously distributed cortical water diffusion rates with a stretched-exponential model. Magn Reson Med. 2003;50(4):727–34.
5. Sun K, Chen X, Chai W, et al. Breast Cancer: Diffusion Kurtosis MR Imaging-Diagnostic Accuracy and Correlation with Clinical-Pathologic Factors. Radiology. 2015;277(1):46–55.
6. Cohen Y, Assaf Y. High b-value q-space analyzed diffusion-weighted MRS and MRI in neuronal tissues - a technical review. NMR Biomed. 2002;15(7-8):516–42.
7. Yamada I, Hikishima K, Miyasaka N, et al. Esophageal carcinoma: Evaluation with q-space diffusion-weighted MR imaging ex vivo. Magn Reson Med. 2015;73(6):2262–73.
8. Ong HH, Wehrli FW. Quantifying axon diameter and intra-cellular volume fraction in excised mouse spinal cord with q-space imaging. Neuroimage. 2010;51(4):1360–6.
9. Farrell JAD, Smith SA, Gordon-Lipkin EM, et al. High b-value q-space diffusion-weighted MRI of the human cervical spinal cord in vivo: feasibility and application to multiple sclerosis. Magn Reson Med. 2008;59(5):1079–89.
Figures