0096
CEST MRI – a potential tool for breast cancer grade and proliferation rate differentiationOlgica Zaric1, Alex Farr2, Esau Poblador Rodriguez1, Vladimir Mlynarik1, Claudia Kronnerwetter1, Benjamin Schmitt3, Wolfgang Bogner1, Christian Singer2, and Siegfried Trattnig1
1High Field MR Center, Department of Biomedical Imaging and Image-guided Therapy, Medical University of Vienna, Vienna, Austria, 2Department of Obstetrics and Gynecology, Medical University of Vienna, Vienna, Austria, 3Siemens Healthineers, Sydney, Australia
Synopsis
I this study, we investigated which CEST contrast changes are characteristic and dominant for breast malignancies. In 18 female patients, we performed DWI, CEST imaging, and T1-CE MRI. Significant differences in MTRasym between G1 and G3 was found (P= 0.007). Between G1 and G2 (P=0.066) as well as between G2 and G3 no difference were observed (P= 0.089). Correlation test demonstrated a strong positive correlation between mean MTRasym measured in region of its maximum and proliferation factor, Ki-67 (r=0.890, P˂0.001). This preliminary results show that CEST-MRI of the breast has a potential to provide information regarding the tumor histological features.
Introduction:
Biochemical compounds, which contain groups with exchangeable protons such as amide (-NH), hydroxyl (-OH) or amine (-NH2) groups can be indirectly detected using chemical exchange saturation transfer (CEST) MR imaging[1]. Compounds containing these groups are proteins, glucose (Glc), choline (Cho), creatine, glycosaminoglycans (GAG)[2-5], etc. Some of these compounds are potentially connected and involved in tumor genesis, coagulation, invasion, and metastasis. In this study, we investigated the feasibility of CEST imaging in patients with malignant breast lesions at 7T. We evaluated which CEST contrast changes are characteristic and dominant for breast malignancies and assessed possible correlations between MTRasym values and histological features such as tumor grade and tumor proliferation rate Ki-67(%).
Material and methods:
MRI was performed on a whole-body 7T MR scanner with a 70 mT/m gradient amplitude and a 200 mT/m/ms slew rate (Magnetom, Siemens Healthcare, Erlangen, Germany). Patients were measured in a prone position using a dual-tuned bilateral breast coil (four 31P; four 1H channels; Stark, Erlangen, Germany). 18 female patients (mean age 56 years ± 9) were enrolled in this study. The imaging protocol consisted of diffusion weighted imaging (DWI), CEST imaging, and T1-weighted contrast enhanced (CE) MRI. CEST was performed using a 3D gradient echo (GRE) sequence, employing eight Gaussian pre-saturation pulses of 50 ms length and duty cycle of 80% with amplitude B1= 1 µT followed by a segmented gradient echo acquisition with a centric k-space sampling. Z-spectra were sampled by 32 equidistant frequency offsets between -4.0 and +4.0 ppm. Two different methods of B0 inhomogeneity correction were compared using voxel-specific correction: 1) Spectral shifting of Z-spectra using smoothing-splines-based correction method (IntB0Corr), and 2) B0-correction using water shift referencing (WASSR) method[6]. For each lesion, we calculated magnetization transfer ratios via asymmetry analysis (MTRasym) at two different chemical shifts offset ranges (region 1 from 1.0 to 1.8 ppm (R1) and region 2 from 1.8 to 2.6 (R2)). Then, the maximum MTRasym values in each of the ranges (R1 or R2) were determined for each ROI and differences between ROIs in different tissue types (tumor G1, G2, G3 and healthy tissue) were analyzed via univariate analysis of variance and post-hoc tests (Games Howell). A p-value ≤0.05 was considered significant. The maximum MTRasym values for each lesion were correlated with proliferation factor Ki-67(%), using Pearson correlation coefficients (95% confidence intervals). MTRasym and ADC measured in each lesion were correlated using the same statistical analysis.Results:
The mean ADC value for all 19 lesion was (1.10 ± 0.24) ×10-3 mm2/s. For all tumors, the calculated MTRasym values (mean ± SD) were (4.90±1.9)% and (4.70±1.90)% for IntB0Corr and WASSR methods, respectively. There was no significant difference between these two methods (CI=95%, p=0.202). All tumors with G1 (6/6), two carcinomas with G2 (2/7) and one with G3 (1/6) had MTRasym maximum in region R1. The remaining five of G2 (2/5) and five of G3 tumors (5/6) had peaks in the R2 region. MTRasym measured in healthy glandular tissue in contralateral breast, after the IntB0Corr correction in R1 was (1.1±0.4)%. This value was significantly lower compared with the mean MTRasym calculated for all three groups of different tumor grades G1, G2 and G3 (CI=95%, all P≤0.001) (Fig. 1). The mean MTRasym value measured for G1 was (3.0±0.3)%, and was not significantly lower than for G2 (4.50±1.30)%, (CI=95%, P=0.066). When carcinomas with G1 and G3 (6.70±1.60)% were compared, a significant difference in MTRasym was found (CI= 95%, P= 0.007). Also, no significant difference between for G2 and G3 in MTRasym (CI=95%. P=0.089) was observed (Fig. 2). The Pearson correlation test demonstrated a strong positive correlation between mean MTRasym measured in region of its maximum and proliferation factor, Ki-67 (r=0.890, P≤0.001)(Fig. 3a). The same test showed moderate negative correlation between MTRasym and ADC values (r= -0.506, P=0.027), (Fig. 3b).Discussion/Conclusion:
In this study we showed that for different tumor grades, the asymmetry peaks were detected at different positions of the Z-spectrum. Comparing our data with histological properties of tumors, we found that for most low grade tumors (G1 and G2) the maximum MTRasym is observed in a different region compared to high grade tumors (G3). This can be explained by the change of pH as well as by the fact that depending on its biological properties, changes in several metabolites may be involved in tumor genesis and growth. CEST MRI of the breast has a potential to provide complementary molecular information on tumor tissue metabolism. Therefore, we believe that with further technical improvement and clinical validation, endogenous CEST contrast may become another valuable noninvasive biomarker for breast cancer diagnosis.Acknowledgements
This work was supported by the Vienna Science and Technology Fund (WWTF, project LS14-096).References
Ward, K.M. et al. A new class of contrast agents for MRI based on proton chemical exchange dependent saturation transfer (CEST). J Magn Reson, 2000. 143(1): p. 79-87.Walker-Samuel, S., et al., In vivo imaging of glucose uptake and metabolism in tumors. Nat Med, 2013. 19(8): p. 1067-72.Glunde, K. et al. Choline metabolism in malignant transformation. Nat Rev Cancer, 2011. 11(12): p. 835-48.Silverman, L.M., et al., Creatine-Kinase Bb - New Tumor-Associated Marker. Clinical Chemistry, 1979. 25(8): p. 1432-1435.Weyers, A., et al., A structural analysis of glycosaminoglycans from lethal and nonlethal breast cancer tissues: toward a novel class of theragnostics for personalized medicine in oncology? OMICS, 2012. 16(3): p. 79-89.Kim, M., et al., Water saturation shift referencing (WASSR) for chemical exchange saturation transfer (CEST) experiments. Magn Reson Med, 2009. 61(6): p. 1441-50.Figures
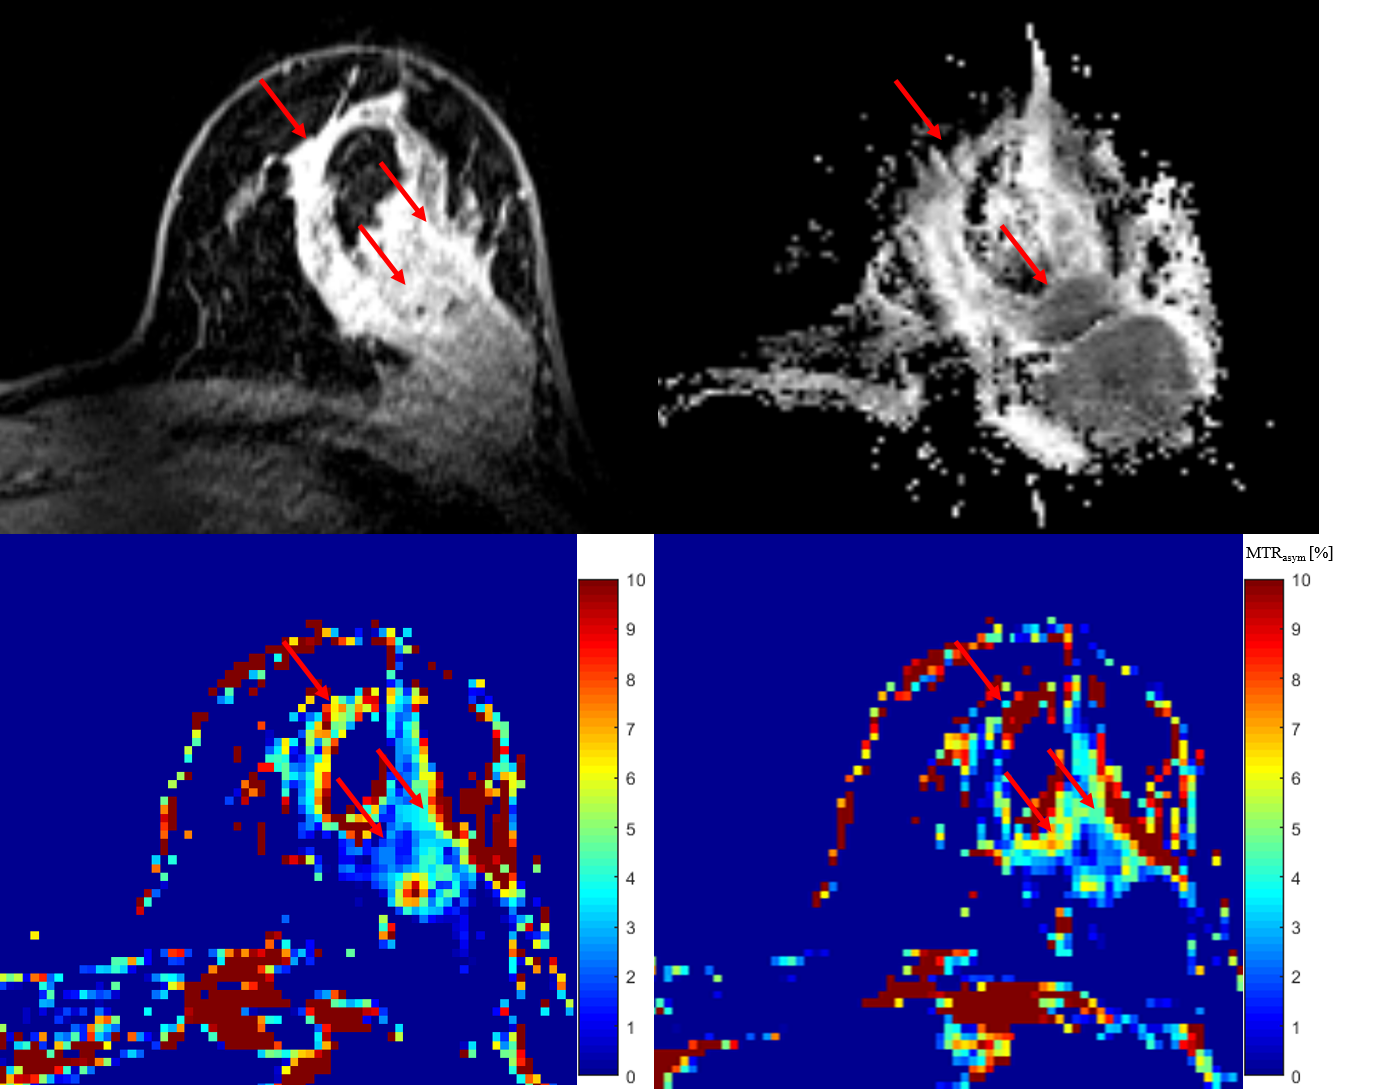
Figure 1: 41-years-old female patient with ductal invasive carcinoma (G3) in left
breast.
Contrast enhancement
(CE) imaging showed high initial contrast uptake in part of tumor with
irregular margins and no enhancement in round shaped lesion histologically
described as fibrotic mass.Apparent diffusion map
(ADC) showed regional decrease in ADC values.CEST map calculated at
1.4 ppm showed lower MTRasym values in regions of high CE signal and
decreased ADC values compared with CEST map calculated at 2.2 ppm (d).
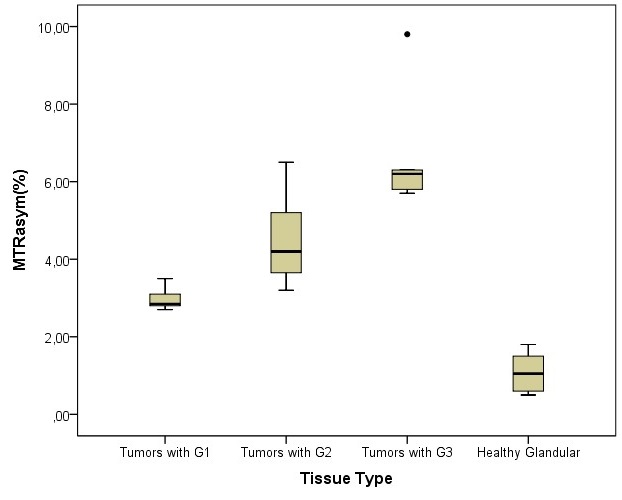
Figure 2: Boxplot diagram presents calculated MTRasym
for healthy glandular tissue from contralateral side and same parameter found
in carcinomas, which were divided in three groups based on its grade (G1, G2
and G3). Statistical
analysis showed significant differences between tumors (G1, G2 and G3) and
normal tissue (CI=95%, all P˂0.001), respectively.
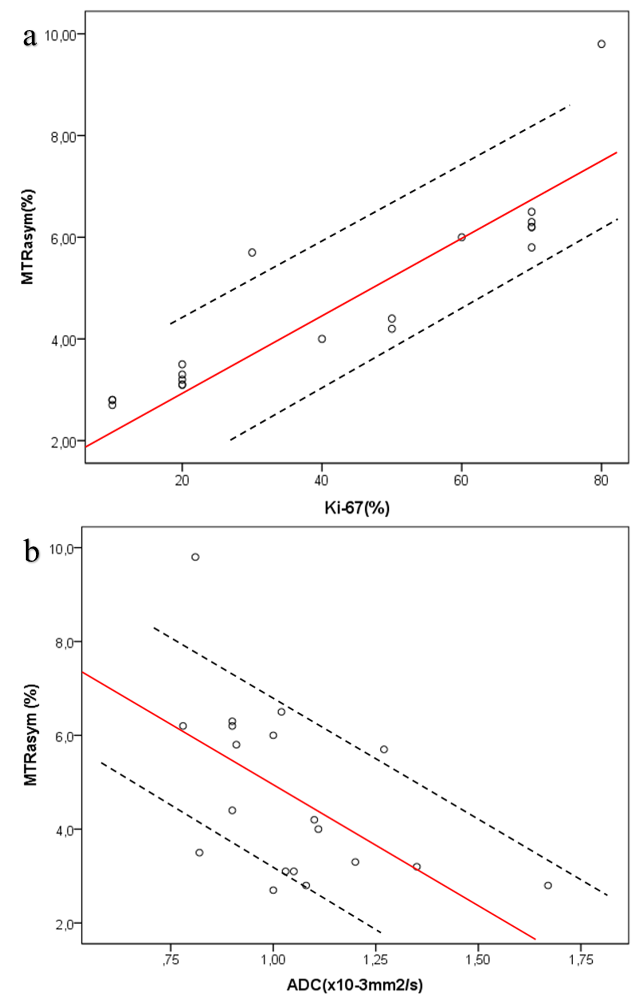
Figure 3: Graphs shows
correlation (solid line) between MTRasym (%) and a) proliferation
factor Ki-67 (%) and b) apparent diffusion coefficient (ADC) measured. Dashed
lines indicate the 95% confidence intervals (dashed line). a) There was high
positive correlation between MTRasym and Ki-67 (r=0.890, P≤0.001)
and b) moderate negative correlation between MTRasym and ADC (r=
-0.506, P=0.027).