0095
Multi-compartmental sodium quantification in breast using a bilateral dual-tuned proton/sodium coil and multi-pulse excitation scheme at 7T1Center for Advanced Imaging Innovation and Research (CAI2R) and Center for Biomedical Imaging, New York, NY, United States, 2The Sackler Institute of Graduate Biomedical Science, New York University School of Medicine, New York, NY, United States
Synopsis
Sodium is an important electrolyte in the human body and is a distinct MRI contrast mechanism in breast cancer as it provides insight on cellular viability, ion homeostasis, inflammation, and fluid content. Due to sodium low SNR, intracellular sodium concentration (C1), volume fractions for the intracellular (α1) or extracellular compartments (α2), and fluid (α3) remain largely unexplored. We built a custom bilateral dual-tuned 1H/23Na RF coil and developed a novel fingerprinting-based sodium excitation scheme on a 7T system to enable multi-compartmental sodium quantification in breast. In this work we describe the coil, pulse sequence and preliminary results in one subject.
Introduction
Sodium is an important electrolyte in the human body and is a distinct MRI contrast mechanism in breast cancer. While breast tumors are known to have increased total sodium concentration (1-3), refined multi-compartment measurements may reveal greater insight on cellular viability, ion homeostasis, inflammation, and fluid content. In particular, intracellular sodium concentration (C1), volume fractions for the intracellular (α1) or extracellular compartments (α2), and fluid (α3) remain largely unexplored due to challenges associated with lower sodium abundance in the body, MR receptivity and gyromagnetic ratio compared to protons (4,5). In order to overcome these challenges, we built a custom bilateral dual-tuned 1H/23Na RF coil and developed a novel fingerprinting-based sodium excitation scheme on a 7 Tesla system to enable multi-compartmental sodium quantification in breast. In this work we describe the coil, pulse sequence and preliminary results in one subject.Methods
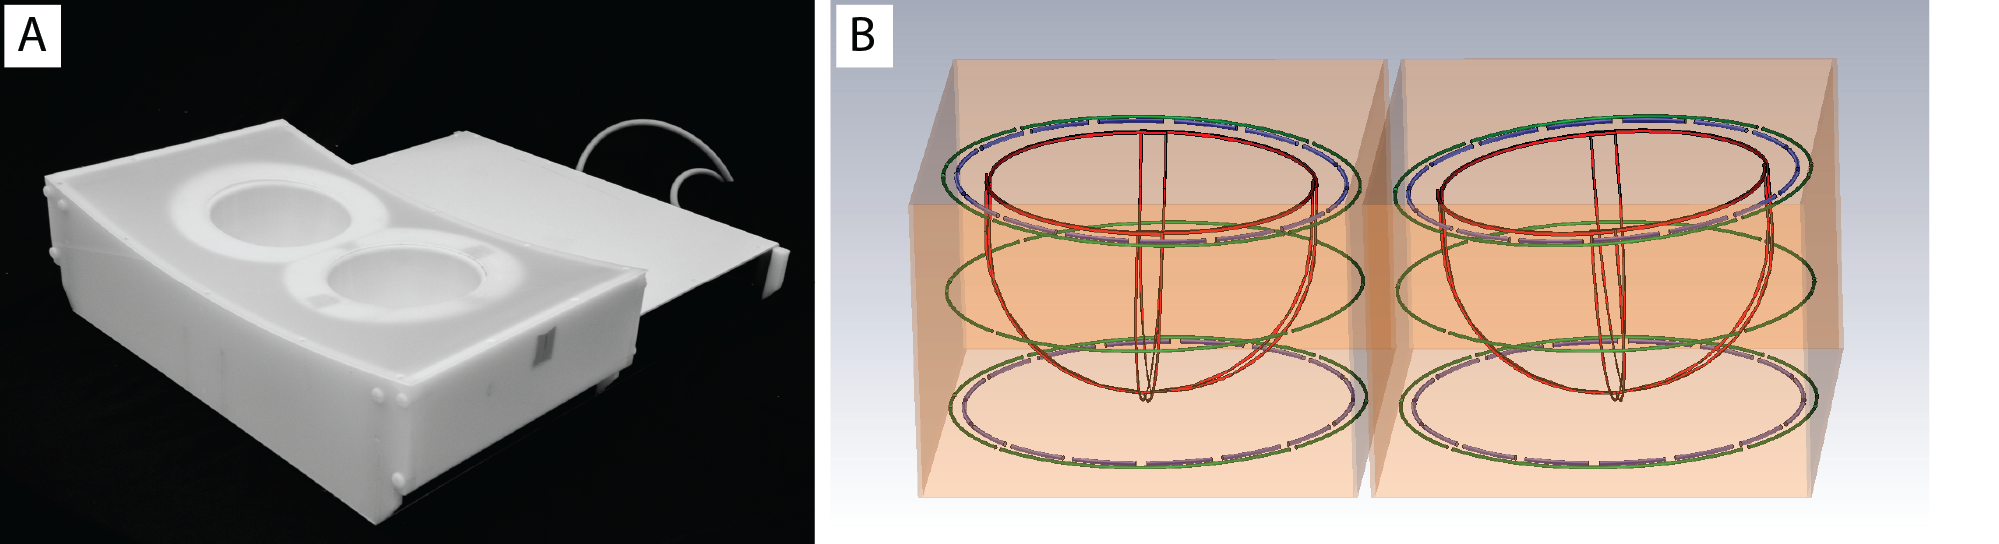
Coil design: The unilateral dual-tuned 1H/23Na breast coil described in (6) was expanded to provide bilateral coverage (Fig. 1). For each side: a 23Na transmit solenoid (78.6 MHz) provided uniform excitation while a four-loop receive array ensured encircling coverage of the anatomy with a Q ratio of about 2 while loaded with a two-compartment phantom whose dielectric properties matched those of a mixture of adipose and fibro-glandular breast tissue and muscle (7). A transmit/receive 1H solenoid (297 MHz) enabled traditional T1-weighted anatomical imaging, B0 shimming, and Dixon-based image segmentation. For bilateral operation, the two sides were isolated with separate passive shields that provided low impedance at radio-frequencies and high-impedance at lower gradient switching frequencies by segmenting the pathway with capacitively coupled overlapped conductive segments. The two sides of the coil were driven in phase in order to avoid destructive interference and unbalance as suggested in (8).
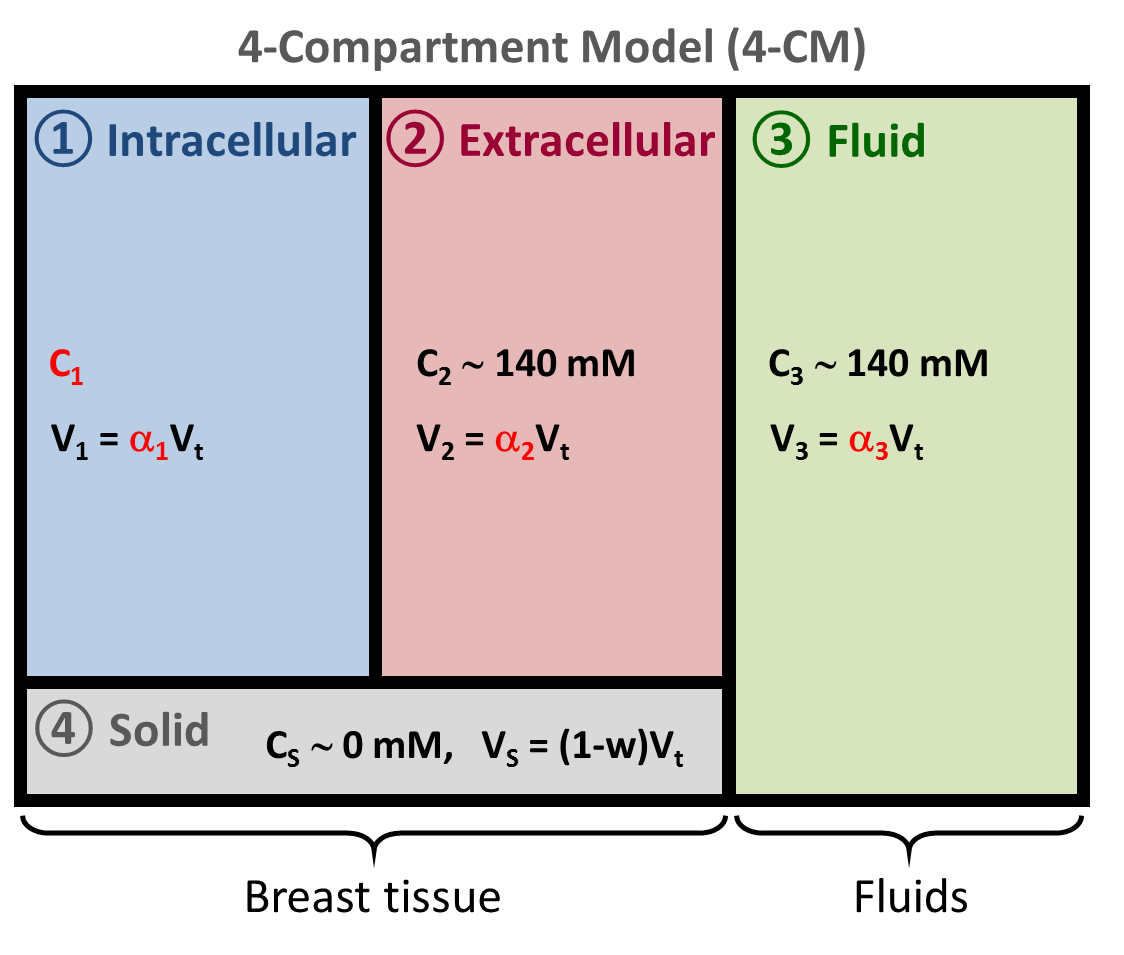
Sodium quantification: C1, α1, α2 and α3 were measured with a multipulse sodium excitation method along signal simulations, that emulates concepts from magnetic resonance fingerprinting (MRF) (9). Data acquisition for this approach was performed using a multi-pulse ultrashort echo time FLORET sequence (10). A four-compartment model of breast was proposed (Fig. 2) where sodium is present in the intracellular (IC), extracellular (EC) and fluid (cyst, effusion, etc.) compartments while the solid compartment (membrane, metabolites, etc.) does not contribute to the sodium signal. The fluid compartment was simulated with phosphate buffer saline (PBS) phantoms placed within the FOV and used as reference for sodium quantification (140mM). Based on theoretical principles (4) and prior knowledge of relaxation times (11-14), sodium signal evolutions in the IC, EC and fluid compartments were simulated using full quantum mechanical simulation of spin 3/2 dynamics with different relaxation times, offset resonance and imperfections in RF pulse flip angles (4). The sequence flip angle, phases and delays between pulses were optimized to minimize the absolute correlation between the signal evolutions from IC, EC and PBS during the multipulse sequence: 0.06 (IC/EC), 0.70 (IC/PBS), 0.36 (EC/PBS).
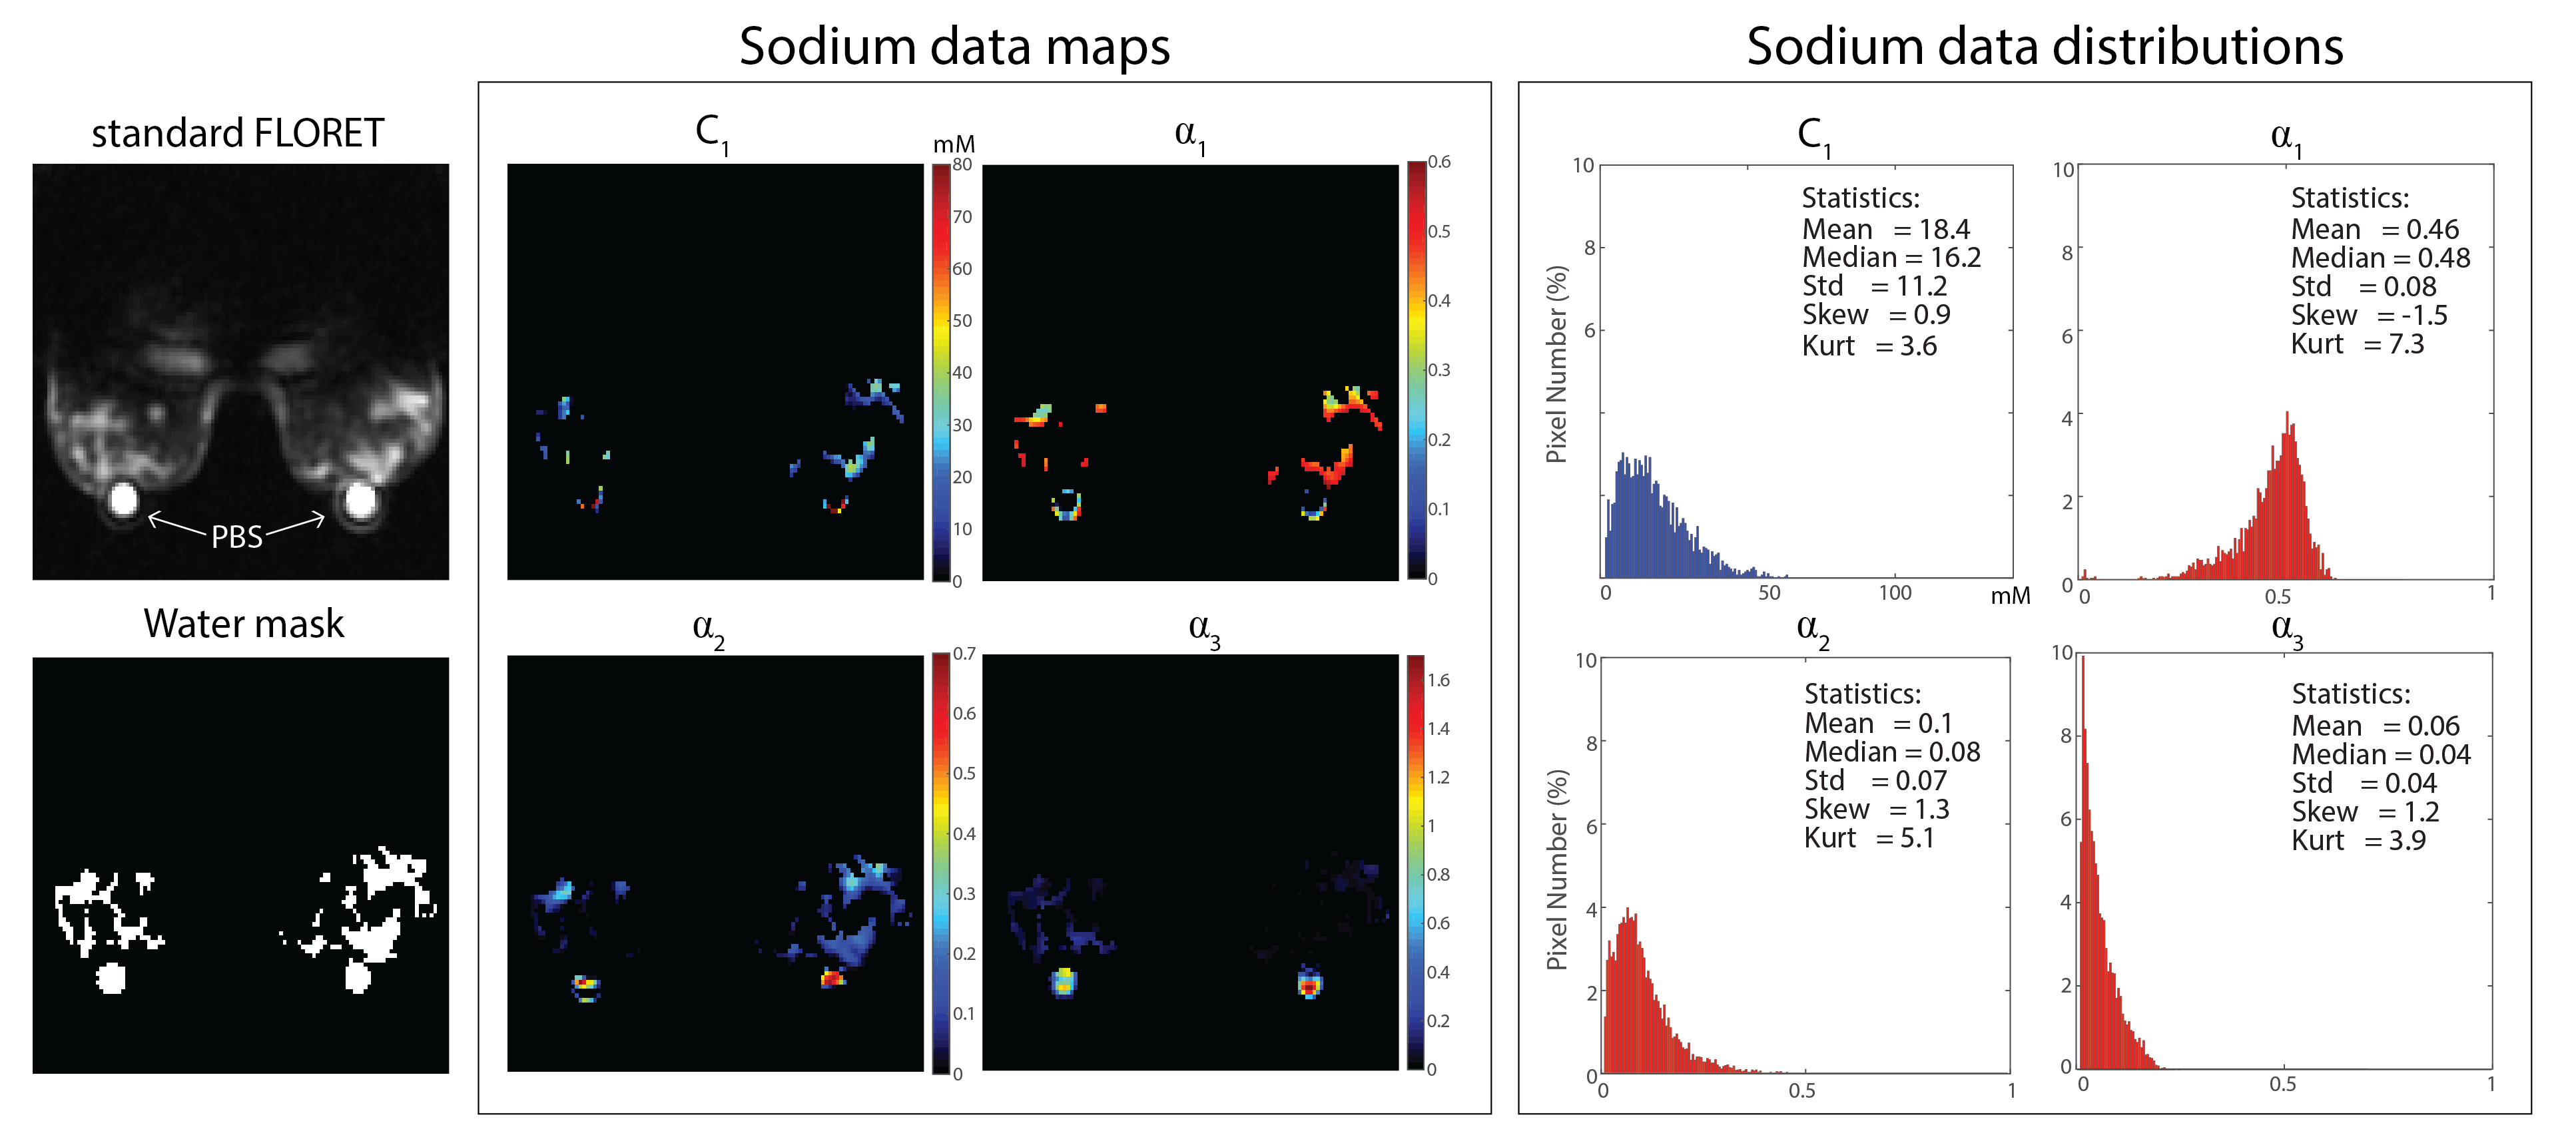
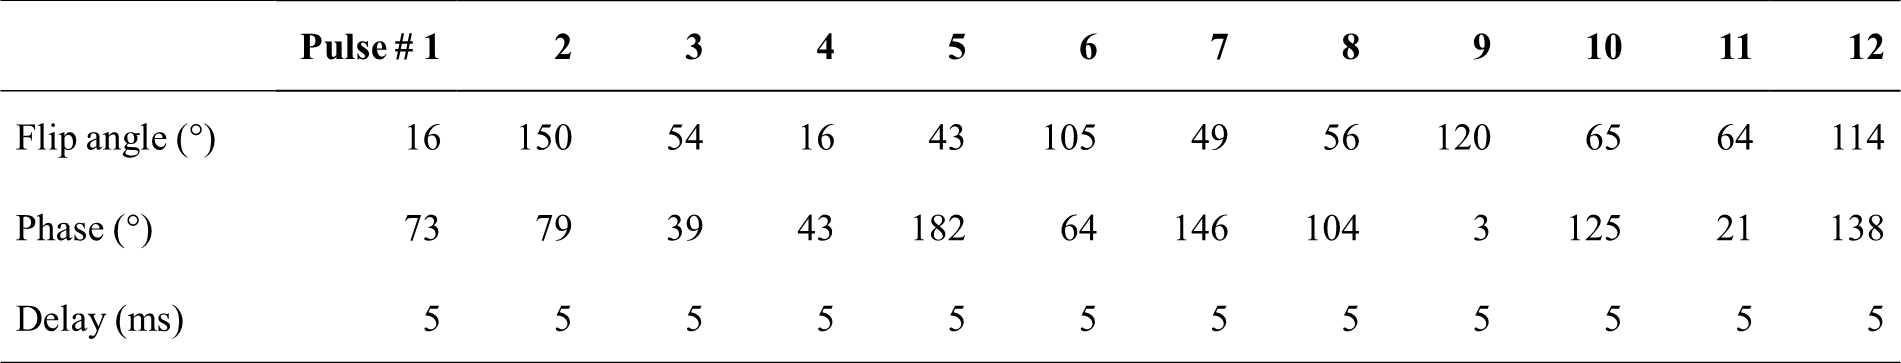
MRI measurements: In vivo images on a healthy volunteer were acquired on Siemens 7T MAGNETOM scanner (Siemens Healthineers, Erlangen, Germany) once the study was approved by our Institutional Review Board and after obtaining the subject informed written consent. For sodium quantification a 12-pulse FLORET sequence was optimized and used with TR/TE=320/0.2 ms TA=20:48 min (see Table 1 for excitation parameters). Sodium images were also acquired with single-pulse FLORET with base resolution of 3.8x3.8x3.8 mm3, TR/TE=100/0.2 ms, FA=80°, 3 hubs of 350 interleaves and TA=7:00 min. Proton images facilitated automatic separation of fibroglandular and adipose tissue by processing 3D GRE data (TE = 2.04, 2.24, 2.44 and 2.64 ms) with a hierarchical IDEAL method (15,16) available in the ISMRM water-fat separation toolbox (17). Fibroglandular tissue was defined as voxels with greater than 25% water content. The fibroglandular mask was co-registered with sodium images to enable statistical analysis of the tissue.
Results
Figure 3 shows the in vivo images and C1, α1, α2 and α3 maps and distributions. Within the masked fibroglandular volume (excluding the PBS phantoms) we measured C1 =18.4±11.2 mM, α1=0.46±0.08, α2=0.10±0.07 and α3=0.06±0.04 which were in good agreement with those reported in literature α1,theory ~0.5, α2,theory ~0.2, C1,theory ~15 mM and α3,theory ~0 for breast.Discussion
The current coil/sequence/processing set up enabled multi-compartment sodium quantification in breast. While the initial results show promise for cell viability characterization, which may reveal new information on tumors and their response to treatment, more work is needed to substantiate the technique. Opportunities include optimizing the pulse sequence excitation scheme to promote decorrelation between compartments and utilizing a water fraction measurement from proton MRI (18) in place of the assumed value (see Fig. 2).Acknowledgements
This work was supported by NIH grants 1R21CA213169 and 1R01NS097494, and was performed under the rubric of the Center for Advanced Imaging Innovation and Research (CAI2R, www.cai2r.net) at the New York University School of Medicine, which is an NIBIB Biomedical Technology Resource Center (NIH P41 EB017183).References
1. Ouwerkerk R, Bleich KB, Gillen JS, Pomper MG, Bottomley PA. Tissue sodium concentration in human brain tumors as measured with 23Na MR imaging. Radiology 2003;227(2):529-537.
2. Thulborn KR, Davis D, Adams H, Gindin T, Zhou J. Quantitative tissue sodium concentration mapping of the growth of focal cerebral tumors with sodium magnetic resonance imaging. Magnetic resonance in medicine 1999;41(2):351-359.
3. Thulborn KR, Lu A, Atkinson IC, Damen F, Villano JL. Quantitative sodium MR imaging and sodium bioscales for the management of brain tumors. Neuroimaging clinics of North America 2009;19(4):615-624.
4. Madelin G, Lee JS, Regatte RR, Jerschow A. Sodium MRI: methods and applications. Prog Nucl Magn Reson Spectrosc 2014;79:14-47.
5. Madelin G, Regatte RR. Biomedical applications of sodium MRI in vivo. Journal of Magnetic Resonance Imaging 2013;38(3):511-529.
6. Ianniello CM, G. ; Lakshmanan, K. ; Zhang, B. ; Moy, L. ; Brown, R. Design and performance of a dual tuned 7 T proton/sodium breast coil. Proceeding of the 2017 International Conference on Electromagnetics in Advanced Applications (ICEAA). Verona, Italy: IEEE; 2017.
7. Ianniello C, de Zwart JA, Duan Q, Deniz CM, Alon L, Lee J, Lattanzi R, Brown R. Synthesized tissue-equivalent dielectric phantoms using salt and polyvinylpyrrolidone solutions. Magn Reson Imaging In press 2017.
8. Cui J, Bosshard JC, Rispoli JV, Dimitrov IE, Cheshkov S, McDougall MP, Malloy C, Wright SM. A Switched-Mode Breast Coil for 7 T MRI Using Forced-Current Excitation. IEEE Trans Biomed Eng 2015;62(7):1777-1783.
9. Ma D, Gulani V, Seiberlich N, Liu K, Sunshine JL, Duerk JL, Griswold MA. Magnetic resonance fingerprinting. Nature 2013;495(7440):187-192.
10. Pipe JG, Zwart NR, Aboussouan EA, Robison RK, Devaraj A, Johnson KO. A new design and rationale for 3D orthogonally oversampled k-space trajectories. Magnetic resonance in medicine 2011;66(5):1303-1311.
11. Winter PM, Bansal N. TmDOTP(5-) as a (23)Na shift reagent for the subcutaneously implanted 9L gliosarcoma in rats. Magnetic resonance in medicine 2001;45(3):436-442.
12. Shinar H, Navon G. Sodium-23 NMR relaxation times in nucleated red blood cells and suspensions of nuclei. Biophysical journal 1991;59(1):203-208.
13. Bansal N, Germann MJ, Seshan V, Shires GT, 3rd, Malloy CR, Sherry AD. Thulium 1,4,7,10-tetraazacyclododecane-1,4,7,10-tetrakis(methylene phosphonate) as a 23Na shift reagent for the in vivo rat liver. Biochemistry 1993;32(21):5638-5643.
14. Foy BD, Burstein D. Interstitial sodium nuclear magnetic resonance relaxation times in perfused hearts. Biophysical journal 1990;58(1):127-134.
15. Tsao J, Jiang Y. Hierarchical IDEAL: robust water-fat separation at high field by multiresolution field map estimation. Proceedings of the 18th Annual Meeting of ISMRM. Toronto, ON, Canada2008. p 653.
16. Jiang Y, Tsao J. Fast and robust separation of multiple chemical species from arbitrary echo times with complete immunity to phase wrapping. Proceedings of the 20th Annual Meeting of ISMRM. Melbourne, Australia2012.
17. Hu HH, Bornert P, Hernando D, Kellman P, Ma J, Reeder S, Sirlin C. ISMRM workshop on fat-water separation: insights, applications and progress in MRI. Magnetic resonance in medicine 2012;68(2):378-388.
18. Sabati M, Maudsley AA. Fast and high-resolution quantitative mapping of tissue water content with full brain coverage for clinically-driven studies. Magnetic resonance imaging 2013;31(10):1752-1759.
19. McGhee DE, Steele JR. Breast volume and bra size. Int J Cloth Sci Tech 2011;23(5):351-360.
20. Brooksby B,
Pogue BW, Jiang SD, Dehghani H, Srinivasan S, Kogel C, Tosteson TD, Weaver J,
Poplack SP, Paulsen KD. Imaging breast adipose and fibroglandular tissue
molecular signatures by using hybrid MRI-guided near-infrared spectral
tomography. P Natl Acad Sci USA 2006;103(23):8828-8833.
Figures