0092
The role of diffusion-weighted MRI in the prediction of response in I-SPY 2 TRIAL1Radiology & Biomedical Imaging, UCSF, San Francisco, CA, United States, 2Epidemiology and Biostatistics, UCSF, San Francisco, CA, United States, 3School of Medicine, University of Washington, Seattle, WA, United States, 4Surgery and Radiology, UCSF, San Francisco, CA, United States
Synopsis
Diffusion weighted MRI can be used to characterize water mobility and cellularity of tumor by measuring the apparent diffusion coefficient (ADC). Functional tumor volume (FTV) measures size change along the treatment. This study showed that after only 3 weeks of pre-surgery chemotherapy, ADC added value to the logistic regression model of using FTV alone to predict pCR or RCB as outcomes for patients with advanced breast cancer in I-SPY 2 TRIAL. The effect of adding ADC is statistically significant and increase the estimated area under the ROC curve after adjusted for breast cancer subtype categorized by HR and HER2 status.
Introduction
Functional tumor volume (FTV) measured by dynamic contrast-enhanced (DCE) MRI has shown its predictive value to treatment response in I-SPY 1 TRIAL1,2. Diffusion weighted MRI (DWI) can be used to characterize water mobility and cellularity of tumor by measuring the apparent diffusion coefficient (ADC). DWI with 2 b-values has been acquired in the I-SPY 2 TRIAL, in addition to DCE MRI. Our study tested whether, in a neoadjuvant chemotherapy setting, DWI provided additional information (independent of FTV) about the tumor response at an early treatment time point.Methods
A sub-cohort of women enrolled in the I-SPY 2 TRIAL (a phase 2, multicenter, clinical trial for treating advanced breast cancer with pre-surgery chemotherapy) was included in this study. Breast cancer was categorized into 4 subtypes by hormone receptor (HR) and human epidermal growth factor receptor 2 (HER2) status: HR+/HER2-, HR+/HER2+, HR-/HER2+, HR-/HER2-. DCE MRI and DWI were acquired 4 times for each patient: pre-treatment (T0), early treatment (T1, 3 weeks after taxane-containing treatment initiation), inter-regimen (T2, after 12 weeks of taxane-containing treatment), and before surgery (T3). The FTV and ADC values at each visit, as well as percent changes at later treatment time points compared to pre-treatment, were calculated. The percent changes of FTV and mean tumor ADC at early treatment (FTV10 and ADC10) were analyzed as independent variables in logistic regression models where binary outcomes such as pathologic complete response (0: pCR, 1: non-pCR) or dichotomized residual cancer burden (0: RCB0 or RCB1, 1: RCB2 or RCB3) were considered as dependent variables. Odds ratios were estimated for each 10% increase of FTV and 10% increase of ADC to have non-pCR or RCB2/RCB3 at the surgery. Predictive performances of the models were estimated using the area under the receiver operating characteristic curve (AUC). The AUC for the multivariate model was estimated using logistic regression predicted values from 10-fold cross-validation. The statistical significance level for all testing was set at 0.05.Results
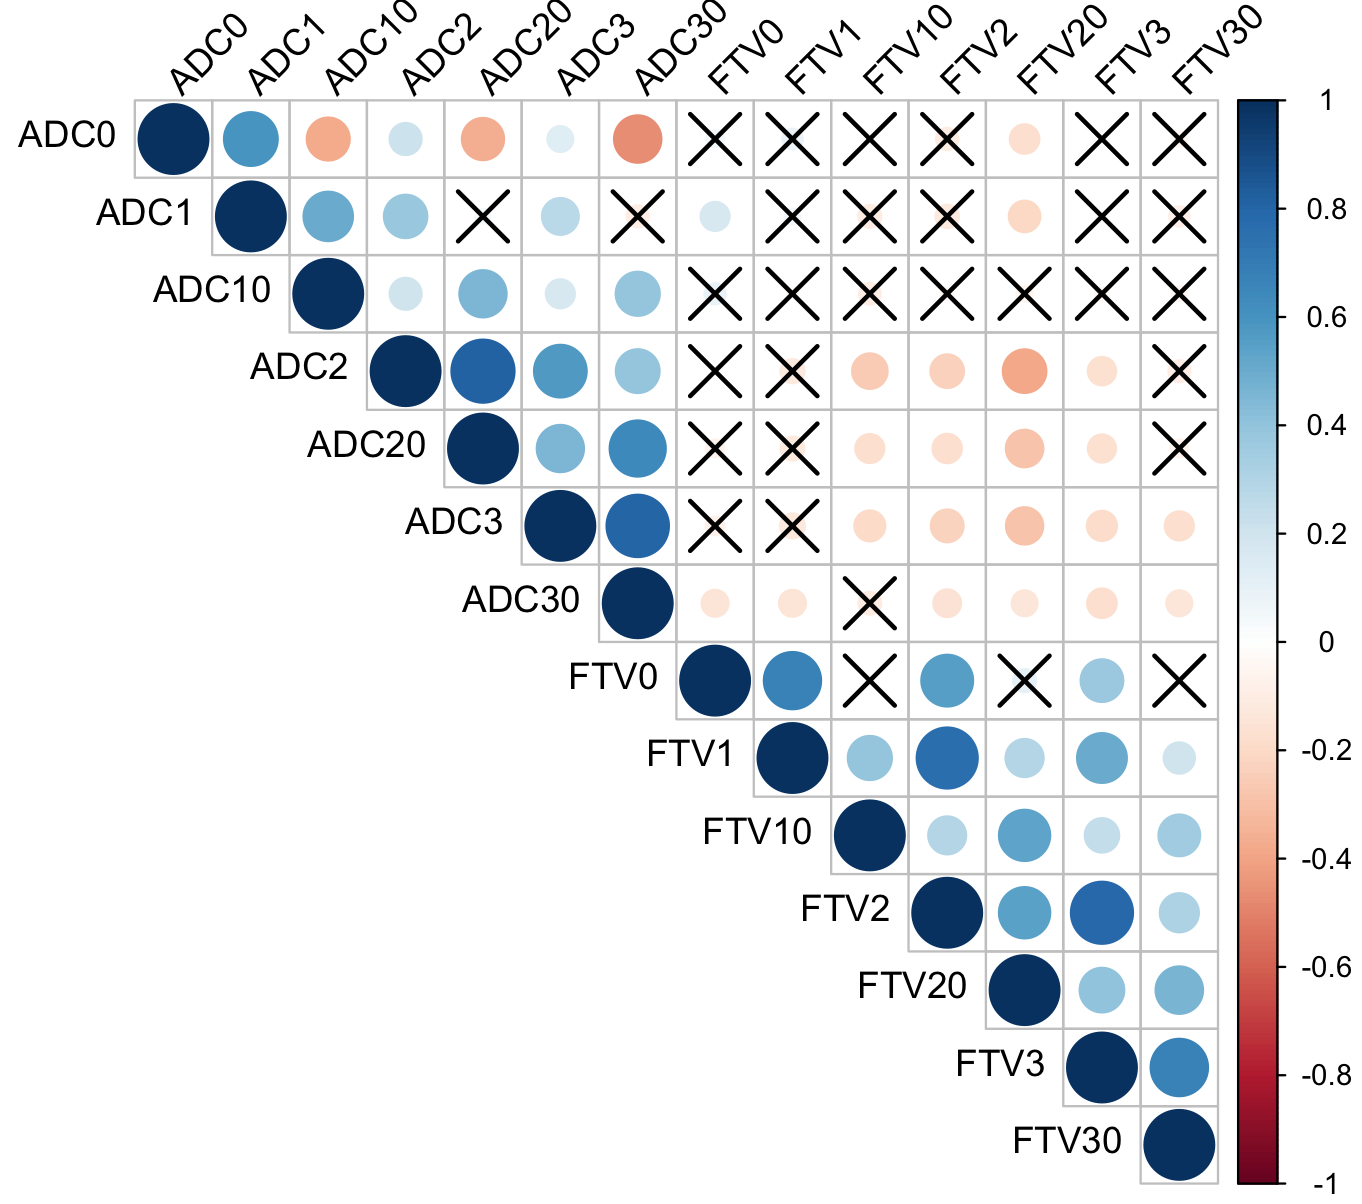
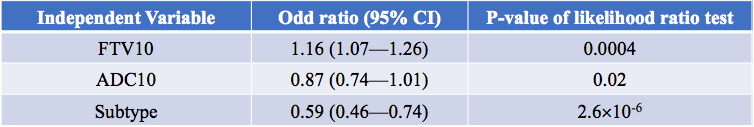
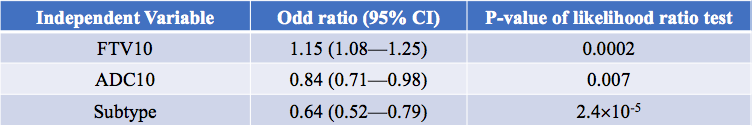
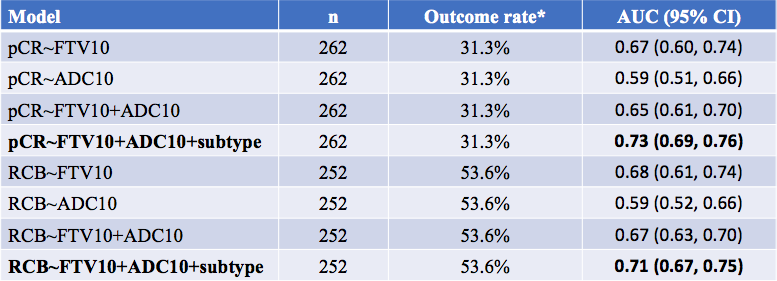
The correlation of various forms of FTV and ADC measurements is shown in Figure 1. At early treatment, percent change of FTV (FTV10) and ADC (ADC10) were not clinically significantly correlated (ρ=-0.10, 95% CI: -0.21—0.03) but they are correlated negatively at inter-regimen and before surgery. The logistic regression model with FTV or ADC as the single predictor for predicting pCR as the outcome estimated the odds ratio of FTV change was 1.15 (95% CI: 1.07—1.24) and of ADC change was 0.83 (95% CI: 0.71—0.95). Both FTV and ADC are statistically significant predictors (p=0.0004 for FTV and p=0.009 for ADC). When RCB is the outcome, the odds ratio was estimated as 1.14 (95% CI: 1.07—1.23) for FTV and 0.81 (95% CI: 0.70—0.94) for ADC. Both predictors also showed statistically significant as a single predictor (p=0.0002 for FTV and p=0.005 for ADC). The results of including FTV, ADC, and adjusted for breast cancer subtype in the logistic regression model when pCR is the outcome are shown in Table 1; Table 2 shows results when RCB is the outcome. The AUCs of different models are shown in Table 3. The model with FTV, ADC and subtypes as independent variables had the highest AUC for predicting both pCR and RCB outcomes.Discussion
As a complex clinical trial, I-SPY 2 patients were randomized to be treated with various experimental or standard regimens. The effect of treatment was not included into the multivariate analysis due to limited sample size. However, the treatment could be another confounding variable in the logistic regression model. Furthermore, ADC was calculated from only 2 b-values, with b=0 s/mm2 and b=800 s/mm2, which may not provide an accurate sampling of signal decay for calculation of ADC.Conclusion
In conclusion, we found that ADC had statistically significant value when added to the model of using FTV alone but the effect was not reflected in the AUC estimates. However, the AUC estimates improved when the combined model was adjusted for breast cancer subtype. Further prospective studies are needed to determine the optimal to incorporate ADC into standard FTV assessment to better predict treatment response by breast MRI. With a larger cohort, we expect the confidence interval of AUC will be narrow and thereby potentially show improvement for the addition of ADC. Further prospective studies are also needed to determine the optimal approach to incorporating ADC into standard FTV assessment to better predict treatment response by breast MRI.Acknowledgements
No acknowledgement found.References
1. Hylton NM, Blume JD, Bernreuter WK, et al. Locally advanced breast cancer: MR imaging for prediction of response to neoadjuvant chemotherapy--results from ACRIN 6657/I-SPY TRIAL. Radiology. 2012;263(3):663-672.
2. Hylton NM, Gatsonis CA, Rosen MA, et al. Neoadjuvant Chemotherapy for Breast Cancer: Functional Tumor Volume by MR Imaging Predicts Recurrence-free Survival-Results from the ACRIN 6657/CALGB 150007 I-SPY 1 TRIAL. Radiology. 2016;279(1):44-55.
Figures