0091
The relevance of cortical lesions in cortical thinning in multiple sclerosis by ultra-high field MRI1Department of Radiology, A.A. Martinos Center for Biomedical Imaging, Massachusetts General Hospital, Boston, MA, United States, 2Harvard Medical School, Boston, MA, United States, 3Department of Clinical Science, Intervention and Technology, Karolinska Institutet, Stockholm, Sweden, 4Department of Radiology, Karolinska University Hospital, Stockholm, Sweden, 5Department of Neurology, Beth Israel Deaconess Medical Center, Boston, MA, United States, 6Department of Neurosciences, University of California, San Diego, CA, United States
Synopsis
Cortical lesions (CL) and cortical atrophy are frequent in multiple sclerosis (MS) and main determinants of disease progression. The relationship between them is still unknown, mostly due to the low sensitivity of clinical magnetic resonance imaging (MRI) to CL. Disconnection from white matter (WM) lesions has also been proposed as a pathogenic mechanism for cortical MS atrophy. Using 7 Tesla MRI that has shown increased sensitivity to CL than clinical MRI, we showed, in a large MS cohort that WM lesions are the main determinant of cortical thinning. Nevertheless, CL resulted as the main contributors of physical and cognitive disability.
Purpose:
Methods:
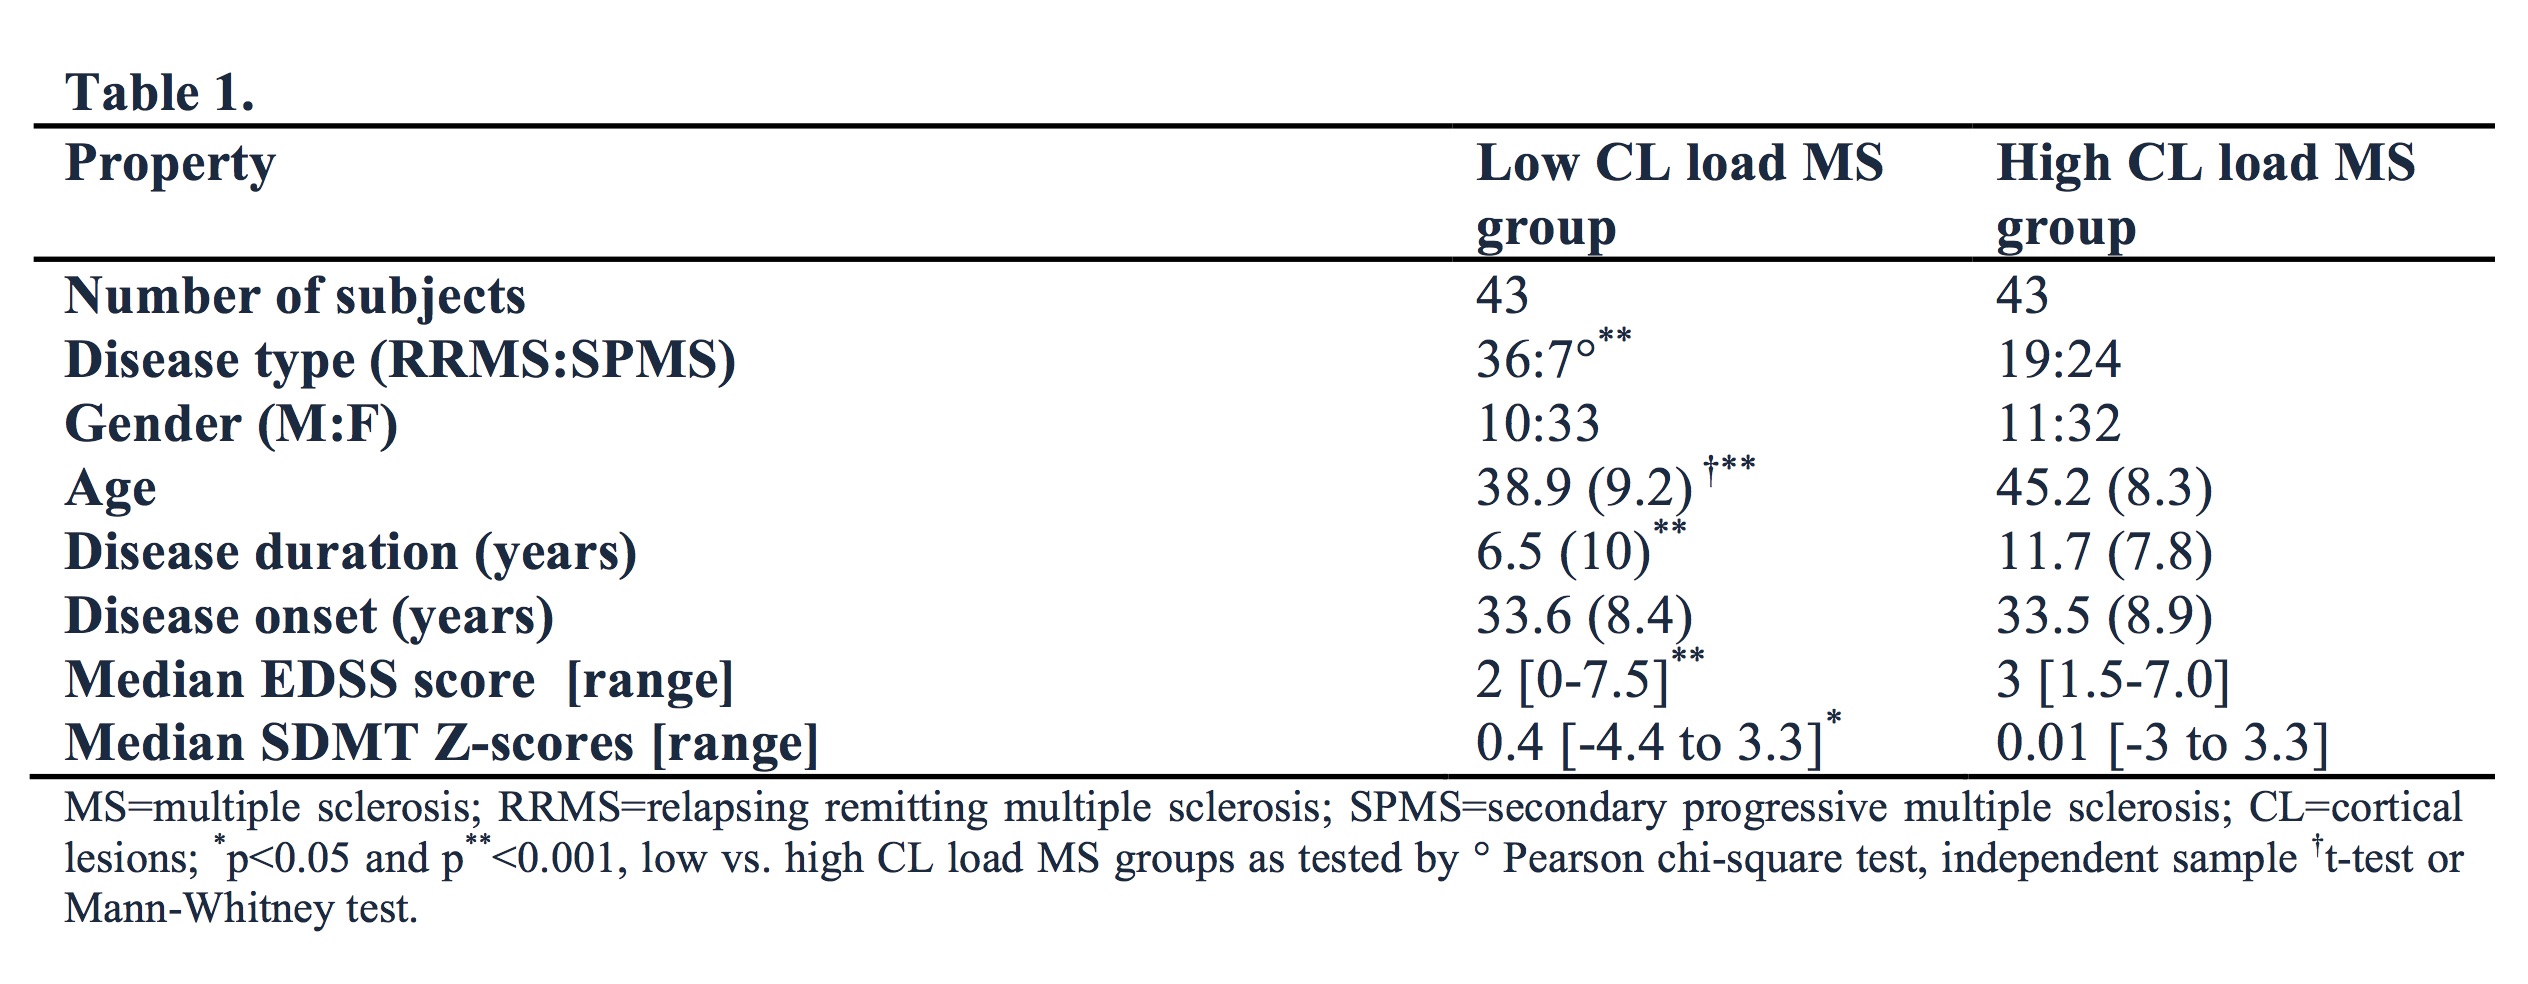
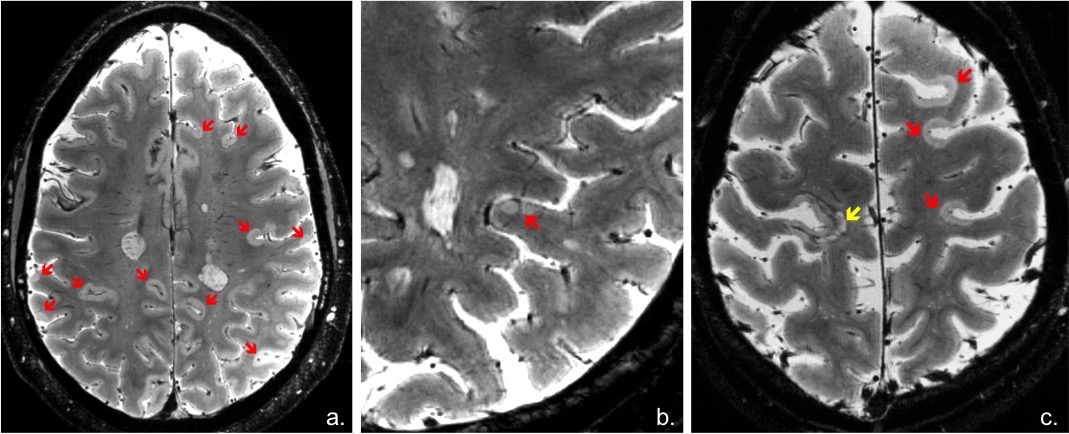
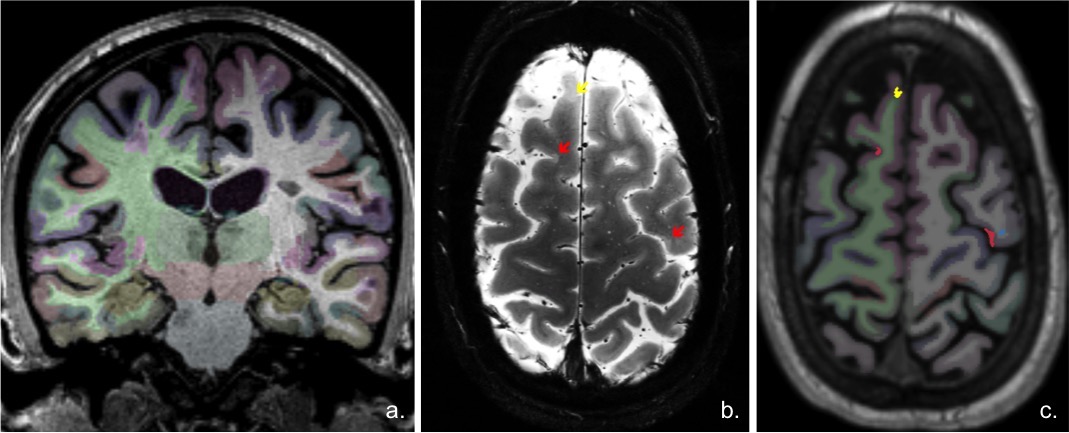
Image acquisition: Sixty subjects with relapsing remitting MS (RRMS) and 26 with secondary progressive MS (SPMS) underwent i). 7 T T2*-weighted images (0.33x0.33x1.0 mm resolution, Siemens scanner) for cortical and WM lesion segmentation and ii). 3D T1-weighted scans (0.9 mm isotropic resolution, Siemens scanner) for cortical surface reconstruction and cortical thickness measurement. Image analysis: CL were identified through consensus of two raters and then classified (Fig. 1) as either intracortical or leukocortical. White matter (WM) lesions were also assessed and all lesions were segmented using Slicer 4.4. Cortical reconstructions were obtained after semi-manual corrections of topological disconnections in FreeSurfer 5.3.0 and mean cortical thickness (averaged across hemispheres) was calculated. The Destrieux atlas was used for cortical parcellation and both cortical thickness and CL volume from each cortical region (Fig. 2) were extracted. All lesion counts and volumes were computed using Freesurfer an FSL tools. CL were sampled across the whole cortex to generate lesion probability maps. Patients were further dichotomized based on median CL count resulting in a high (n=43) and low CL load MS (n=43) groups that differed from each other regarding demographic and clinical characteristics (Table 1). Patients were also evaluated clinically by means of Expanded Disability Status Scale (EDSS) and Symbol Digit Modalities Test (SDMT). Statistical analysis: Parametric and non-parametric tests in SPSS V.24 were used for comparisons within and between MS groups. Correlation of variables was evaluated by Spearman’s rho correlation coefficient. The relation between MRI metrics and possible predictors of clinical outcomes was assessed by multivariate statistics. A p-value of <0.05 was considered statistically significant.Results:
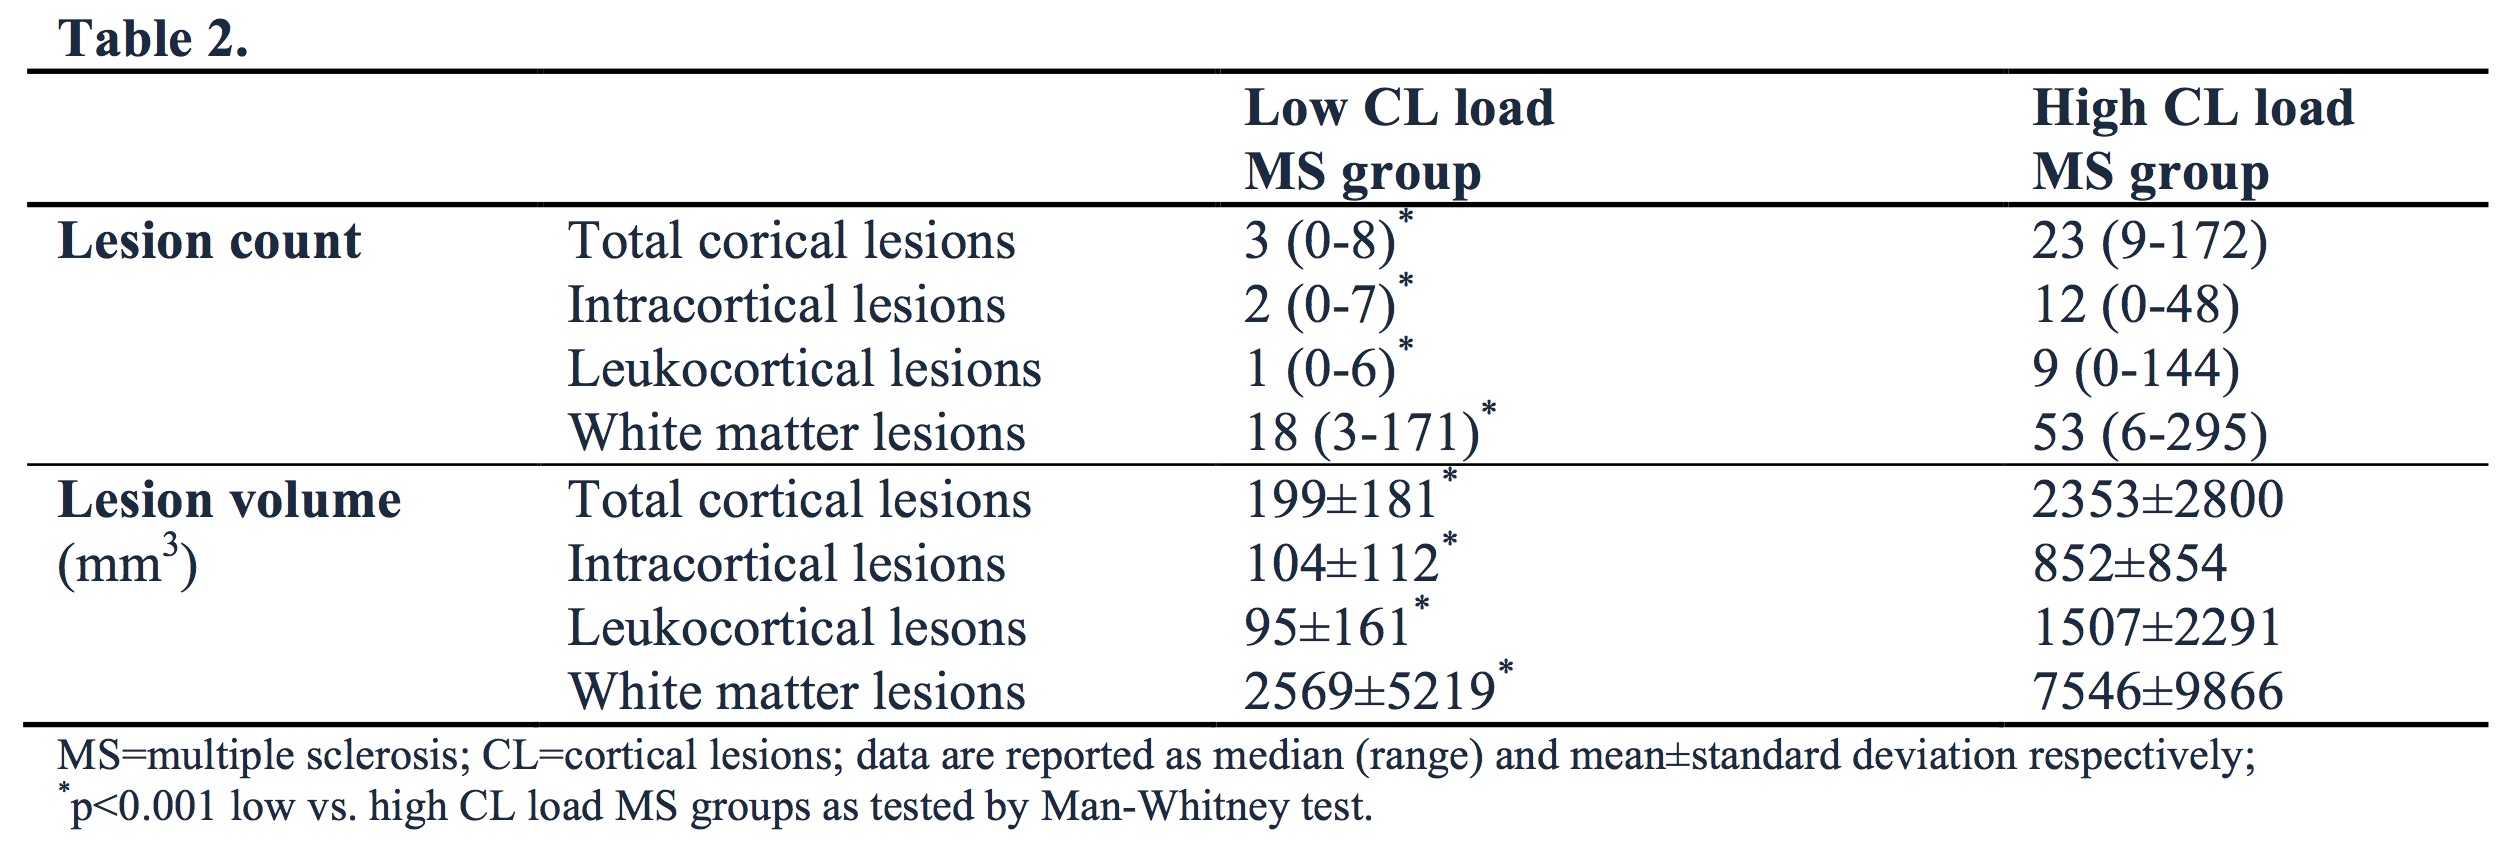
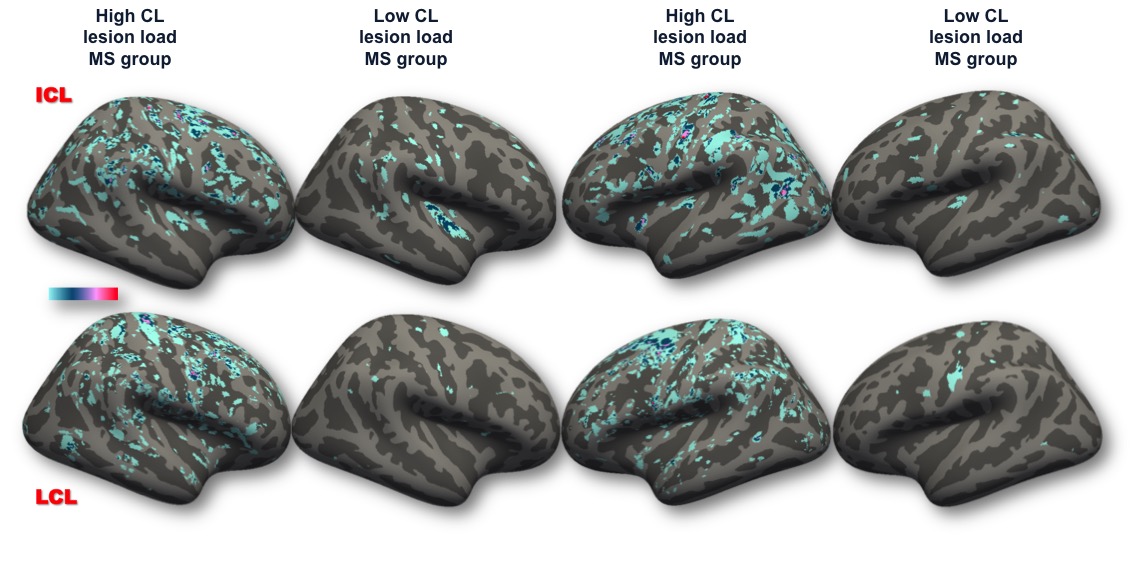
CL were detected in all but two MS cases (97.67%). Overall, subjects with high CL load disclosed a higher WM lesion load (p<0.001, for both count and volume by Mann-Whitney test) than cases with low CL load (Table 2). The difference persisted in RRMS (p<0.001, Mann-Whitney test) however it was lost in progressive disease stages where WM lesion volume was similar across patients with high and low CL load. The spatial distribution of CL was random both in low and high CL load groups as revealed by probability maps, even though a slight lesion predilection for some cortical areas was observed (Fig. 3). The mean cortical thickness (adjusted for age), even if not different overall (high vs. low CL load MS group: mean±standard deviation=2.37±0.16 vs. 2.39±0.16), was lower in 16 cortical regions in the high vs. low CL load group. Nevertheless, the cortical areas with significant thinning did not necessarily correspond to those with higher intracortical lesional volumes. Stepwise regression analysis demonstrated that cortical thinning was explained by WM lesion volume and disease duration (p<0.0005, R2=0.360). For clinical correlations, the retained predictors for EDSS were intracortical lesion count and disease duration (p<0.0005, R2=0.481), while they were leukocortical lesion count and disease duration (p<0.0005, R2=0.294) for SDMT.Conclusion:
Our results demonstrate that CL as seen on ultra-high field MRI are frequently detected in MS (97% of all MS subjects). While in RRMS stages a high CL load is associated with high WM lesion load, in progressive disease CL pathology seems to surpass WM lesion development. Interestingly, WM lesion load resulted as the main pathological determinant of cortical thinning, suggesting that disconnection mechanisms from WM plaques might play a greater role than focal cortical pathology in inducing cortical tissue loss. Finally, our study emphasizes the significant impact of CL pathology to physical disability and cognitive dysfunction in MS, and confirms in a larger patient population earlier observations on the different clinical relevance of CL subtypes.Acknowledgements
This work was supported by the Claffin Award; grants from the National MS Society (NMSS 4281-RG-A1 and NMSS RG 4729A2/1); NIH R01NS078322-01-A1; US Army W81XWH-13-1-0122; Dr. Mainero has received research support from EMD Merck Serono and speaker honoraria from Biogen; Dr. Herranz has received research support by the NMSS fellowship FG¬1507¬05459; Dr. Granberg was supported by the Stockholm City Council and Karolinska Institutet (ALF grants 20120213 and 20150166) and the Swedish Society for Medical Research (post-doctoral fellowship).References
1. Rocca MA, Amato MP, De Stefano N et al. Clinical and imaging assessment of cognitive dysfunction in multiple sclerosis. The Lancet Neurology. 2015;14(3):302–317.
2. Calabrese M, Agosta F, Rinaldi F, et al. Cortical lesions and atrophy associated with cognitive impairment in relapsing-remitting multiple sclerosis. Arch Neurol. 2009;66(9):1144–1150.
3. Nielsen AS, Kinkel RP, Madigan N et al. Contribution of cortical lesion subtypes at 7T MRI to physical and cognitive performance in MS. Neurology. 2013;81(7):641-649.
4. Calabrese M, Poretto V, Favaretto A, et al. Cortical lesion load associates with progression of disability in multiple sclerosis. Brain. 2012;135(Pt 10):2952-2961.
5. Kilsdonk ID, Jonkman LE, Klaver R et al. Increased cortical grey matter lesion detection in multiple sclerosis with 7 T MRI: a post-mortem verification study. Brain. 2016;139(Pt 5):1472-1481.
Figures