0090
Linking macrostructural and microstructural damage in early MS: a geostatistical and diffusion MRI study1Queen Square MS Centre. Neuroinflammation department. UCL Institute of Neurology, University College London, London, United Kingdom, 2Department of Geoinformatics - Z_GIS, Salzburg University, Salzburg, Austria, 3Department of Neurology, Christian Doppler Medical Center, Paracelsus Medical University, Salzburg, Austria, 4Translational Imaging Group, CMIC, Department of Medical Physics and Biomedical Engineering, University College London, London, United Kingdom, 5Department of Medical Statistics, London School of Hygiene and Tropical Medicine, University of London, London, United Kingdom, 6Department of Brain and Behavioural Sciences, University of Pavia, Pavia, Italy, 7Brain MRI 3T Research Centre, C. Mondino National Neurological Institute, Pavia, Italy
Synopsis
Macroscopic white matter (WM) lesion volume has been extensively used to predict disability progression in multiple sclerosis (MS). However, currently used lesion-related metrics fail to capture the complexity of WM-lesion spatial distribution. Here we used geostatistics, an emerging approach to model spatial data projected onto a common coordinate space, to characterise the spatial distributional features of WM lesions of patients with their first MS attack, the clinical relevance of lesion distributional properties and their microstructural correlates, through diffusion MRI. We conclude that WM-lesion spatial distributional features reveal novel aspects of MS pathology, are clinically relevant and possess specific microstructural features.
Background
White matter (WM) lesion volume has been extensively used to predict disability progression in multiple sclerosis (MS)1. However, currently used lesion-related metrics result from averaging over the whole brain or certain regions of interest, failing to capture the complexity of the spatial distribution of brain damage.
Geostatistics is an emerging approach to model spatial data projected onto a common multi-dimensional coordinate space, in a multivariate manner2,3. The geostatistical variogram describes the amount of spatial correlation within a spatial data set. In neuroimaging, geostatistics can characterise lesion geometric-morphometric features beyond lesional volume2,3.
To date, the association between specific spatial distributions of macroscopic WM lesions and clinical outcomes is not known. Moreover, it is unclear whether the spatial distribution of WM lesions reflects specific underlying pathological features. Here we aim to investigate both questions: we characterised, through geostatistics, the spatial distributional aspects of WM lesions of patients with a first MS attack. We also assessed the association of WM-lesion spatial distributional metrics with cognitive performance and microstructural features, obtained with diffusion MRI.
Methods
Subjects:
Thirteen patients within 3 months of their first MS attack (7 females, mean age 37.5 yrs.) who had macroscopic WM lesions on their brain MRI scan were cognitively assessed on the Paced Auditory Serial Addition Test (PASAT).
MRI acquisition & pre-processing:
T1-weighted (resolution=1x1x1mm3, TE/TR: 3.2/7.0ms); Axial PDT2-FAST images (resolution=1x1x3mm3; TE1/TE2/TR =15/85/3500ms); multi-shell diffusion-weighted (DW) images (resolution=2.5x2.5x2.5mm3, TE/TR=82ms/12s, 53 directions at b=300/711/2000 s/mm2). DW and T1-weighted images underwent conventional pre-processing4. T2-weighted images were used to manually outline T2-hyperintense WM lesions. Binary WM-lesion masks were obtained. As a preliminary approach, diffusion-tensor analysis of the DW images using the highest b-value was performed to obtain maps of fractional anisotropy (FA), mean (MD), radial (RD) and axial (AD) diffusivity. All maps were co-registered to MNI space. Afterwards, we obtained mean values (across voxels) of FA, MD, RD and AD within the WM-lesion masks, for each patient.
Variogram analysis:
We obtained 3D directional variograms of the WM-lesion masks for each subject, describing the variability in the 3D spatial data set between points separated by a given Euclidean distance h as a function of that distance. An exponential model function was fitted to the variogram, allowing us to extract the metrics sill, i.e. the maximum variability reached within the spatial data set, and the range, i.e. the distance at which that maximum variability is reached (Fig1). Range and sill, obtained for three directions in the space (x,y,z), were log-transformed due to their skewness and averaged.
Statistical analysis:
Multiple linear regression assessed the relationship between geostatistical metrics (sill and range) and i) PASAT scores; ii) diffusion-related metrics. All 95% confidence intervals (95% CI) and p-values were obtained using bias-corrected non-parametric bootstrap with 1000 replicates.
Results
Mean lesion volume was 4.13mL (minimum-maximum: 0.03-14.69mL). Within-lesion mean values of diffusion-weighted metrics were: 0.34±0.05 units (FA), 0.86±0.14*10-3 mm2/s (MD), 0.70±0.13*10-3 mm2/s (RD) and 1.18±0.17*10-3 mm2/s (AD).
Characterisation of WM-lesion spatial distribution:
When range and sill value were obtained for each WM-lesion mask, it could be observed that patients with smoother lesions, i.e. less spiculated lesions, with smaller surface-to-volume ratio, had greater range values. Patients with greater range tended to have greater sill values (r=0.5277, p=0.068) (Fig2). Greater sill values were strongly associated with greater lesion volumes (r=0.7939, p=0.001). So, we focused on range values, not associated with lesion load (r=0.1830, p=0.5496) and therefore able to provide complementary information to conventional lesion-based metrics (Fig3).
Association between geostatistical metrics and cognitive performance:
Greater range values were associated with better cognitive function: per each unit increase in xyz-average of log(range), PASAT scores increased by 8.69 (bootstrap-based 95%CI 3.74 to 20.28, p=0.025) (Fig4).
Association between geostatistical and within-lesion diffusion-based metrics:
Greater range values were associated with lower mean MD, RD and AD: per each unit increase in x,y,z-average log(range), there was a change of -0.14*10-3 mm2/s (-0.33 to -0.02*10-3 mm2/s, p=0.04), -0.12*10-3 mm2/s (-0.31 to -0.01*10-3 mm2/s, p=0.04) and -0.18*10-3 mm2/s (-0.41 to -0.04*10-3 mm2/s, p=0.01) in MD, RD and AD, respectively (Fig5).
Discussion
The geostatistical analysis of MS lesions reveals novel aspects of the disease beyond conventional lesion volumetric measures. The strong association between geostatistical metric range, denoting lesion smoothness, and better cognitive performance suggests that the spatial distributional aspects of macroscopic lesions in this condition may be clinically relevant. Importantly, such clinical relevance could be explained by the milder tissue destruction (i.e. lower tissue diffusivity from diffusion MRI) observed in lesions with greater smoothness.Conclusions
Geostatistical analysis of macroscopic damage in MS may provide new crucial disease biomarkers. Larger studies are warranted.Acknowledgements
The NMR unit/Queen Square MS Centre where this work was performed is supported by grants from the Multiple Sclerosis Society of Great Britain and Northern Ireland, Philips Healthcare, and supported by the UCL/UCLH NIHR (National Institute for Health Research) BRC (Biomedical Research Centre).
CT has received a post-doctoral research ECTRIMS fellowship (2015). She has also received honoraria and support for travelling from Teva Pharmaceuticals Europe and Ismar Healthcare.
RM, DRA and SC have nothing to disclose.
FP receives a Guarantors of Brain fellowship.
SO is funded by the National Institute for Health Research University College London Hospitals Biomedical Research Centre (NIHR BRC UCLH/UCL High Impact Initiative BW.mn.BRC10269). SO also receives funding from the EPSRC (EP/H046410/1, EP/J020990/1, EP/K005278), the MRC (MR/J01107X/1) and the NIHR Biomedical Research Unit (Dementia) at UCL. FP has also received honoraria from Bioclinica Inc.
CAMGWK receives research grants (PI and co-applicant) from Spinal Research, Craig H. Neilsen Foundation, EPSRC, Wings for Life, UK MS Society, Horizon2020, NIHR/MRC.
OC receives research grant support from the Multiple Sclerosis Society of Great Britain and Northern Ireland, the NIHR UCLH Biomedical Research Centre, and she is a consultant for Teva, Roche, Novartis, Biogen, Genzyme and GE. She is an Associate Editor for Neurology, for which he receives an honorarium.
References
1. Fisniku LK, Brex PA, Altmann DR, et al. Disability and T2 MRI lesions: a 20-year follow-up of patients with relapse onset of multiple sclerosis. Brain. Mar 2008;131(Pt 3):808-817.
2. Marschallinger R, Golaszewski SM, Kunz AB, et al. Usability and potential of geostatistics for spatial discrimination of multiple sclerosis lesion patterns. J Neuroimaging. May-Jun 2014;24(3):278-286.
3. Marschallinger R, Schmidt P, Hofmann P, et al. A MS-lesion pattern discrimination plot based on geostatistics. Brain Behav. Mar 2016;6(3):e00430.
4. Andersson JL, Sotiropoulos SN. An integrated approach to correction for off-resonance effects and subject movement in diffusion MR imaging. Neuroimage. Jan 15 2016;125:1063-1078.
Figures
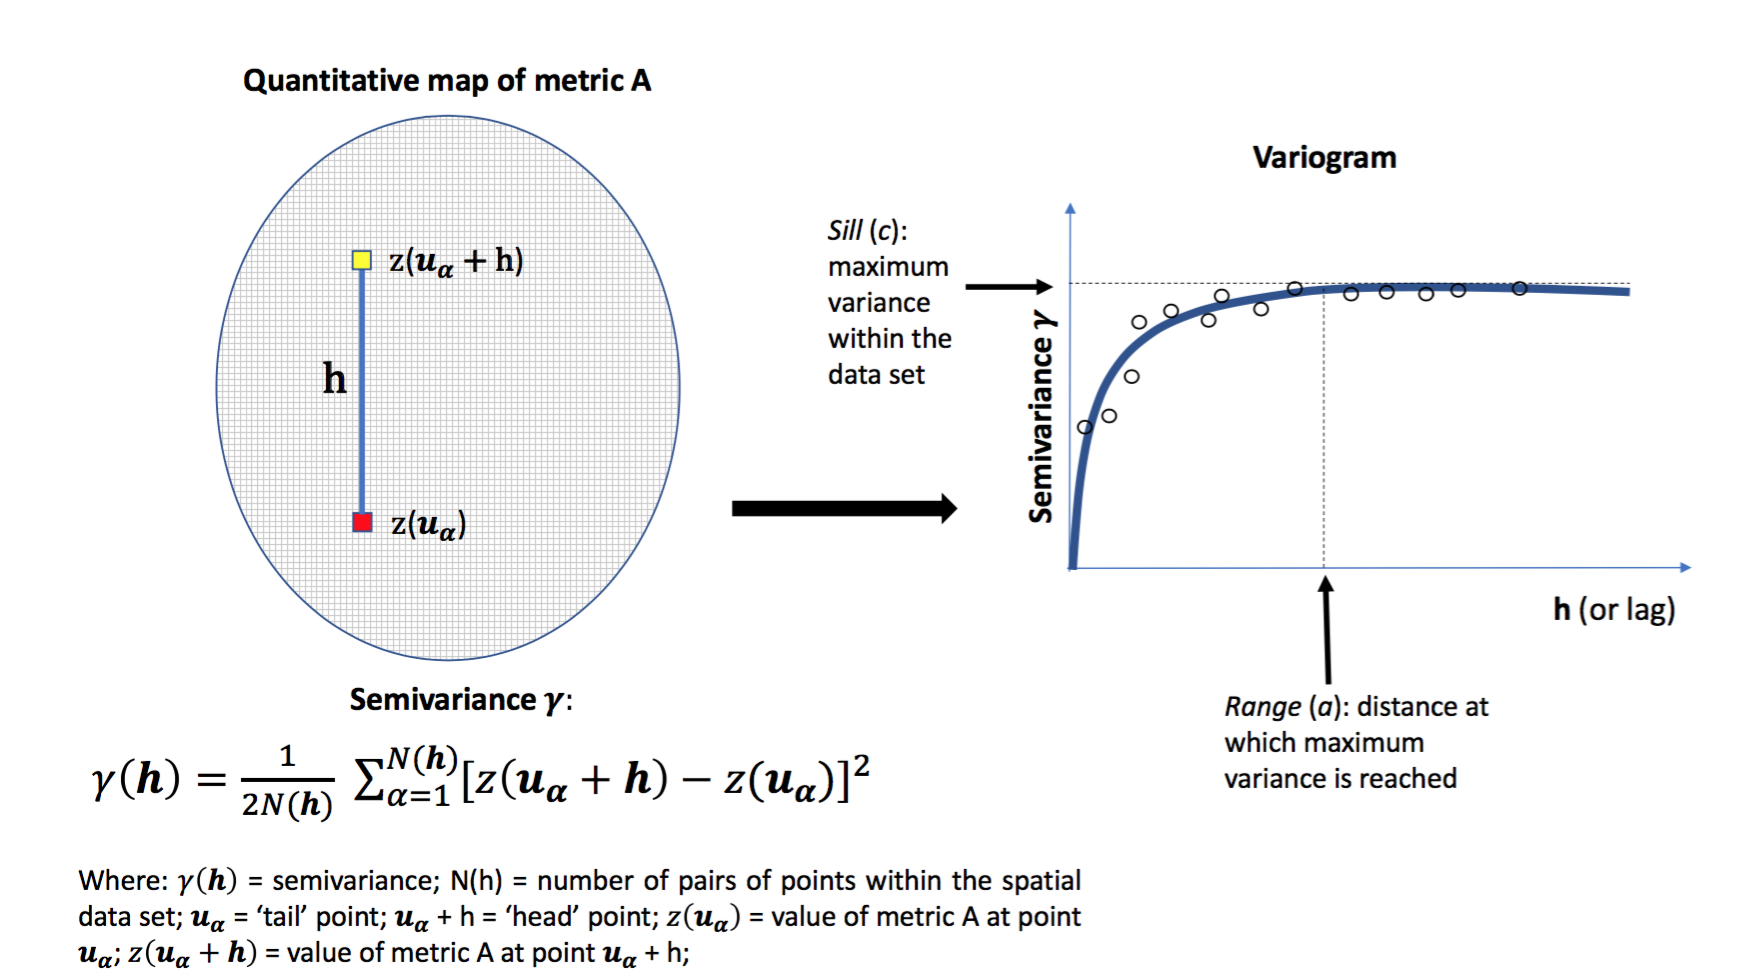
Figure 1. The variogram
This figure shows how the geostatistical variogram is built. It describes the amount of spatial correlation within a spatial data set.
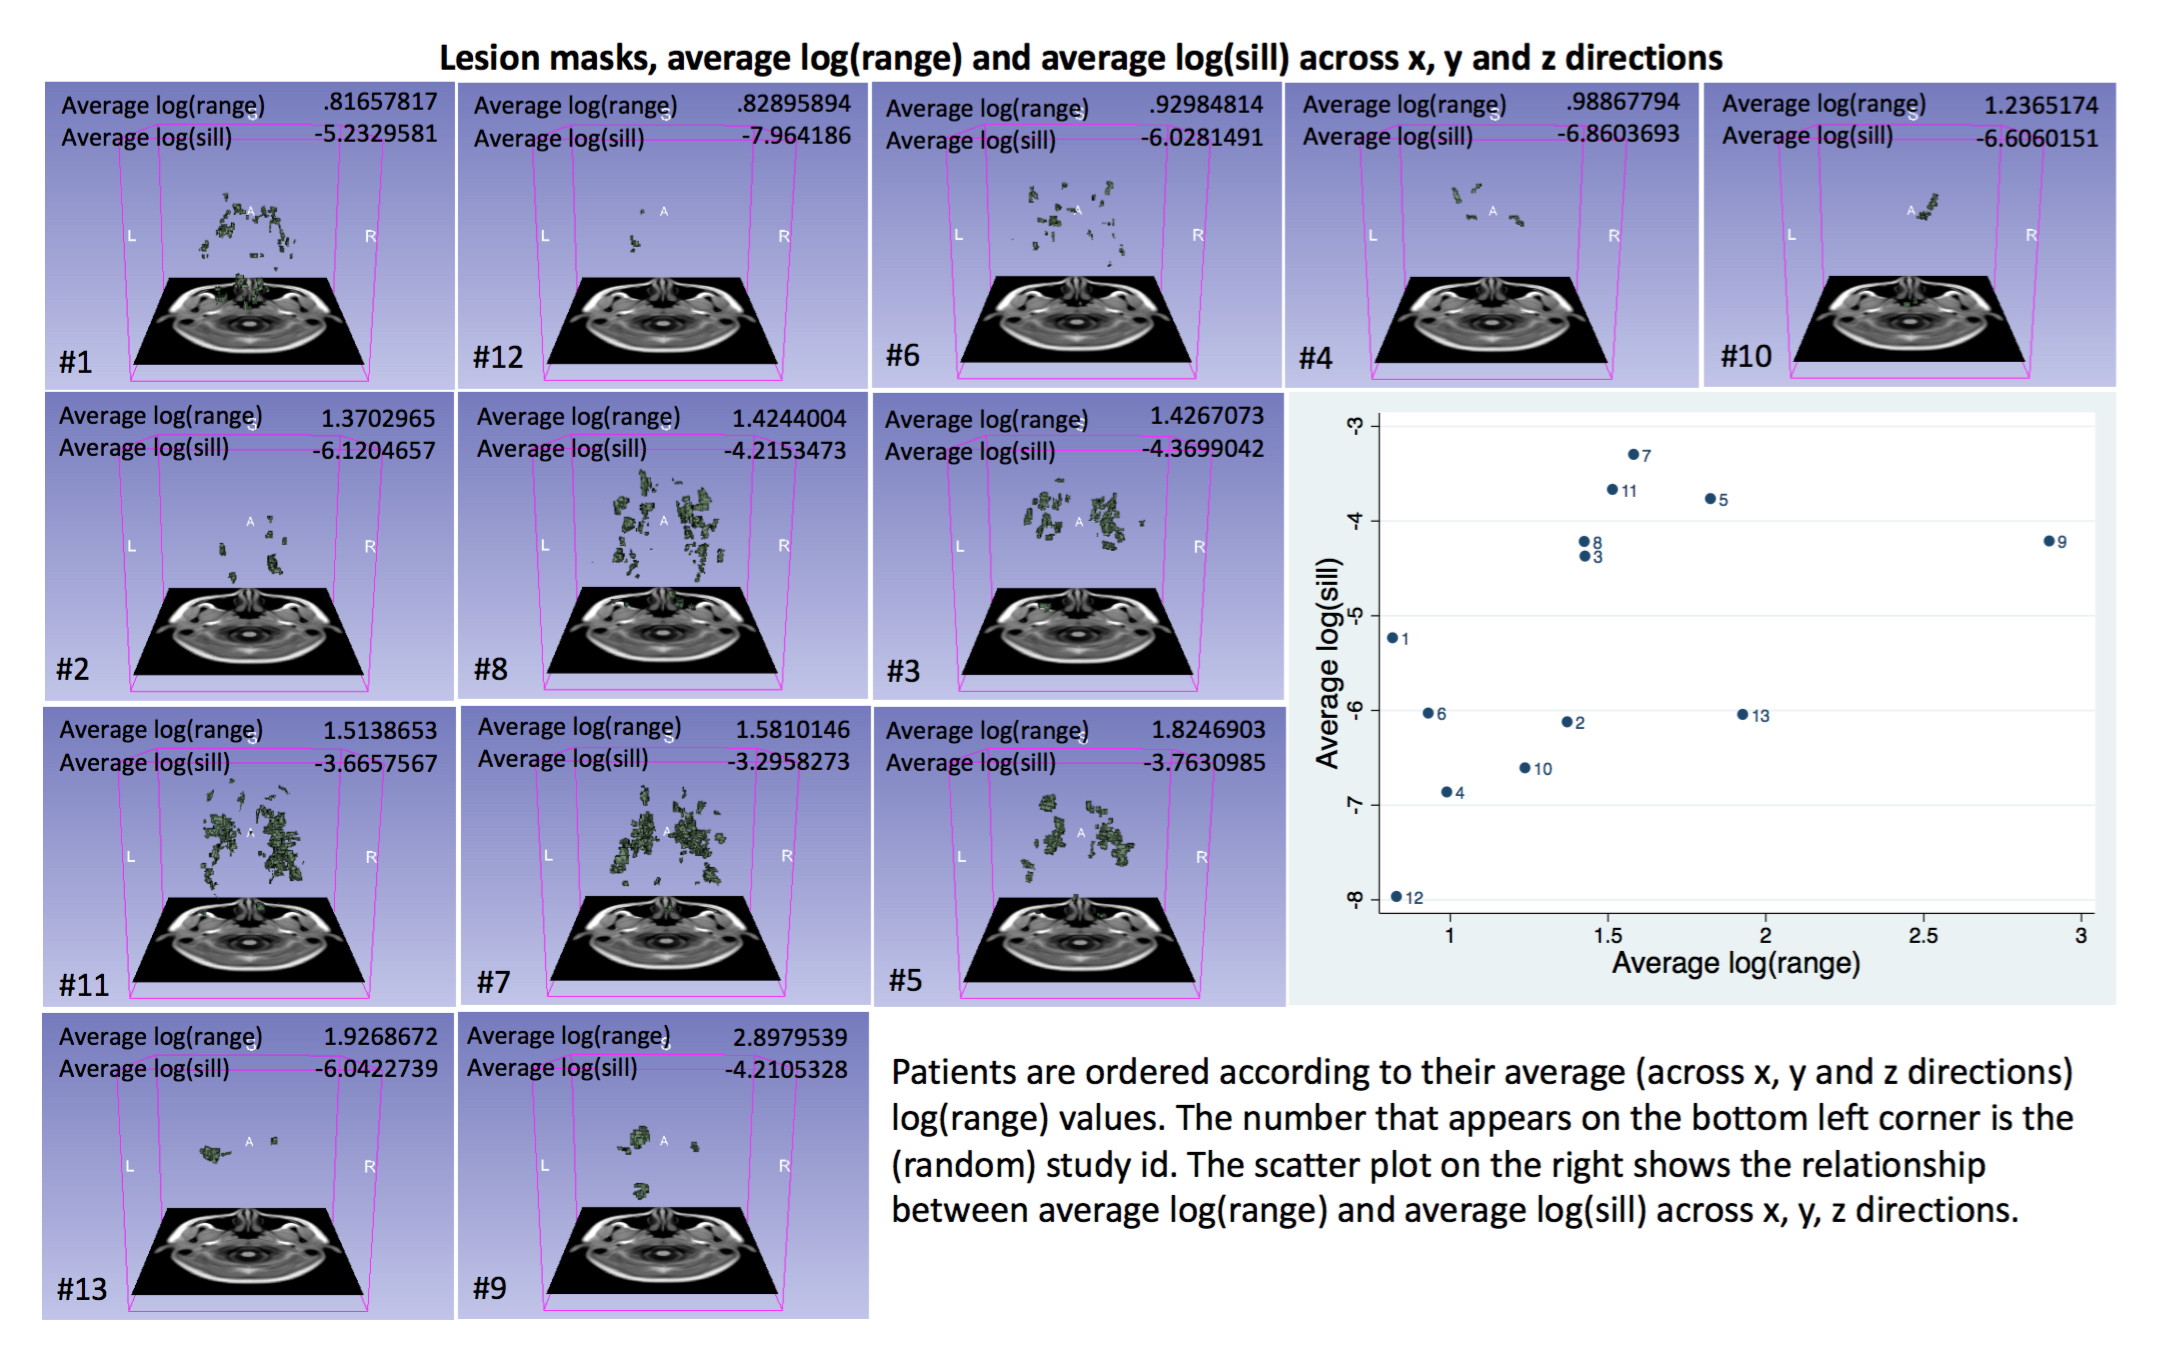
Figure 2. Individual lesion masks and geostatistical metrics
This figure shows the individual lesion masks and their corresponding x,y,z-average log(range) and log(sill). Patients with smoother (i.e. less spiculated) lesions, i.e. smaller lesion surface in relation to their volume, had greater range values. This figure also shows the (weak) relationship between x,y,z-average log(range) and log(sill) (p=0.068).
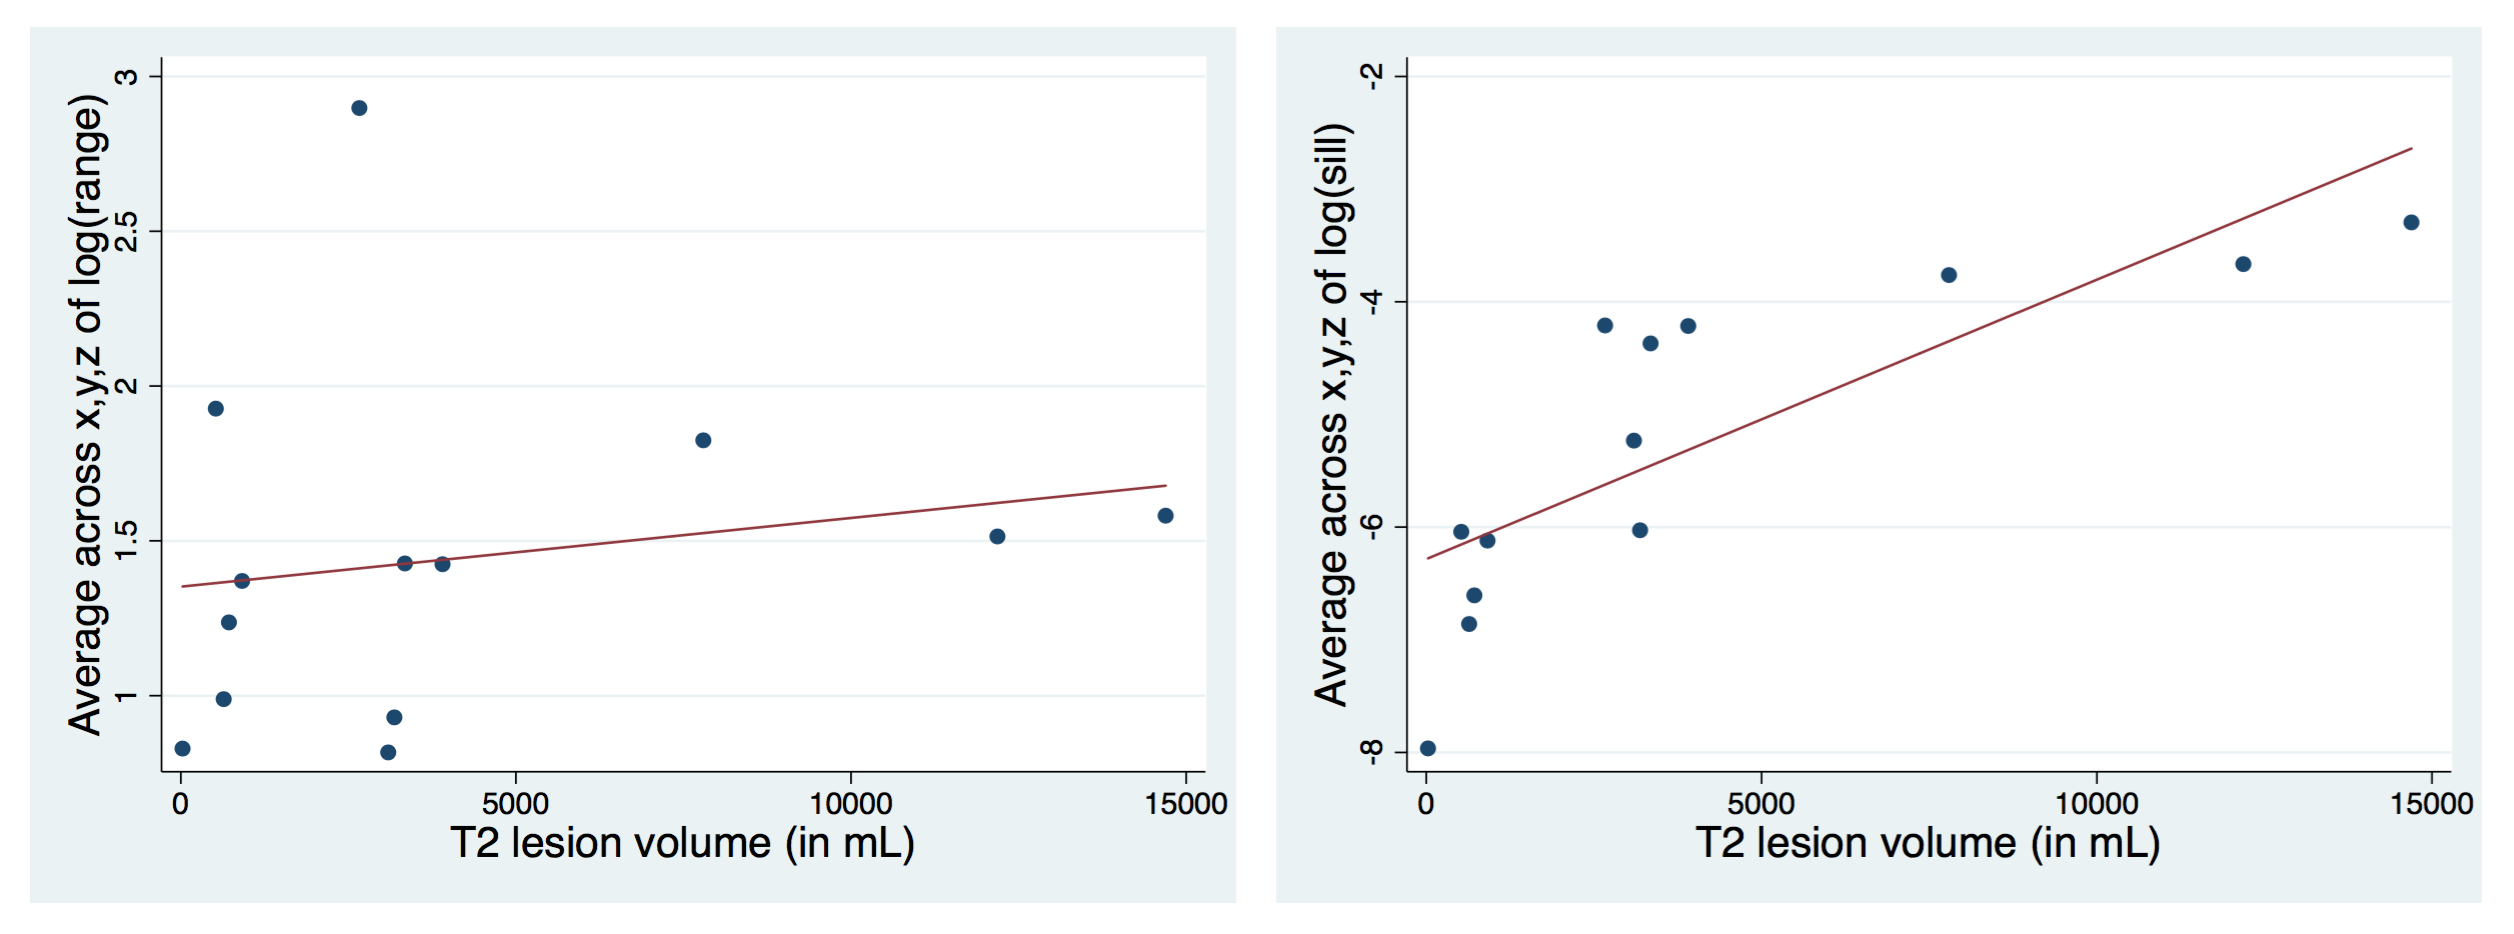
Figure 3. Relationship between geostatistical metrics and lesion load
As can be observed, there is a strong relationship between x,y,z-average log(sill) and lesion volumes (right plot: r=0.7939, p=0.001), which is not observed for x,y,z-average log(range) (left plot: r=0.1830, p=0.5496). This indicates that x,y,z-average log(range) may provide complementary information to conventional lesion-based metrics and we will focus on that metric from now on.
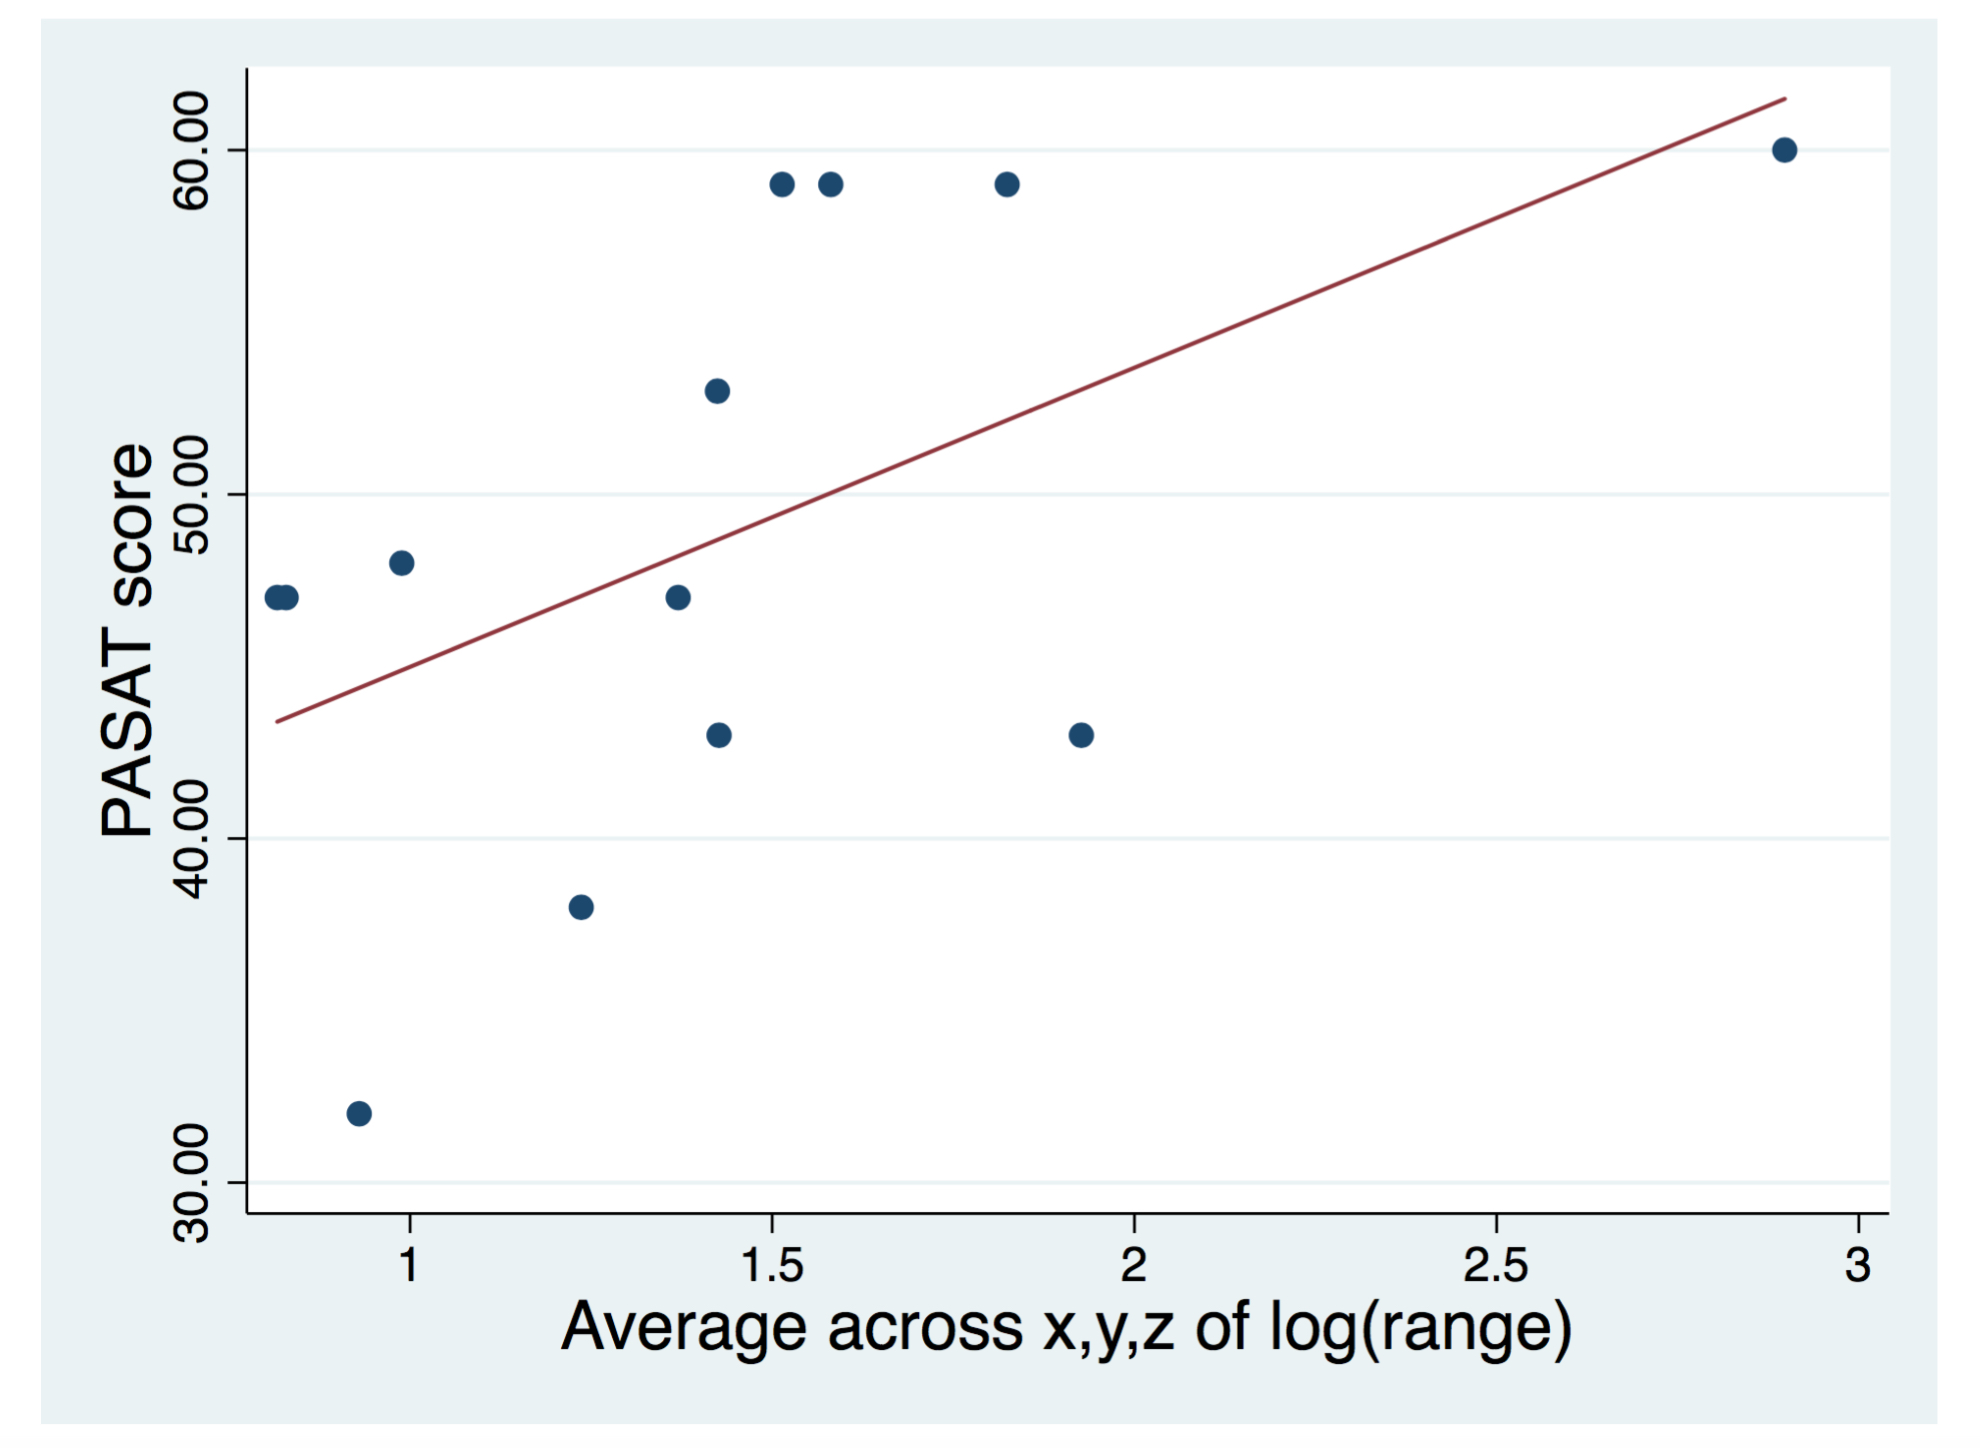
Figure 4. Relationship between geostatistical metrics and cognitive performance
As can be observed, there is a markedly positive relationship between x,y,z-average log(range) and PASAT scores (p=0.025), suggesting geostatistical analysis of WM lesions in MS may provide clinically relevant information.
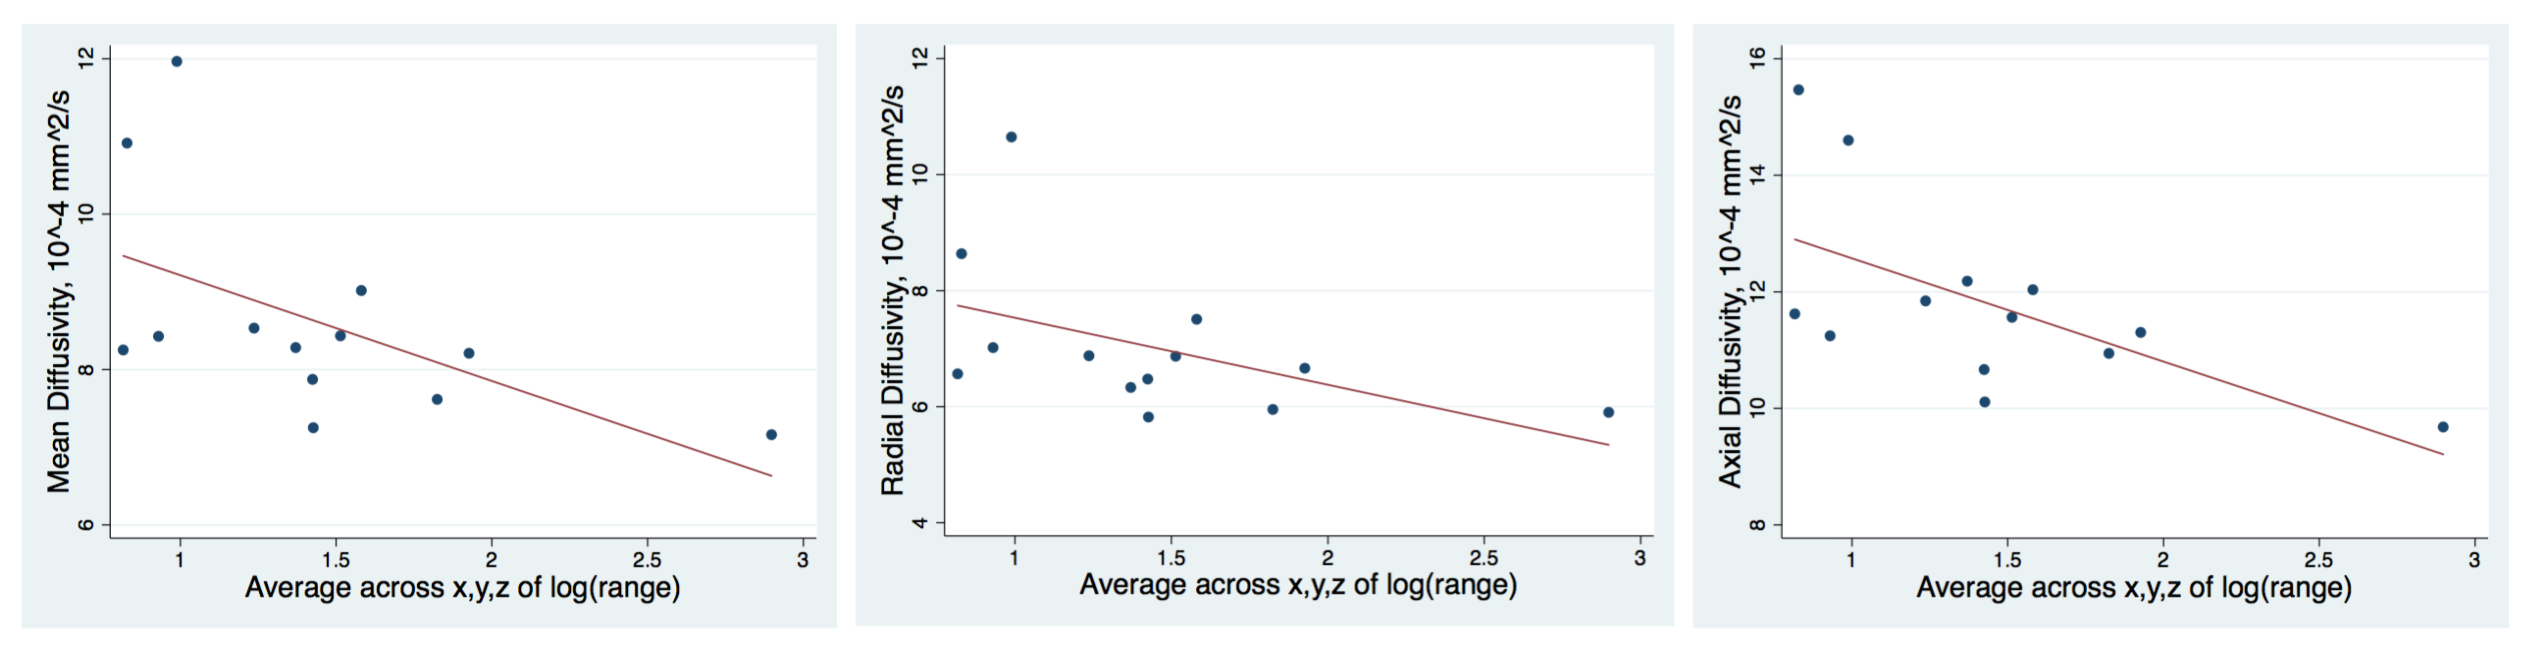
Figure 5. Relationship between geostatistical metrics and within-lesion microstructural metrics
Greater lesion smoothness was associated with milder tissue destruction, i.e. lower mean (left), radial (middle) and axial (right) diffusivity. Please note that, for graphical purposes, the units of the diffusion-based metrics displayed in the figure are *10-4 mm2/s. See text for more details.