0088
A multi-parametric study of MS lesionsMara Cercignani1,2, Camilla Vizzotto1, Davide Esposito1, Barbara Spano2, Giovanni Giulietti2, and Marco Bozzali1,2
1Department of Neuroscience, Brighton & Sussex Medical School, Brighton, United Kingdom, 2Neuroimaging Laboratory, Santa Lucia Foundation IRCCS, Rome, Italy
Synopsis
Counter-intuitively, reduced orientation dispersion has been reported in MS lesions, and confirmed by histology. Here we classify lesional tissue based on its orientation dispersion, and we compute a series of indices from from diffusion and magnetization transfer MRI to highlight potential differences in the pathological substrate of lesions with reduced vs increased orientation dispersion. We show that lesions with reduced dispersion are more likely to show extensive demyelination and axonal loss.
Purpose
Although our understanding of the pathological mechanisms implicated in MS has greatly improved, we are still unable to fully comprehend the the lack of correlation between the lesion burden and the clinical manifestation of the disease. A potential explanation is the complex interaction between inflammatory, degenerative and repair mechanisms occurring within MS lesions. Recently it was proposed that indices of neurite dispersion derived from neurite orientation dispersion and density imaging (NODDI1), can provide useful biomarkers of MS pathology2. Both increased3 and decreased2,4 orientation dispersion have been reported within MS lesions. These controversial findings have prompted us to conduct an extensive analysis of lesional tissue combining diffusion and magnetization transfer (MT) imaging to explore the potential causes of altered orientation dispersion within MS lesions.Methods
Thirty-three patients with MS (14 with secondary-progressive (SP) and 19 with relapsing-remitting (RR) course) and 24 healthy controls participated in the study. MRI was acquired at 3T using a 3-shell diffusion MRI protocol and quantitative MT5. FLAIR, T2-weighted and T1-weighted scans were collected for identifying macroscopic lesions. Lesions were outlined on FLAIR scans using a semi-automated local thresholding contouring software (Jim 5.0, Xinapse System, West Bergholt, Essex, UK, http://www.xinapse.com/), and binary lesions masks were generated. MT and NODDI data were processed as described elsewhere5, yielding maps of the pool size ratio (F), believed to reflect myelination, the neurite density index (NDI), the orientation dispersion index (ODI), and the isotropic volume fraction (ISO), representing free water. Maps of the g-ratio, i.e., the inner-to-outer axonal diameter ratio, were also obtained combining multiple modalities6. All these parameters are known to vary topographically across the brain, therefore, in order to identify lesions with truly increased/decreased ODI, we built up a ODI template derived from the healthy control data, by normalising ODI maps from controls to standard MNI space, and then computing the mean and standard deviation (SD) voxel-wise. A map of the local microstructure complexity was obtained by fitting the persistent angular structure (PAS7) model to the outer shell of the diffusion MRI data in healthy controls. The maps of the estimated number of peaks (n=1,2,≥3) per voxel were normalised and averaged. All the quantitative maps and lesion maps from patients were also normalised to the same space. Lesional tissue was classified as having increased ODI if the value was larger than the anatomically corresponding control [mean + 1 SD], or as having decreased ODI if it was lower than the control [mean – 1 SD]. For each patient, we extracted the mean F, NDI, ISO, and g-ratio for all the lesional voxels with increased ODI and decreased ODI, respectively. These were then compared, separately for SP and RRMS, using paired sample T-tests. We also looked at associations with the expanded disability status scale (EDSS) and the subscores of the MS functional composite score (MSFC). Finally we chose 2 representative patients, with similar lesion load and differing phenotype, and looked at the detailed distribution of microstructural indices within high and low ODI lesional voxels.Results
Our analysis confirmed that ODI can be both, increased and decreased within MS lesions (Fig 1). In SPMS, 31(±16)% of lesional tissue had increased and 31(±16)% had reduced ODI. In RRMS, 15 (±10)% had increased, and 26(±15)% had reduced ODI. When comparing these 2 classes of tissue, we found that low ODI lesions were located in areas of the white matter with a significantly larger number of diffusion directions then high ODI ones (p=0.001 in both phenotypes). In addition, low ODI lesions have lower F (p=0.017) in RRMS only, and higher g-ratio in both phenotypes (p=0.008 and p<0.001, respectively). The NDI and g-ratio of low ODI lesions were significantly associated with scores of cognitive impairment in RRMS. When pooling all patients together, significant correlations were found between NDI of low ODI lesions and all clinical scores. When looking at 2 representative patients we observed that low ODI lesional voxels tend to have lower NDI and F, and higher g-ratio than high ODI ones (Fig 2), particularly for the SPMS case.Discussion and Conclusion
Our study confirms that ODI can both increase and decrease inside MS lesions. While part of the explanation could be that reductions are observed in areas of originally more complex microstructure, this is only part of the story. Our data also suggest that lesions with reduced ODI have more extensive demyelination and axonal loss. This pattern appears particularly evident in the selected SPMS case. In conclusion, our data support the hypothesis that increased ODI might correspond to lesions/lesion regions undergoing inflammatory processes, while reduced ODI might result from more chronic tissue damage and thus identify lesions with impact on clinical manifestation.Acknowledgements
This work was funded by a grant from the Italian Ministry of Health (RF-2013-02358409)References
1. Zhang H, et al. NODDI: practical in vivo neurite orientation dispersion and density imaging of the human brain. Neuroimage 2012, 61: 1000-16; 2. Grussu et al. Neurite dispersion: a new marker of multiple sclerosis spinal cord pathology? Ann Clin Transl Neurol 2017; 4:663-79; 3. Granberg et al. In vivo characterization of cortical and white matter neuroaxonal pathology in early multiple sclerosis. Brain 2017; 140; 2912–26; 4.Schneider et al. Sensitivity of multi-shell NODDI to multiple sclerosis white matter changes: a pilot study. Func Neurol 2017; 32:97-101; 5. Mancini et al. Introducing axonal myelination in connectomics: A preliminary analysis of g-ratio distribution in healthy subjects. Neuroimage 2017 (in press); 6. Stikov et al. In vivo histology of the myelin g-ratio with magnetic resonance imaging. Neuroimage 2015, 4: 368-73; 7. Jansons & Alexander. Persistent angular structure: new insights from diffusion magnetic resonance imaging data. Inverse Problems 2003; 19: 1031-46Figures
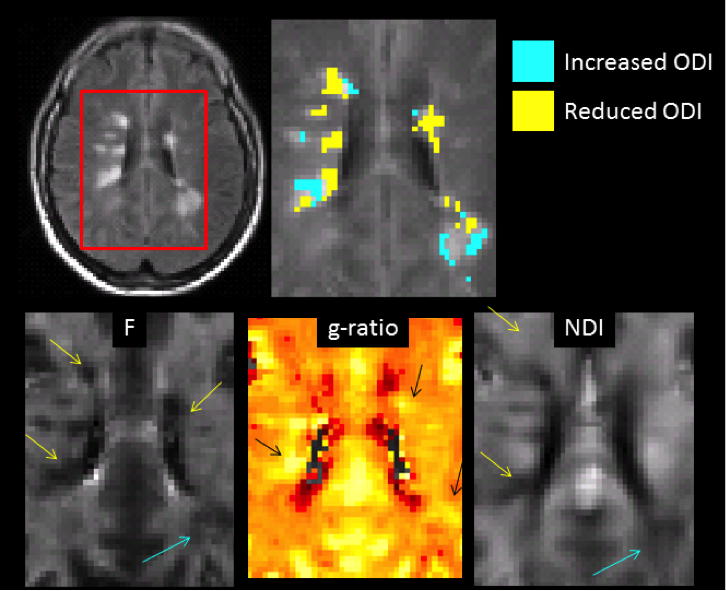
Figure 1.
Appearance of lesions
with elevated or reduced ODI on quantitative maps.
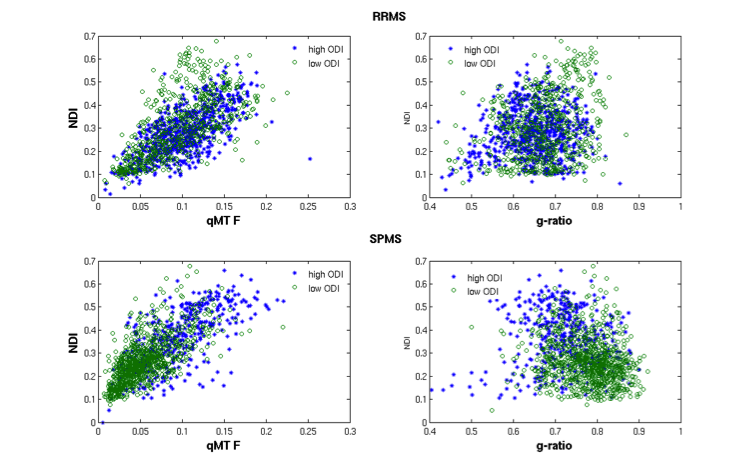
Figure 2.
Scatterplots of NDI
vs F (left) and vs g-ratio (right) for lesional voxel having increased (blue)
and reduced (green) ODI.
Data from 2
representative participants, one with RRMS (top) and the other with SPMS
(bottom) are shown.