0086
A longitudinal study of lesion evolution in Multiple Sclerosis using multi-contrast 7T MRI1Sir Peter Mansfield Imaging Centre, School of Physics and Astronomy, University of Nottingham, Nottingham, United Kingdom, 2Philips Healthcare, Mölndal, Sweden, Mölndal, Sweden, 3Division of Clinical Neuroscience, School of Medicine, University of Nottingham, Nottingham, United Kingdom
Synopsis
We use multi-contrast 7T MRI to evaluate longitudinal changes in white matter tissue properties prior to and after lesion appearance. Four MS patients were scanned 6 times at 6-week intervals, and 20 new lesions were identified on FLAIR images in that period. Of these, 35% showed a hypointense rim and 65% showed no rim in QSM data. Subtle changes in MT, NOE, and QSM relative to NAWM values could be detected 6 weeks prior to the first clinical appearance of new lesions. In future studies, these data will provide insight into specific tissue changes that precede lesion development in MS.
Introduction
Magnetic resonance imaging (MRI) produces excellent soft tissue contrast for the detection of MS lesions in the brain. Previous studies have observed subtle tissue changes prior to the first appearance of new MS lesions in clinical MRI scans, however the specific evolution of tissue properties that precedes lesion appearance remains unclear. This study aimed to use multiple MR contrasts at 7T to evaluate longitudinal changes in white matter (WM) tissue properties prior to and after lesion appearance.Method
Four patients with chronic MS were scanned 6 times every 6 weeks (30 weeks total) on a Philips 7T Achieva system with T/R 32 channel head coils (Nova Medical). In each session, multiple scans with different image contrasts were acquired, including T2*/QSM, PSIR, FLAIR, and z-spectrum data; parameters for all imaging sequences are provided in Figure 1. B0-corrected z-spectra were fitted (via a look up table for the Bloch-McConnell equation) for magnetization transfer (MT) and NOE pool sizes3, taking account of B1 and T1 from maps acquired separately. Susceptibility maps were reconstructed using in-house software4,5. For each individual, all 6 datasets were co-registered to the PSIR scan from the first visit (FLIRT, FSL) and an experienced neurologist identified new WM lesions that developed on FLAIR images during the trial. Lesion evolution was referenced to time of first appearance (time=0). Core, edge and periphery ROIs were drawn for each new lesion by erosion and dilation of the FLAIR mask (Figure 1). Control ROIs were drawn in normal-appearing white matter (NAWM) in contralateral and ipsilateral hemispheres.Results
Over 6 months, 20 new lesions appeared in the 4 MS patients; 35% showed a hypointense rim and 65% showed no rim in the QSM data (Patient 1: 2/5 rim/no rim; Patient 2: 0/1; Patient 3: 2/2 Patient 4:3/5). Figure 2 shows the evolution of lesions with and without a rim in all image types. After the first appearance on FLAIR, new lesions tended to shrink in subsequent timepoints. No changes were observed on FLAIR, PSIR or T2* images before lesion appearance.
At 6 weeks prior to a new lesion being detected on FLAIR, both MT and NOE were reduced compared to values in NAWM; the relative percentage decrease in the lesion ROIs (core, edge and periphery) is shown in Figure 3. Both parameters then recovered within 6-12 weeks after lesion formation (Figure 4). Although the changes were highly heterogeneous, all new lesions with a rim exhibited changes in QSM relative to NAWM 6 weeks before lesion appearance, but no such changes were detected in lesions without a rim. Across all imaging contrasts, we observed greater changes in the lesion core (Figure 4, orange lines) compared to the edges and periphery of the lesion (grey and blue lines) in lesions with a hypointense rim.
Discussions
Frequent radiological monitoring of MS patients, using multiple image contrasts at 7T, provides an opportunity to study the formation of new lesions in unprecedented detail. In a small cohort of 4 patients, we tracked the development of 20 new lesions at 6 week intervals. Subtle changes in MT, NOE and QSM could be detected 6 weeks prior to lesion appearance (identified on FLAIR), suggesting that pathological changes in myelination and iron accumulation precede and may contribute to lesion formation. Lesions with a hypointense paramagnetic rim (identified on QSM images) showed a greater decrease in MT and NOE than lesions without a rim, potentially indicating a different process of lesion evolution in these two lesion categories. Statistical evaluation of these observations is limited by the relatively small number of patients and lesions examined in the study; additional longitudinal scanning with multiple image contrasts is warranted.Conclusion
Frequent repeated scanning of MS patients can successfully track the formation of new lesions; by acquiring multiple image contrasts at 7T, we characterise early changes in MT, NOE and QSM at 6 weeks prior to the clinical appearance of lesions on FLAIR images. In future longitudinal studies, these data will facilitate more sensitive characterisation of the specific tissue changes that precede lesion development in MS.Acknowledgements
No acknowledgement found.References
1. Mougin O, Clemence M, Peters A, Pitiot A, and Gowland P. High-resolution imaging of magnetisation transfer and nuclear overhauser effect in the human visual cortex at 7T. NMR in Biomedicine, 2013;26(11):1508-1517.
2. Mougin O, Abdel-Fahim R, Dineen R, Pitiot A, Evangelou N, and Gowland P. Imaging gray matter with concomitant null point imaging from the phase sensitive inversion recovery sequence. Magn Reson Med. 2016;76(5):1512-1516.
3. Geades N, Hunt B, Shah S, Peters A, Mougin O, and Gowland P. Quantitative analysis of the z-spectrum using a numerically simulated look-up table: Application to the healthy human brain at 7T. Magnetic resonance in medicine, 2017;78(2):645-655.
4. Li W, Avram A, Wu B, Xiao X, and Liu C. Integrated laplacian-based phase unwrapping and background phase removal for quantitative susceptibility mapping. NMR in Biomedicine, 2014;27(2):219-227.
5. Li W, Liu C, Duong T, Zijl P, and Li X. Susceptibility tensor imaging (STI) of the brain. NMR in Biomedicine, 2017;30(4).
Figures
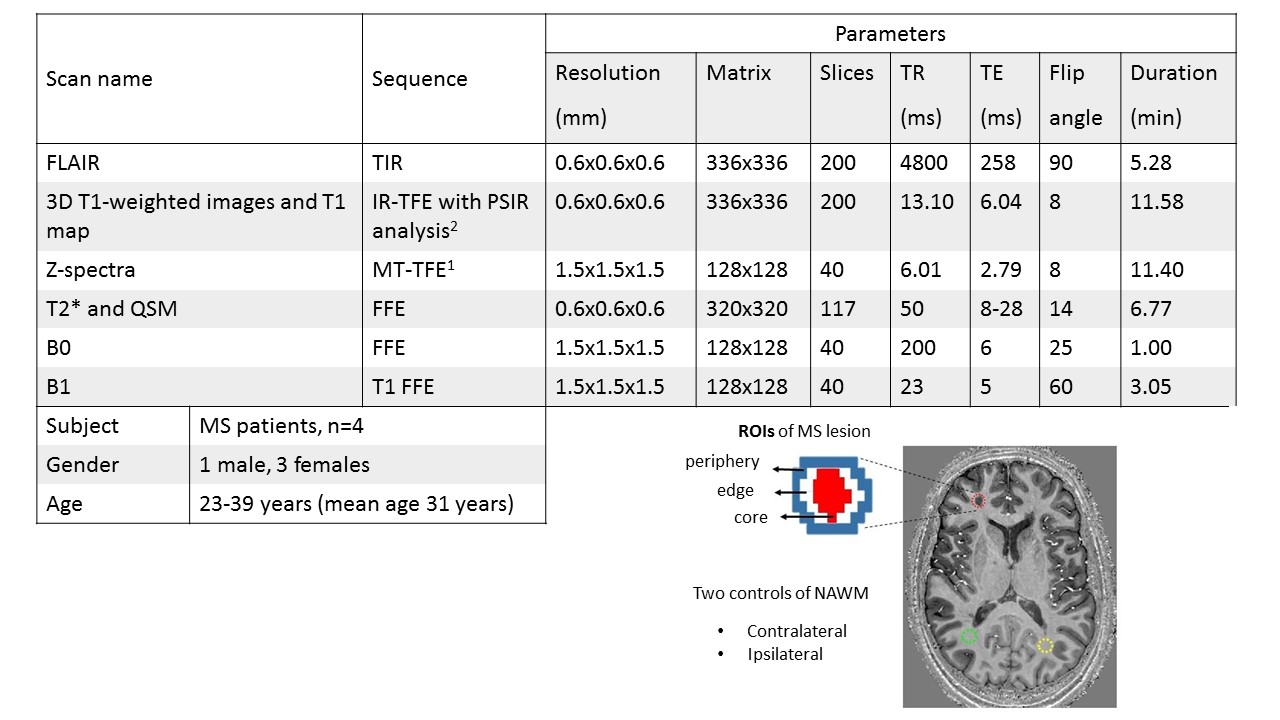
Figure 1 MR sequences and scanning parameters at 7T, and definition of lesion and NAWM ROIs.
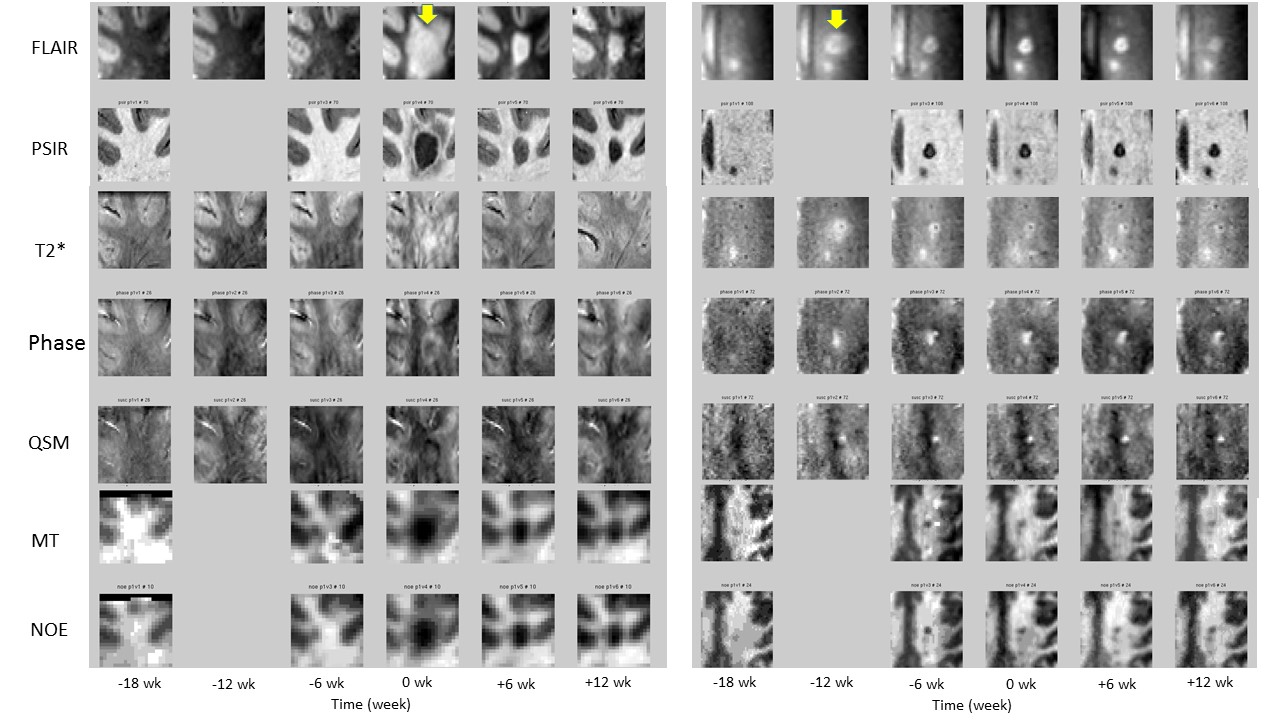
Figure 2 Evolution of a new MS lesion with rim (left) and no rim (right) (as identified in the QSM data) in different scan types: FLAIR, PSIR, T2*, phase, QSM, MT and NOE. Scan times were normalised to the first appearance of a new lesion (t=0) as determined by a neurologist (arrow).
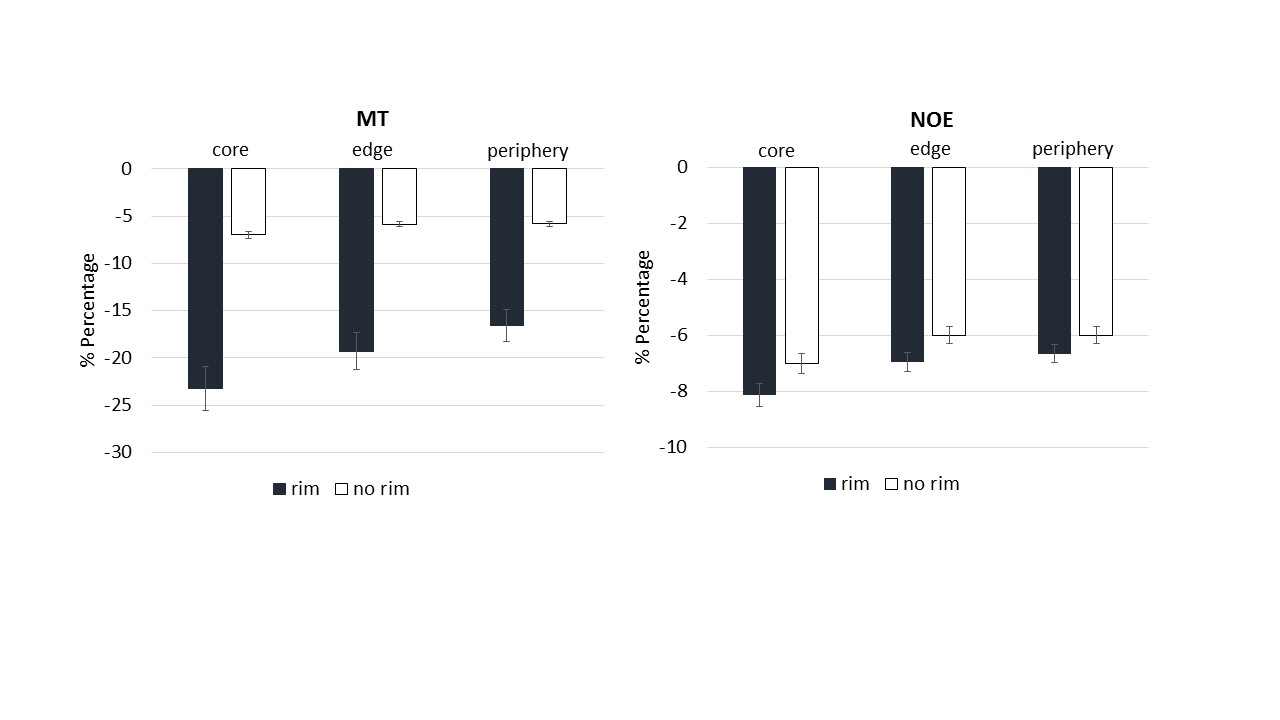
Figure 3 Average percentage decrease in MT and NOE, relative to NAWM values, between time of lesion appearance on FLAIR and 6 weeks earlier (mean +/- interlesion SD). Results are differentiated for lesions with and without a rim in the QSM data.
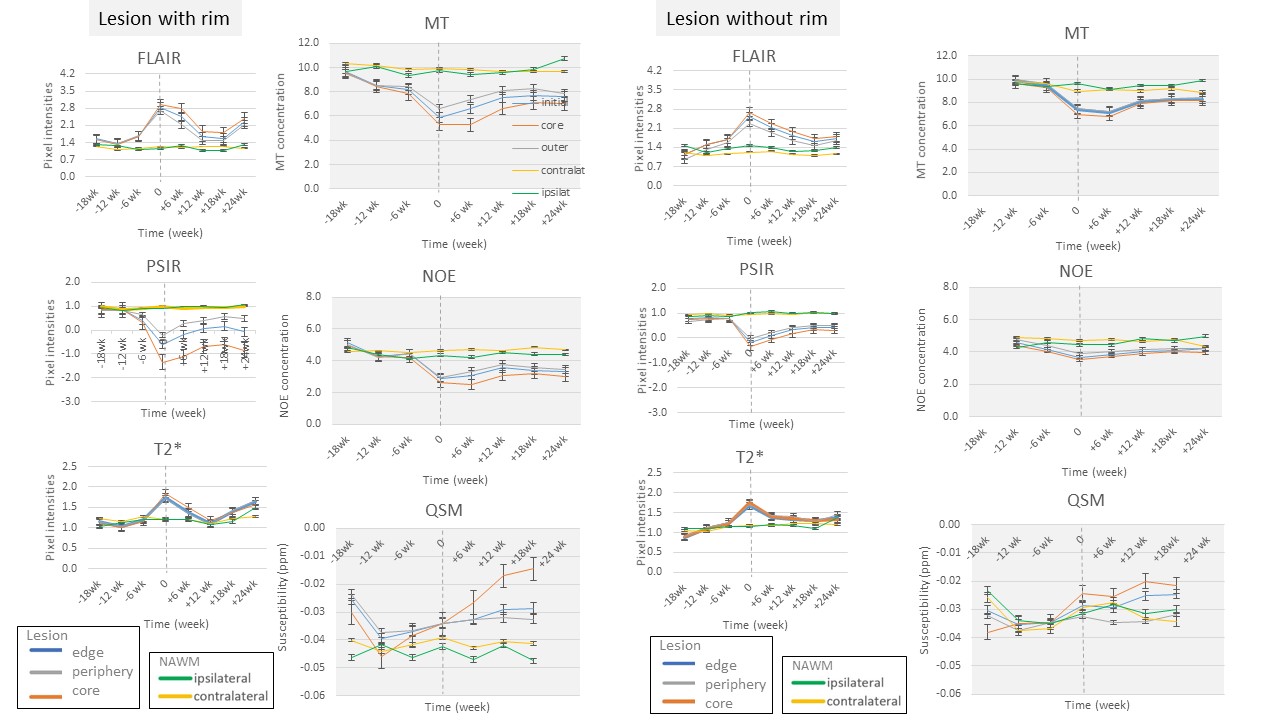
Figure 4 Temporal evolution of different image contrasts during the formation of a new lesion. Image values in the lesion and NAWM ROIs are presented: core (orange), edge (blue), periphery (grey), contralateral (yellow) and ipsilateral NAWM (green). The first appearance of the lesion as identified on FLAIR images by a neurologist (time=0) is represented as dashed line.