0084
Thalamic lesions, thalamic volume and cognitive deficit in secondary progressive MS1Queen Square MS Centre, UCL Institute of Neurology, Faculty of Brain Sciences, University College London, London, United Kingdom, 2Translational Imaging Group (TIG), Centre for Medical Image Computing (CMIC), University College London, London, United Kingdom, 3Leeds Institute of Health Sciences, University of Leeds, Leeds, United Kingdom, 4Blizard Institute, Barts and The London School of Medicine and Dentistry, Queen Mary University London, London, United Kingdom, 5Edinburgh Clinical Trials Unit, Usher Institute of Population Health Sciences and Informatics, University of Edinburgh, Edinburgh, United Kingdom, 6Statistics and Epidemiology, Division of Health Sciences, Warwick Medical School, University of Warwick, Warwick, United Kingdom, 7Keele University Medical School, Royal Stoke University Hospital, Stoke-on-Trent, United Kingdom, 8Department of Neurology, Royal Hallamshire Hospital, Sheffield, United Kingdom, 9Centre for Clinical Brain Sciences, University of Edinburgh, Edinburgh, United Kingdom, 10Department of Brain and Behavioural Sciences, University of Pavia, Pavia, Italy, 11Brain MRI 3T Research Centre, C. Mondino National Neurological Institute, Pavia, Italy, 12National Institute for Health Research (NIHR), University College London Hospitals (UCLH) Biomedical Research Centre (BRC), London, United Kingdom, 13Department of Radiology and Nuclear Medicine, VU University Medical Center, Amsterdam, Netherlands
Synopsis
We investigated the cross-sectional relationships between thalamic lesions (i.e. total thalamic lesion volume), thalamic volume, and cognitive deficit in 55 subjects with secondary progressive multiple sclerosis. We measured: total intracranial volume, T2 lesion volume (T2LV), thalamic volume, thalamic lesions, and symbol digit modalities test (SDMT). Thalamic lesions inversely correlated with thalamic volume and these two variables were independently associated with cognitive deficit as measured by SDMT. After adjusting for T2LV, thalamic volume was the strongest predictor of cognitive deficit. Thalamic lesions may have clinical relevance independent of thalamic volume and will be longitudinally investigated in a bigger sample size.
INTRODUCTION
The thalamus plays a central role in integrating and modulating cognitive, motor and sensory functions in the central nervous system.1–3 Thalamic atrophy occurs early in multiple sclerosis (MS)4,5 and is more severe in the progressive stages.6 Similarly, thalamic lesions can be detected at any stage of MS, but are more prominent in secondary progressive MS (SPMS).7
The relationships between thalamic lesions, thalamic volume, and clinical deficits have been poorly investigated in SPMS. We aimed to: 1) determine whether thalamic lesions (analysed as thalamic lesion volume) are associated with thalamic volume and cognitive deficit in SPMS; and, if so, 2) to determine the extent to which thalamic lesions can predict cognitive deficits independently of T2 lesion and thalamic volumes.
METHODS
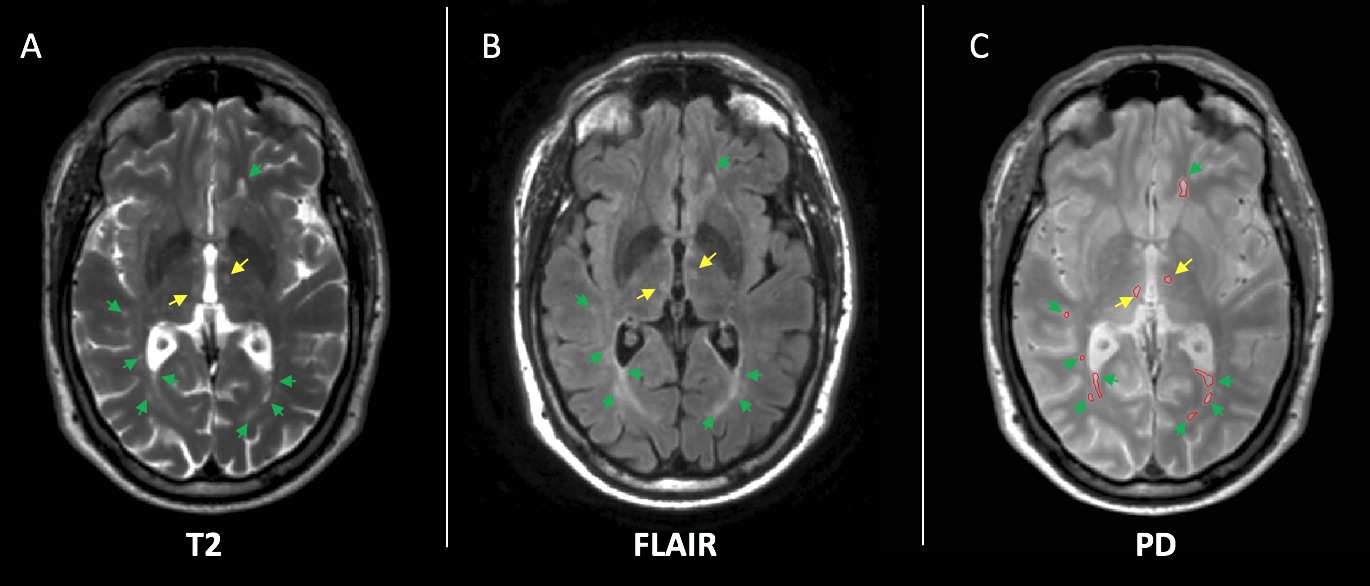
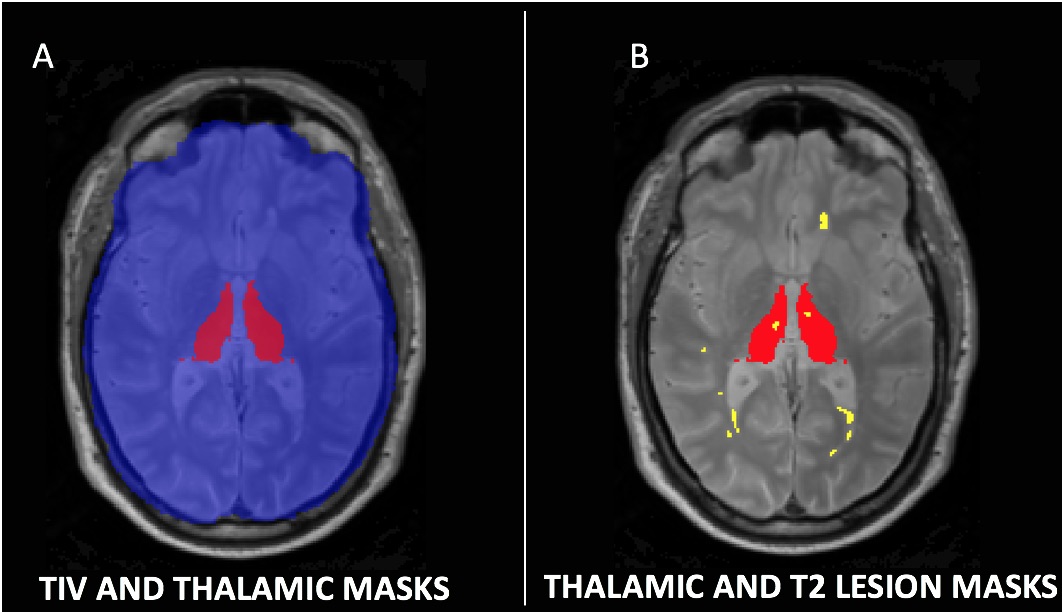
This was a baseline cross-sectional study from a single site of a multicentre trial of neuroprotection in SPMS. Eligible patients were aged 18-65, had expanded disability status scale (EDSS) 4-6.5, and were not on disease-modifying drugs. All patients gave written consent. We acquired 3D T1-weighted, fluid-attenuated inversion recovery (FLAIR), and PD/T2-weighted axial scans at 3T (Philips Achieva, Philips Healthcare, The Netherlands). Additionally, we collected symbol digit modalities test (SDMT). Lesions were contoured on the PD scans based on hyperintensity in the PD/T2 and FLAIR scans using a semi-automatic method (Jim 7 Software, Xinapse Systems, UK). MRI readers were blind to patients’ data. After lesion filling the T1-weighed image using the T2 lesion masks, thalamic and brain volumes were segmented automatically using the geodesic information flows (GIF) algorithm (TIG, UCL http://cmictig.cs.ucl.ac.uk/niftyweb), which is part of the NiftySeg software.8,9 The intersection of the whole brain lesion mask and a mask of the segmented thalamus was used to produce a mask of the thalamic lesions (Fig.1-2). We measured: total intracranial volume (TIV), thalamic volume, thalamic lesions (i.e. the total volume of T2 lesions detected in the two thalami), and T2 lesion volume (T2LV). We calculated Kendall’s tau correlations and subsequent multivariable linear regression in which SDMT was the outcome; age, gender, disease duration, TIV, T2LV were nuisance variables; thalamic lesions and thalamic volume were the variables of interest.RESULTS
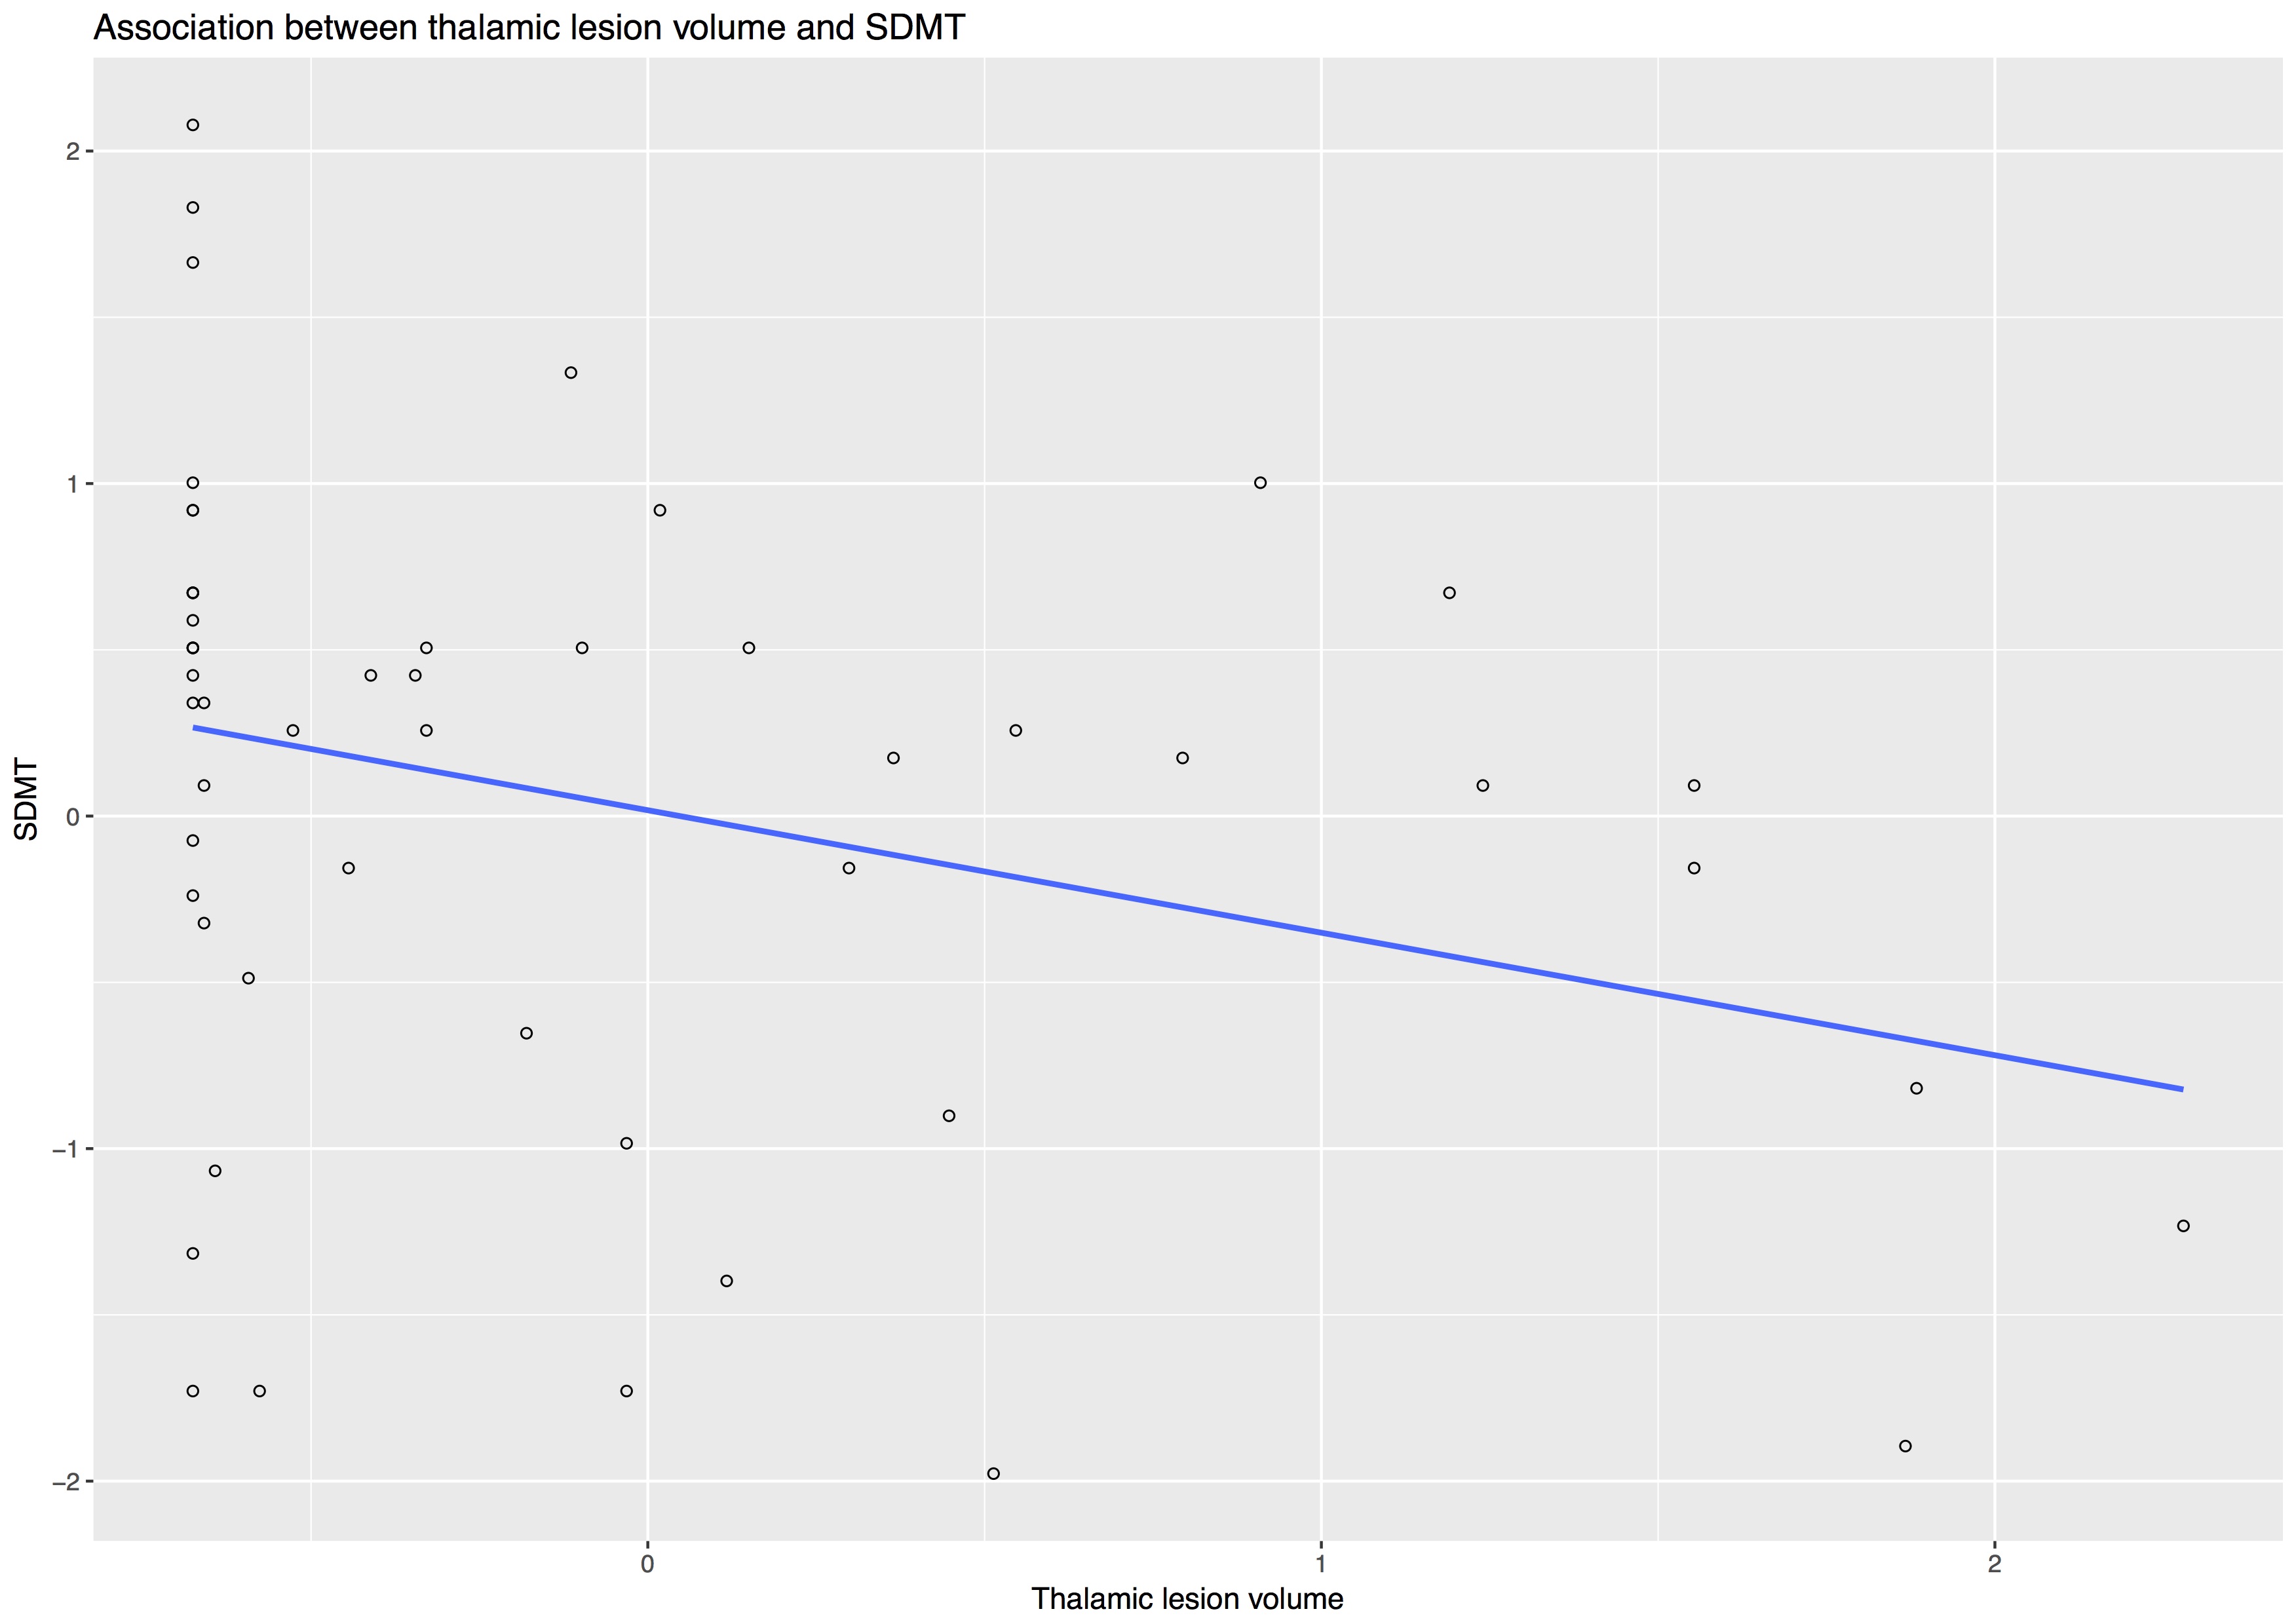
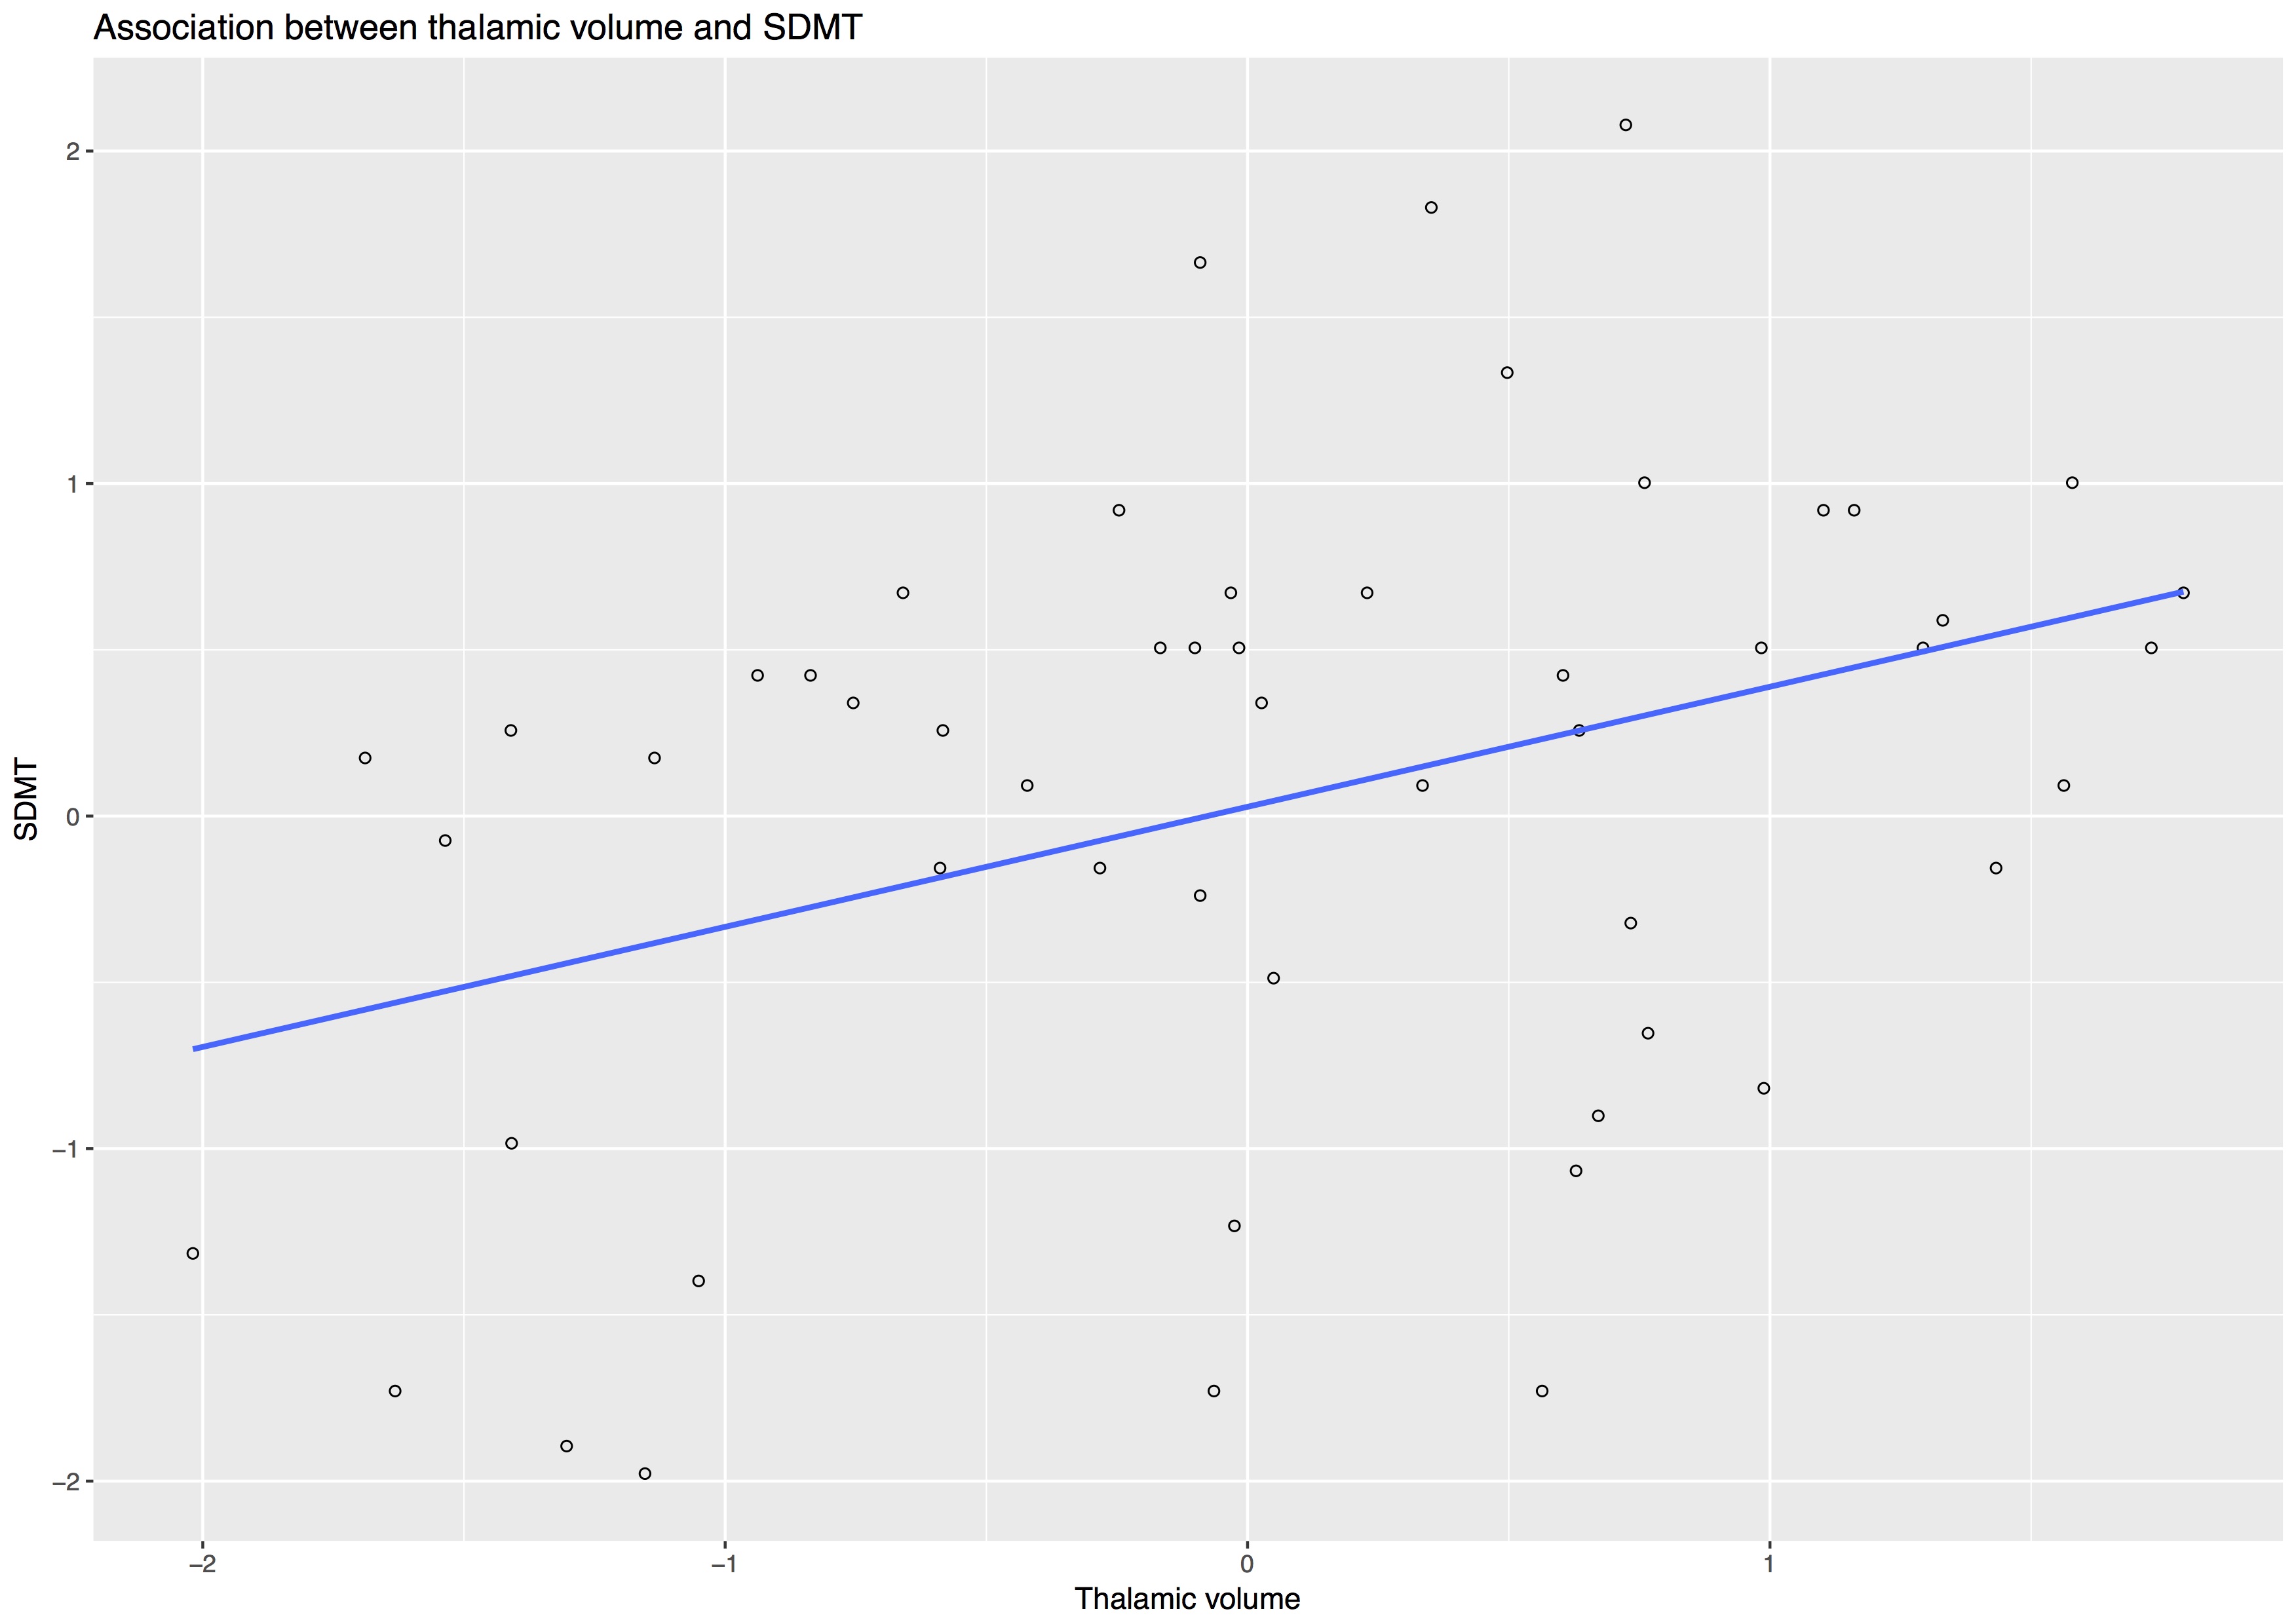
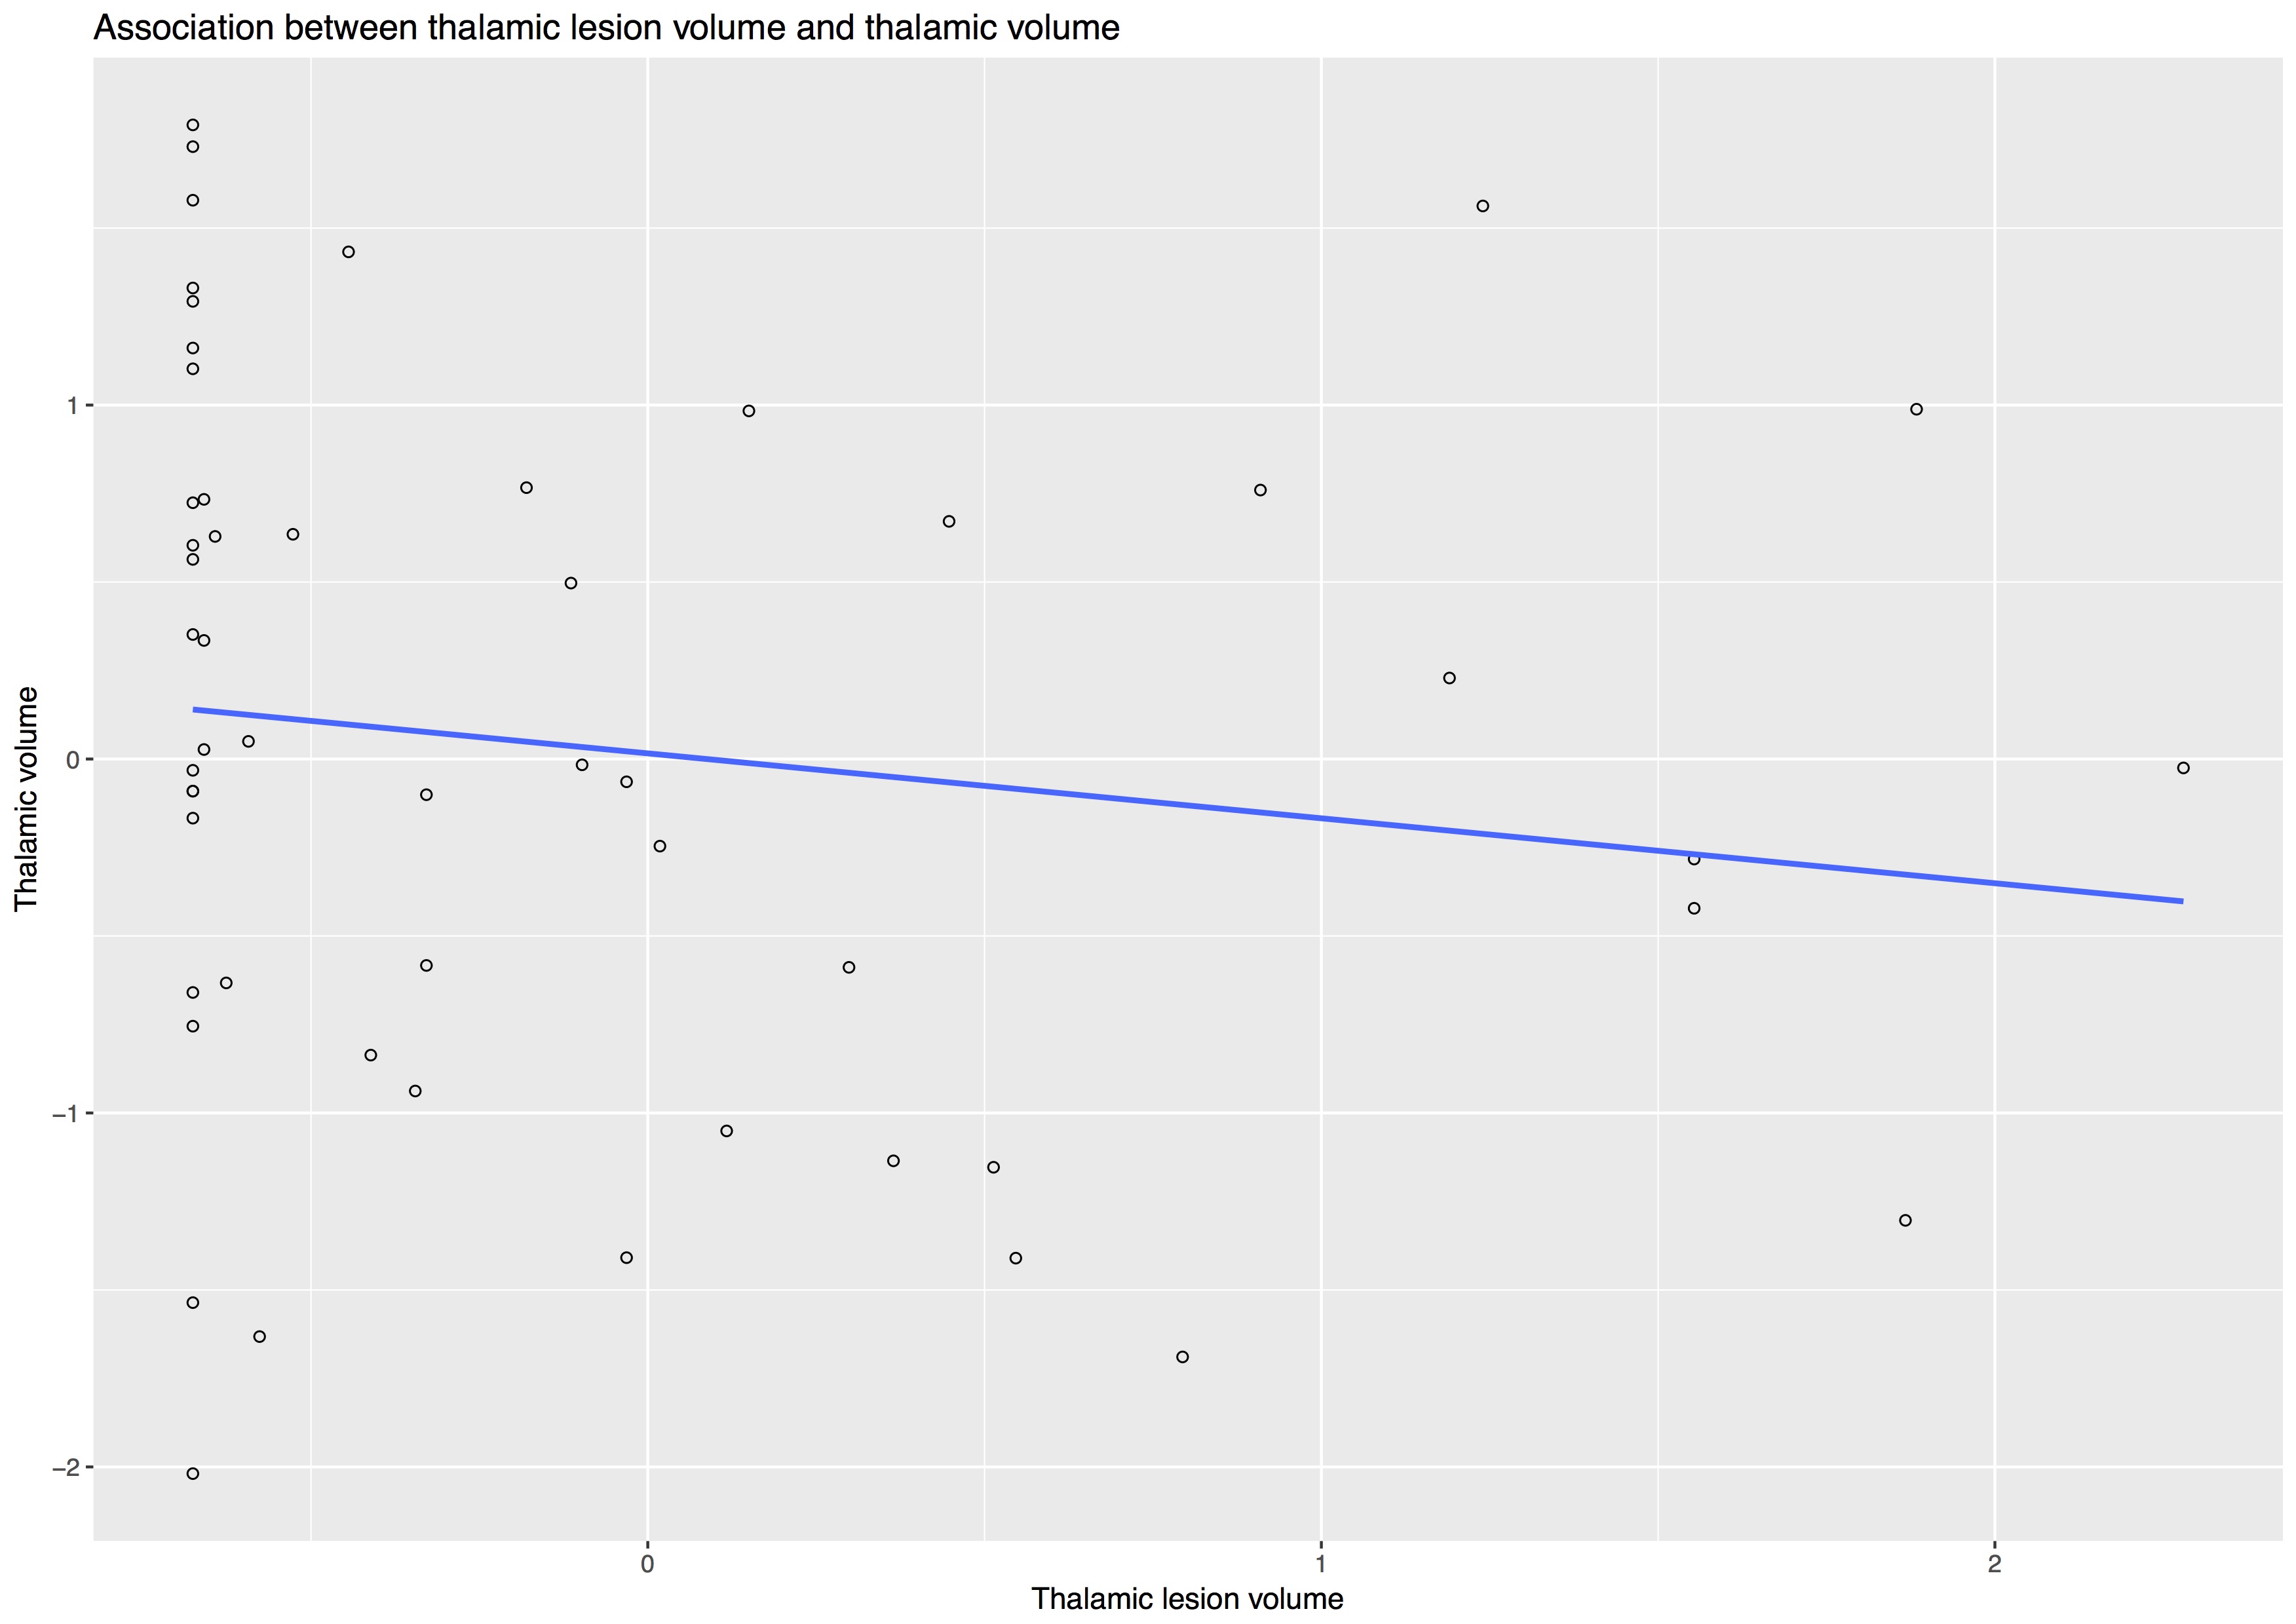
At the time of this study, clinical and MRI data were available for 55 of the 176 patients that we recruited from December 2014 and June 2016. Thirty-three (60%) were females, mean age was 54.7 years (SD=6.9), mean disease duration was 22.1 years (SD=9.2), and mean SDMT was 44.9 total correct (SD=12, median= 48, min 17 - max 70). MRI variables were measured in mL and presented as mean (SD): T2LV 14.17 (9.8), thalamic lesions 0.041 (0.061), thalamic volume 10.51 (1.48), TIV 1539.92 (126.85). Median T2LV was 13.05 (range 0.72-38.53) and median thalamic lesions was 0.014 (range 0-0.30). Kendall’s tau correlation analysis showed a significant but weak associations between thalamic lesions and thalamic volume (tau: -0.213, p: 0.027), and between thalamic lesions and SDMT (tau: -0.323, p= 0.001) (Fig.3-5). There was no significant association between thalamic lesions and T2LV. Thalamic lesions (standardised beta = -0.29, standard error [SE] = 0.13, p = 0.03) and thalamic volume (standardised b = 0.63 SE = 0.17; p < 0.001) were independently associated with SDMT after adjusting for age, gender, disease duration, and TIV (adjusted R-squared= 0.31). After including whole brain T2LV as covariate in this model, the significant association between thalamic lesions and SDMT was lost, but the association between thalamic volume and SDMT scores remained significant.DISCUSSION AND CONCLUSION
Our study showed that thalamic lesions inversely correlated with thalamic volume, both of which were independently associated with cognitive deficit as measured by SDMT. This test is particularly sensitive to slowed processing of information that is one of the most common cognitive deficits seen in MS.10
After adjusting for T2LV, thalamic volume appeared to be the strongest predictor of cognitive deficit, confirming the important role of thalamus in cognition. Our main limitations were the limited sample size and the cross-sectional nature of our study.
In conclusion, thalamic lesions seem to have little clinical relevance beyond thalamic atrophy and partly reflect overall T2LV. Both thalamic lesions and thalamic volume measurements can be easily detected on standard clinical MRI scans and might be used in a clinical setting to monitor cognitive function and response to neuroprotective drugs in SPMS. Future analyses from our ongoing longitudinal study will help to clarify the role of thalamic lesions in a bigger sample size of people with SPMS and the need of developing an optimised MRI acquisition protocol.
Acknowledgements
This study was a report of a no pre-planned baseline cross-sectional analysis from a single site - the UCL site - of a large UK multicentre clinical trial of neuroprotection in SPMS (MS-SMART trial, NCT01910259).
The MS-SMART trial is an independent research project funded by Efficacy and Mechanism Evaluation (EME) Programme, an MRC and NIHR partnership. It is also supported by the UK Multiple Sclerosis Society, the National Institute for Health Research University College London Hospitals Biomedical Research Centre and University College London.
The authors thank Marie Braisher, Tiggy Beyene, Vanessa Bassan, and Alvin Zapata for their help at the UCL site.
References
1. Preziosa, P. et al. Structural MRI correlates of cognitive impairment in patients with multiple sclerosis. Hum. Brain Mapp. 37, 1627–1644 (2016).
2. Nourbakhsh, B. et al. Subcortical grey matter volumes predict subsequent walking function in early multiple sclerosis. J. Neurol. Sci. 366, 229–233 (2016).
3. Rocca, M. A. et al. Thalamic Damage and Long-term Progression of Disability in Multiple Sclerosis. Radiology 257, 463–469 (2010).
4. Štecková, T. et al. Thalamic atrophy and cognitive impairment in clinically isolated syndrome and multiple sclerosis. J. Neurol. Sci. 342, 62–8 (2014).
5. Till, C. et al. White matter integrity and math performance in pediatric multiple sclerosis. Neuroreport 22, 1005–1009 (2011).
6. Eshaghi, A. et al. Deep grey matter volume loss drives disability worsening in multiple sclerosis. (2017). doi:10.1101/182006
7. Harrison, D. M. et al. Thalamic lesions in multiple sclerosis by 7T MRI: Clinical implications and relationship to cortical pathology. Mult. Scler. 21, 1139–50 (2015).
8. Cardoso, M. J. et al. Geodesic Information Flows: Spatially-Variant Graphs and Their Application to Segmentation and Fusion. IEEE Trans. Med. Imaging 34, 1976–1988 (2015).
9. Prados F, Cardoso MJ, Burgos N, Gandini Wheeler-Kingshott CAM, O. S. NiftyWeb: web based platform for image processing on the cloud. in International Society for Magnetic Resonance in Medicine (ISMRM) 24th Scientific Meeting and Exhibition, Singapore (2016).
10. Benedict, R. H. et al. Validity of the Symbol Digit Modalities Test as a cognition performance outcome measure for multiple sclerosis. Mult. Scler. J. 23, 721–733 (2017).
Figures