0083
Spatiotemporal development of spinal cord lesions in a primate model of multiple sclerosis1NINDS, National Institutes of Health, bethesda, MD, United States, 2CENIR, Institut du Cerveau et de la Moelle epinière, Paris, France, 3National Institute of Neurological Disorders and Stroke, National Institutes of Health, Bethesda, MD, United States, 4National Institute of Neurological Disorders and Stroke, National Institutes of health, Bethesda, MD, United States
Synopsis
The spatiotemporal development of spinal cord (SC) lesions in multiple sclerosis (MS) is poorly understood, despite the high prevalence of these lesions and their important contribution to patient disability. In this study, we report for the first time the serial imaging of SC lesions in a nonhuman primate model of MS. The results demonstrated substantial clinical and imaging features shared between this animal model and human MS. In particular, we observed focal and subpial demyelinating lesions that appeared at disease onset and proceeded to affect much of the entire cord over the course of several weeks to months.
Background
The detection of spinal cord (SC) abnormalities is important for the diagnosis of multiple sclerosis (MS); 75-90% of patients present SC lesions1, which are known to have a major impact in the development and the progression of the motor deficits. We previously reported that the SC of marmosets with experimental autoimmune encephalomyelitis (EAE) frequently shows demyelinated lesions distributed along the entire SC length2. However, the spatiotemporal development of these SC lesions is unknown. The purpose of this in vivo study was to characterize the dynamic evolution of SC lesions in space and time by imaging serially the entire SC of marmosets with EAE.Methods
SC imaging of two common marmosets (M01 and M02) was performed in vivo by MRI (7T/30 cm, Bruker, Germany) using a custom-built 12-channel receive-only phased-array RF coil integrated on a home-made 3D printed cradle3. A proton-density-weighted fast-spin-echo (FSE) sequence (2D RARE, TR/TE/RARE factor/NA: 3500ms/15ms/2/4) was used to acquire axial images (0.15 x 0.15 x 0.8 mm3) at the cervical, thoracic, and lumbar with respiration gating. Animals were then immunized with 200-mg fresh-frozen human white matter (WM) homogenate and followed weekly by MRI, using the same protocol, until they met the endpoint of the study. At the time of necropsy, spinal cords were extracted after perfusion-fixation. Postmortem MRI was acquired using a previously optimized protocol2. Several lesions were selected for analysis based on their age and location in the spinal cord. Focal hyperintense lesions were counted at each time point for each SC segment. The extent of subpial lesions at each time point was assessed by counting the number of slices with subpial lesions for each SC segment. Finally, histopathology was performed using Luxol fast blue combined with the Periodic Acid-Schiff procedure (LFB-PAS) to assess demyelination in representative lesions.Results
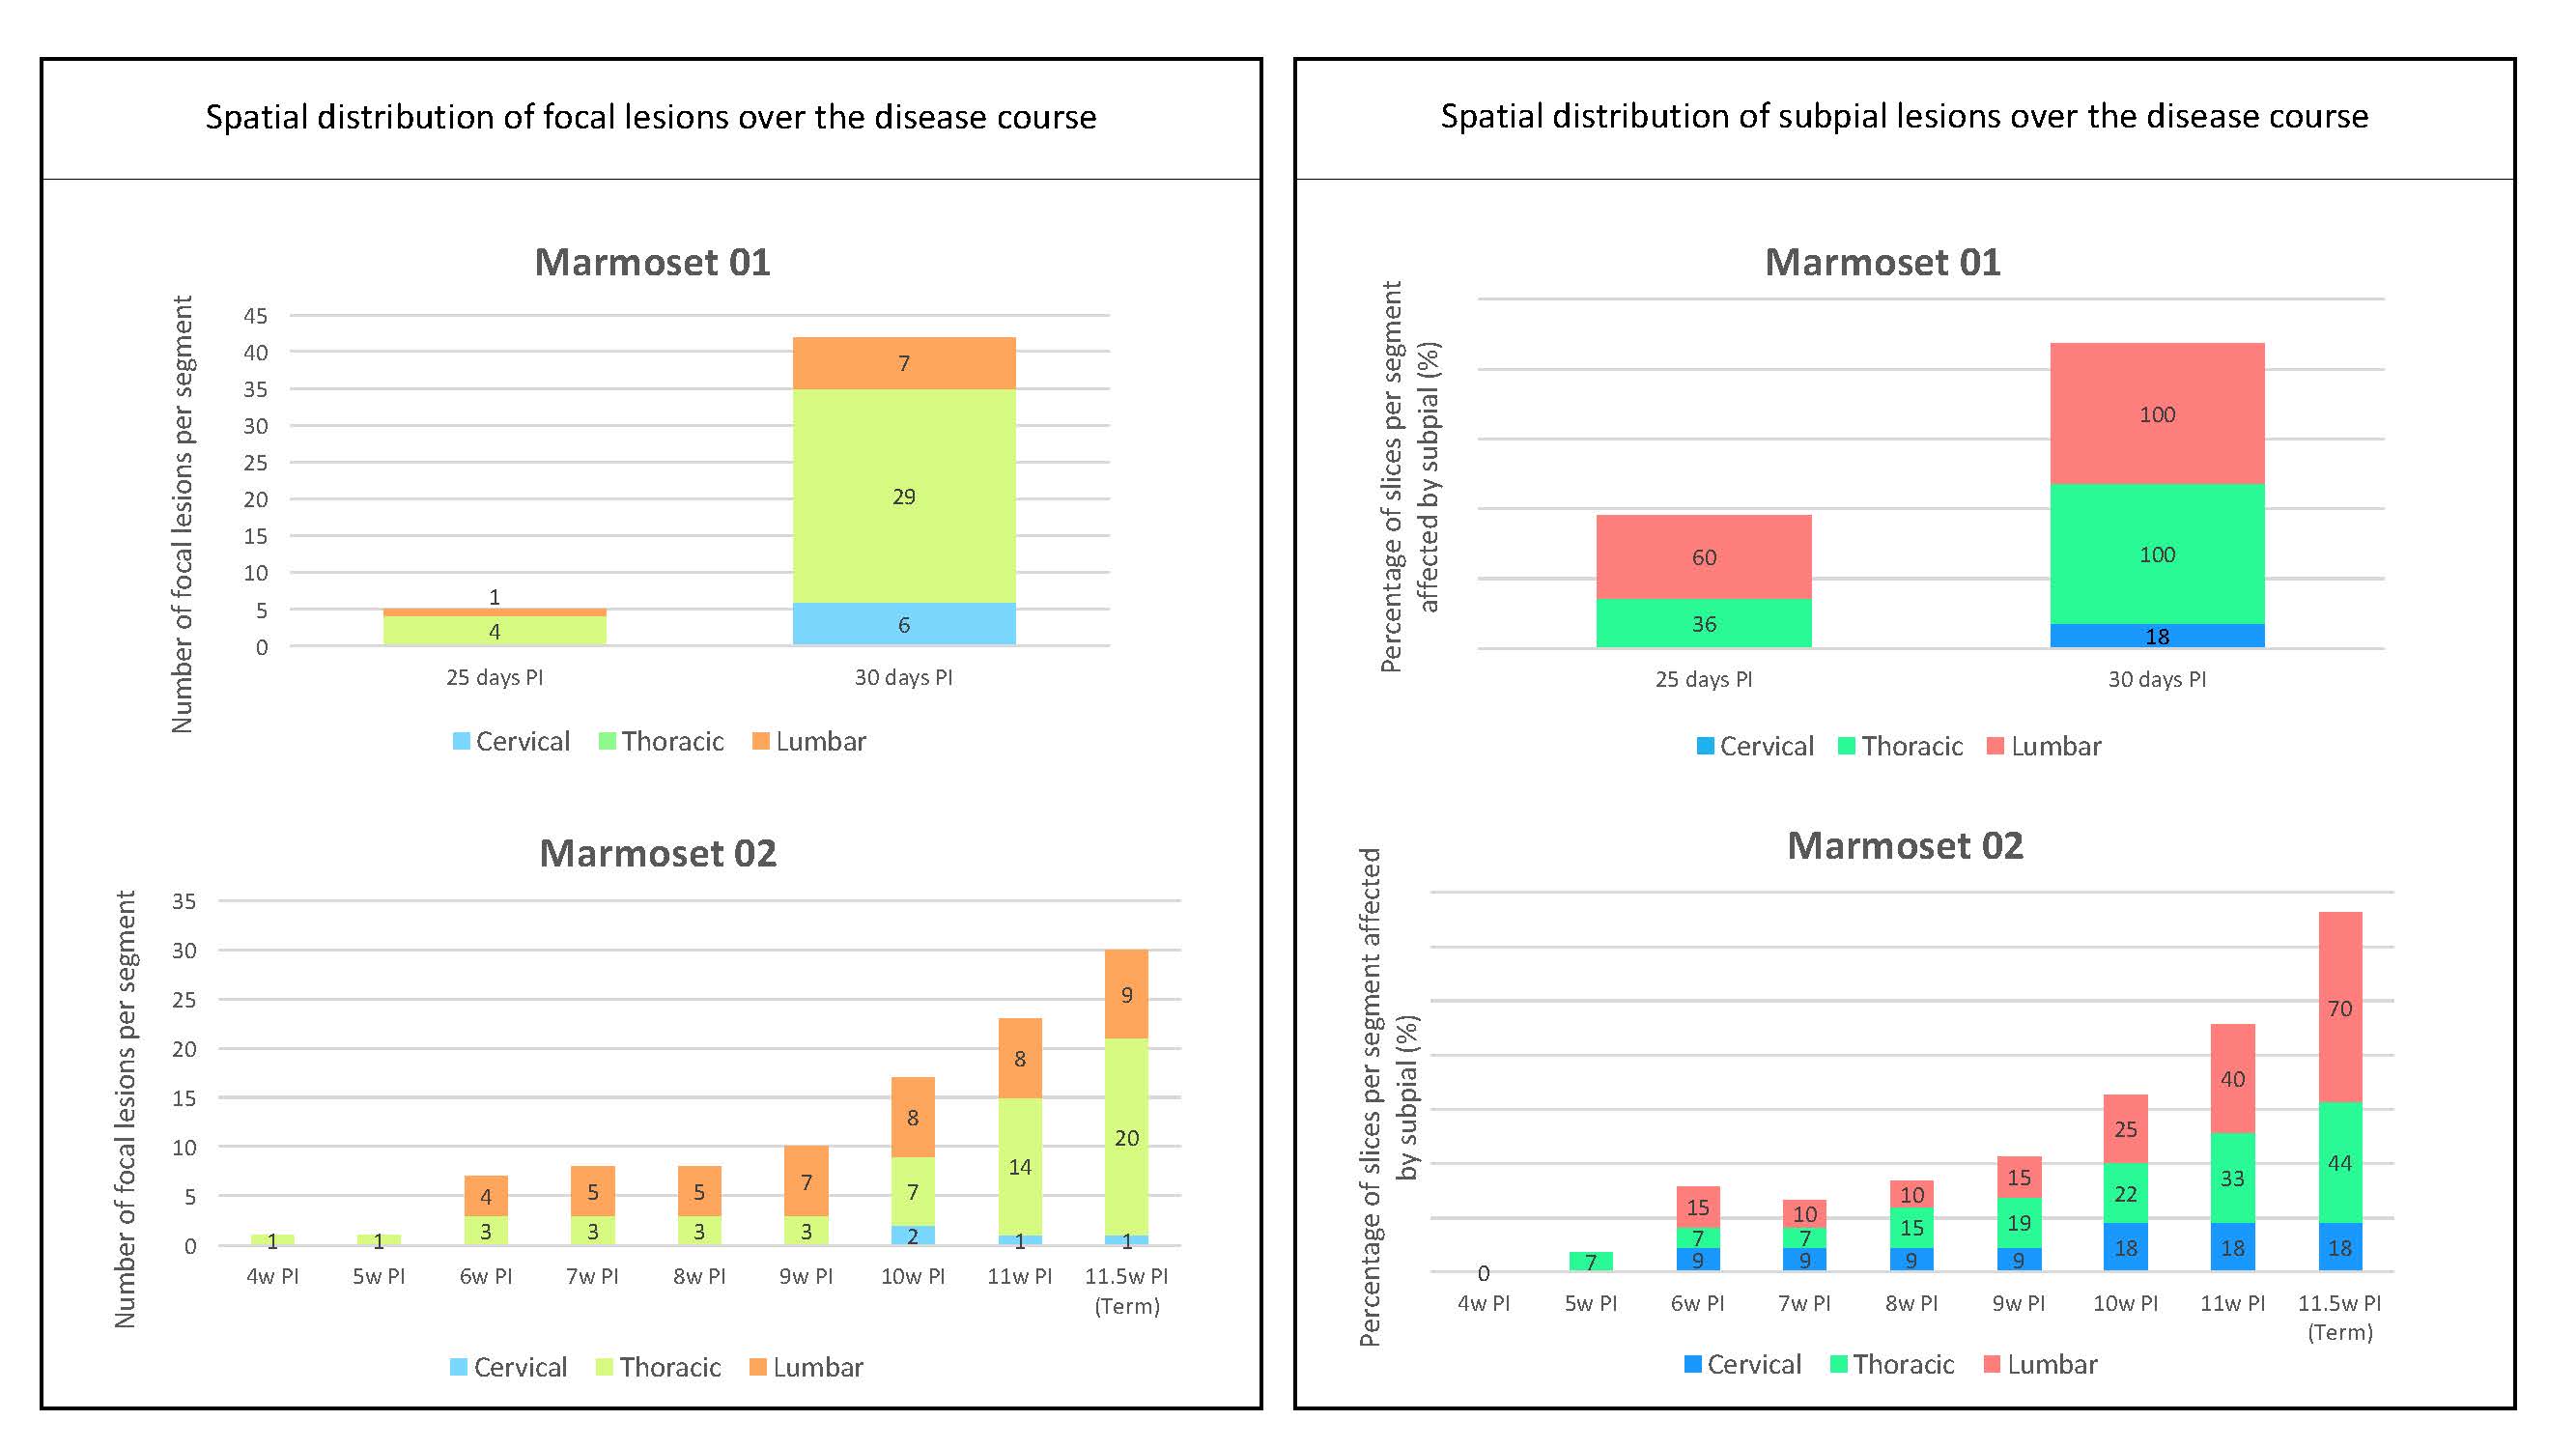
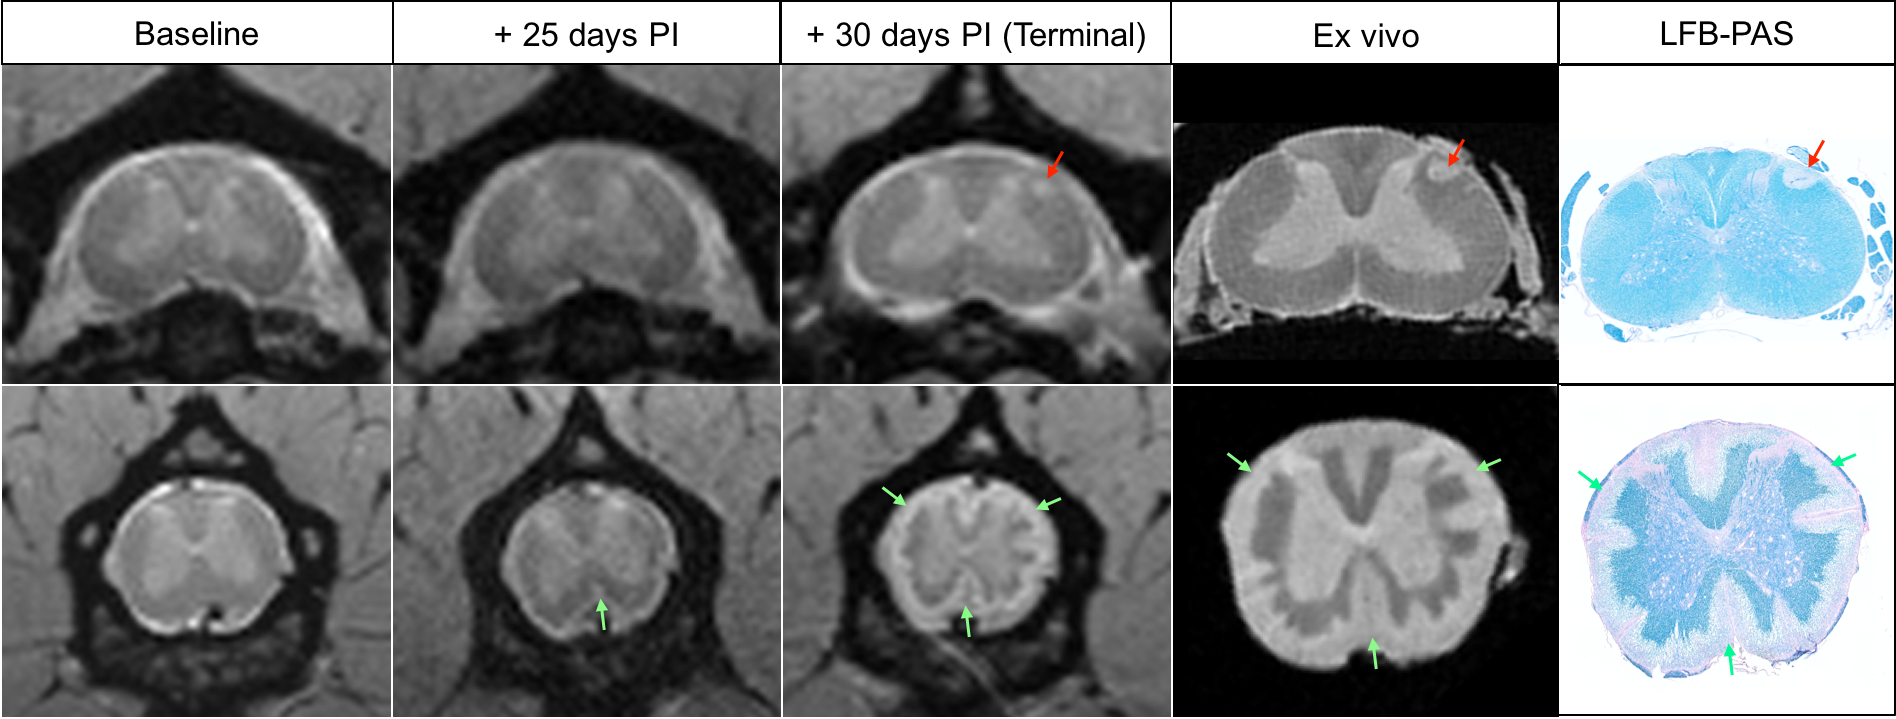
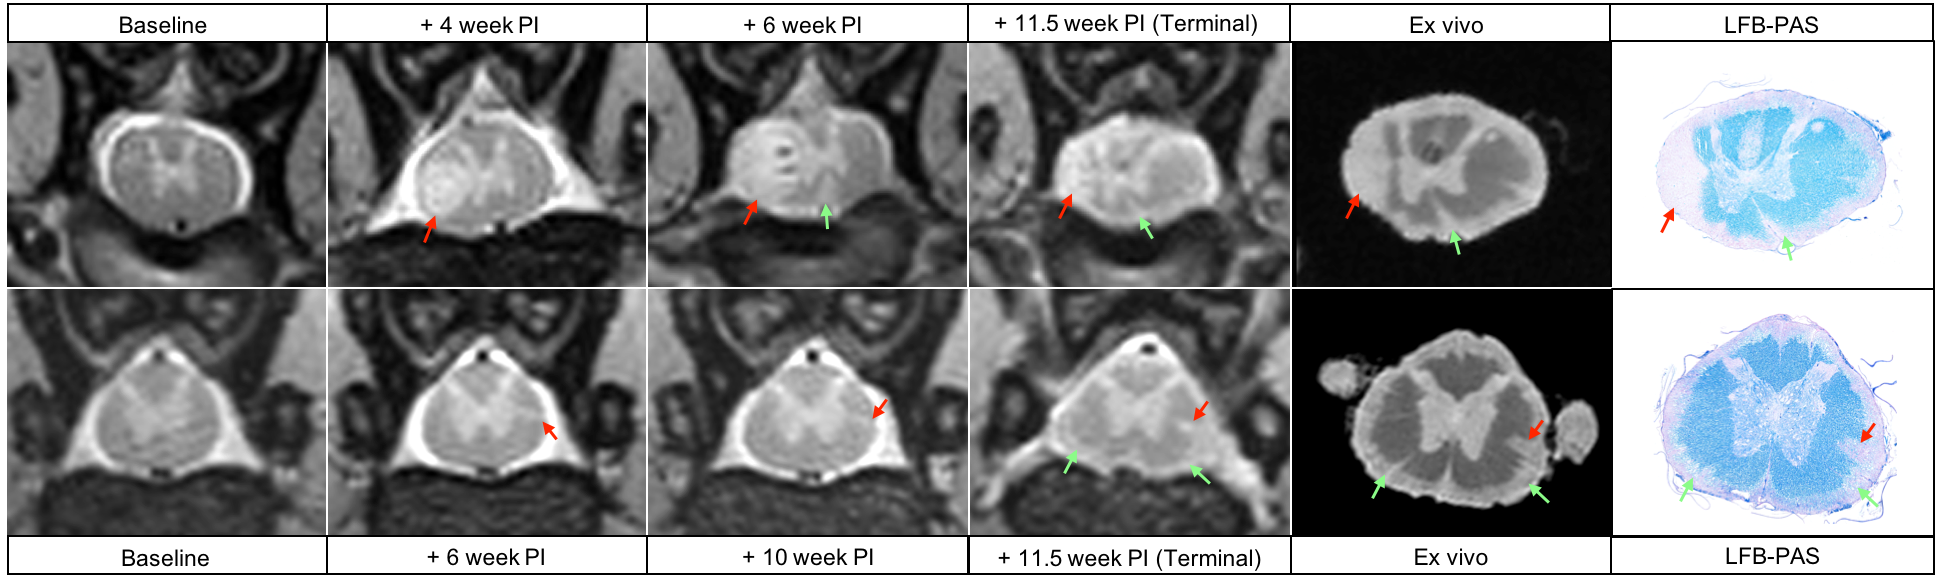
Both marmosets developed their first clinical signs between the 3rd and 4th week post-immunization (PI). Disease duration ranged from 30 days PI (M01) to 81 days PI (M02). Because M01 had a more aggressive disease course, only 3 imaging time points were collected in vivo, whereas 11 imaging time points were collected for M02. The most common clinical signs observed in both animals were characteristic of SC injury (paraplegia, tail atonia, and urinary incontinence). As illustrated in Figure 1 (left panel), SC lesions appeared as early as 4 weeks PI, and their number increased progressively over time, ultimately affecting all SC segments with a predominance at the thoracic level in both animals. Subpial SC lesions followed a similar time course (Figure 1, right panel) and affected the entire cord with a predominance at the lumbar level in both animals. Representative images from M01 show the development of a small focal lesion at the cervical level (Figure 2, top row, red arrows) and an extensive subpial lesion distributed all around the cord at the lumbar level (Figure 2, bottom row, green arrows). As demonstrated by the LFB-PAS stains, hyperintense lesions identified on both in vivo and ex vivo MRI corresponded to areas of demyelination. In M02, a large focal demyelinating lesion in the thoracic cord (Figure 3, top row, red arrows) appeared early in the disease process. The extent of the subpial demyelinating lesion at the lumbar level in M02 (bottom row, green arrows) was more difficult to assess than in M01 due to the surrounding hyperintense signal of cerebrospinal fluid.Discussion/Conclusion
This serial SC MRI study in a nonhuman primate model of MS shows that despite different disease time-courses, there are substantial common clinical and imaging features related to SC lesions between marmoset EAE and MS. We specifically observed focal and subpial white matter lesions that appeared at the time of disease onset, progressively affected the entire SC, and corresponded to demyelination verified histologically. The subpial pathology detected here may prove to be an outstanding model for understanding the development widespread and clinically important subpial pathology observed in the cortex of progressive MS patients. Future work will focus on improving our MRI protocol (e.g. using a CSF-suppressed contrast) to better detect subtle subpial pathology as well as acquisition of data from additional animals to better characterize the spectrum of disease.Acknowledgements
No acknowledgement found.References
1. Bot JC, Barkhof F, Polman CH, et al. Spinal cord abnormalities in recently diagnosed MS patients: added value of spinal MRI examination. Neurology 2004; 62: 226–33.
2. Lefeuvre J, Guy JR, Luciano N, Ultra-high-resolution postmortem imaging of marmoset EAE spinal cords. Proceedings of the 24th Annual Meeting of ISMRM, Singapore, 2016. Program number 4404.
3. Lefeuvre J, Chiang WY, Luciano N, et al. In vivo Magnetic Resonance Imaging of the Marmoset Spinal Cord at 7T. Proceedings of the 25th Annual Meeting of ISMRM, Hawaii, 2017. Program number 2173.
Figures