0082
Spatial Distribution of Multiple Sclerosis lesions in the Cervical Cord1NeuroPoly Lab, Polytechnique Montreal, Montreal, QC, Canada, 2Faculty of Medicine, University of Montreal, Montreal, QC, Canada, 3Department of Radiology and Biomedical Imaging, Zuckerberg San Francisco General Hospital, University of California, San Francisco, CA, United States, 4Montreal Neurological Institute, Montreal, QC, Canada, 5Department of Radiology, Xuanwu Hospital, Capital Medical University, Beijing, China, 6Department of Radiology, Beijing Tiantan Hospital, Capital Medical University, Beijing, China, 7Department of Radiology, University Hospital of Rennes, Rennes, France, 8University of Rennes, INRIA, CNRS, INSERM, Rennes, France, 9University Rennes, INRIA, CNRS, INSERM, Rennes, France, 10Department of Neurology, University Hospital of Rennes, Rennes, France, 11University Hospital of Montpellier, Montpellier, France, 12CRMBM, CNRS, Aix-Marseille University, Marseille, France, 13CEMEREM, Hôpital de la Timone, AP-HM, Marseille, France, 14Department of Neurology, CHU Timone, APHM, Marseille, France, 15Neuroimaging Research Unit, INSPE, Division of Neuroscience, San Raffaele Scientific Institute, Vita-Salute San Raffaele University, Milan, Italy, 16Brigham and Women's Hospital, Harvard Medical School, Boston, MA, United States, 17Queen Square MS Centre, UCL Institute of Neurology, Faculty of Brain Sciences, University College London, London, United Kingdom, 18Massachusetts General Hospital, Boston, MA, United States, 19Department of Clinical Neuroscience, Karolinska Institutet, Stockholm, Sweden, 20Functional Neuroimaging Unit, CRIUGM, Université de Montréal, Montreal, QC, Canada
Synopsis
The study of the spatial distribution of multiple sclerosis (MS) lesions in the cervical spinal cord provides a means to further understand the disease pathophysiology. In this study we involve 358 patients across 7 sites, where cervical lesions were manually segmented. Using Spinal Cord Toolbox, lesion segmentations were registered to a common-space template and voxel-based lesion probability maps (LPMs) were computed across the patient population to assess lesion topography. Results revealed a predominance of lesions in the upper cord (C1-C3) and dorsal column, which confirms prior histopathology work and encourages further study of associations between cervical spine lesion volume and distribution with clinical status.
Introduction
Spinal lesions detected on magnetic resonance imaging (MRI) hold particular diagnostic and prognostic value for multiple sclerosis (MS) 1,2. However, despite previous attempts to correlate lesion volume and location in the spinal cord with clinical status, the clinical impact is not fully understood 3. Following previous works 4,5, this multi-center study comprehensively assesses the spatial distribution of MS lesions in the cervical spinal cord and investigates various relations with clinical subtype and disease progression.Demographics and Data Acquisition
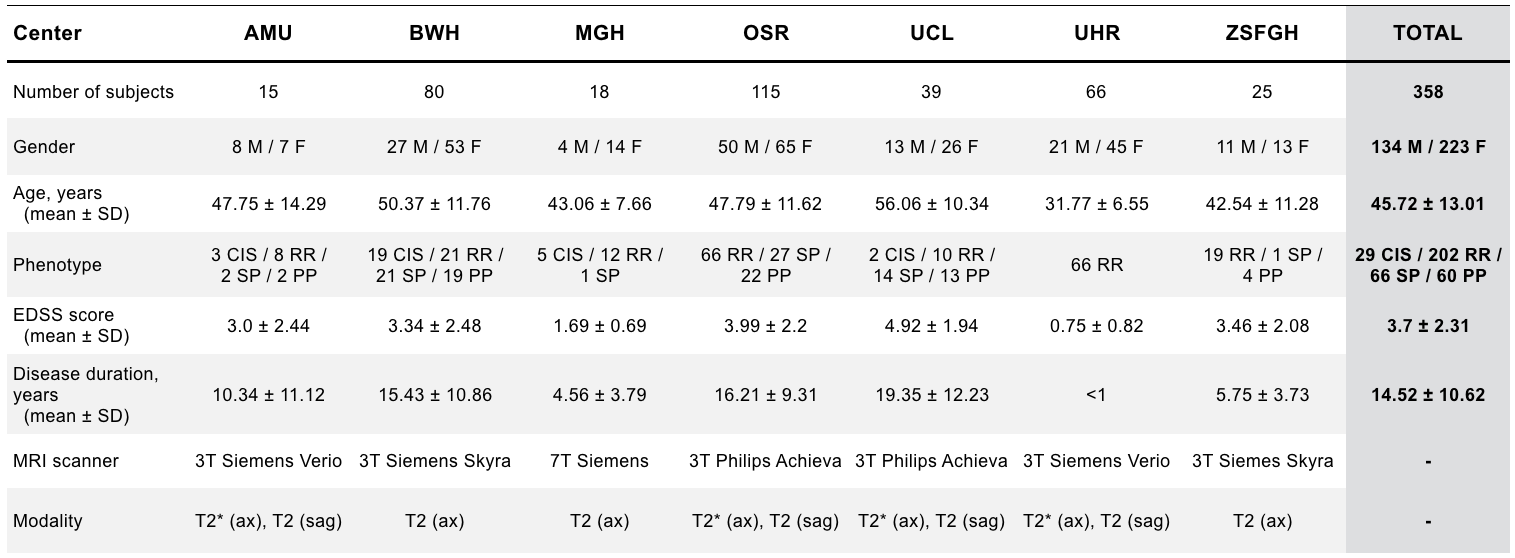
We included 358 MS patients, where T2-weighted and T2*-weighted conventional MRI scans were collected from 7 clinical sites across Europe and North America on 3T and 7T scanners (Philips and Siemens). Figure 1 shows demographic and clinical information obtained for the majority of the patient population. In this study, we define several subgroups based on clinical course: clinically-isolated syndrome (CIS), relapse-remitting (RR), primary-progressive (PP), secondary-progressive (SP), as well as ranges of Expanded Disability Status Scale (EDSS) scores: 0.0-3.0 (mild), 3.5-5.5 (moderate), >6.0 (severe) and Global Multiple Sclerosis Severity Score (MSSS) scores 6, a measure combining disability severity with disease duration to estimate rate of progression for single assessment data.Processing
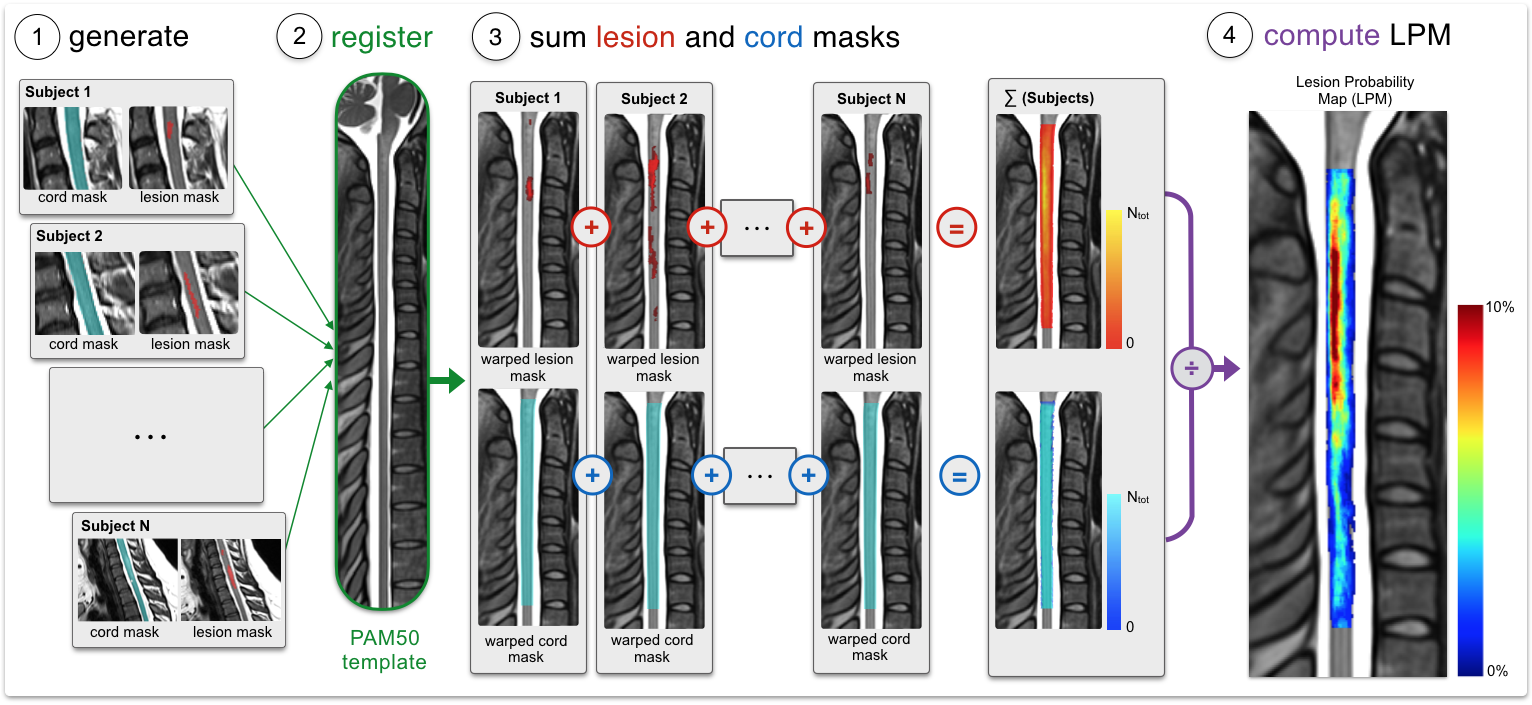
Cervical spine lesions on T2- and T2*-weighted scans were manually delineated by 3 neuroradiologists and 1 experienced rater, who also participated in an inter-rater variability study where agreement was assessed by computing the Dice coefficient between rater segmentations and a majority voting segmentation. Lesion count and lesion volume (LV) were computed to examine associations with clinical outcome and a prediction model was generated to predict disability category (mild, moderate, severe) by combining demographic (age, gender, center), clinical (phenotype, disease duration) and MRI lesion measures (count, LV, grey matter LV, motor tracts LV). Using the Spinal Cord Toolbox (SCT) 7, MRI images, cord masks and lesion masks were registered to the PAM50 template 8 to generate voxel-based lesion probability maps (LPMs), which were computed by dividing the sum of lesion masks by the sum of cord masks across subjects (Figure 2). The predominance of cervical lesions was quantitatively assessed in white (WM) and grey matter (GM), dorsal column (DC), lateral (LF) and ventral funiculi (VF). The fraction of lesion volume was also computed in these regions, defined by the ratio of lesion volume to region volume where a lesion voxel existed. All processing scripts and example data can be downloaded at https://osf.io/cx5ur/.Results
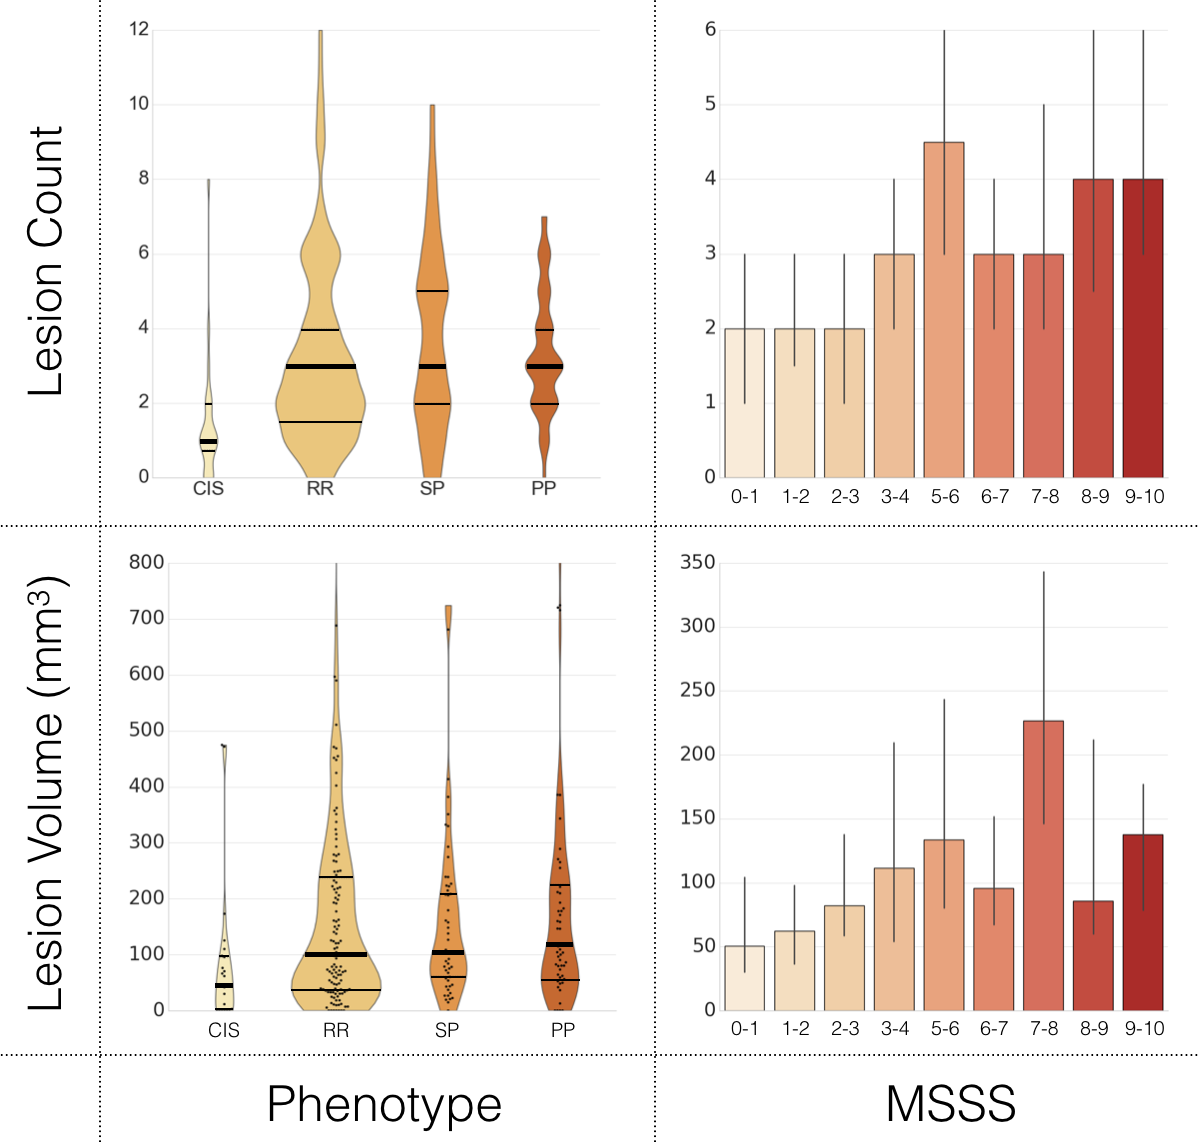
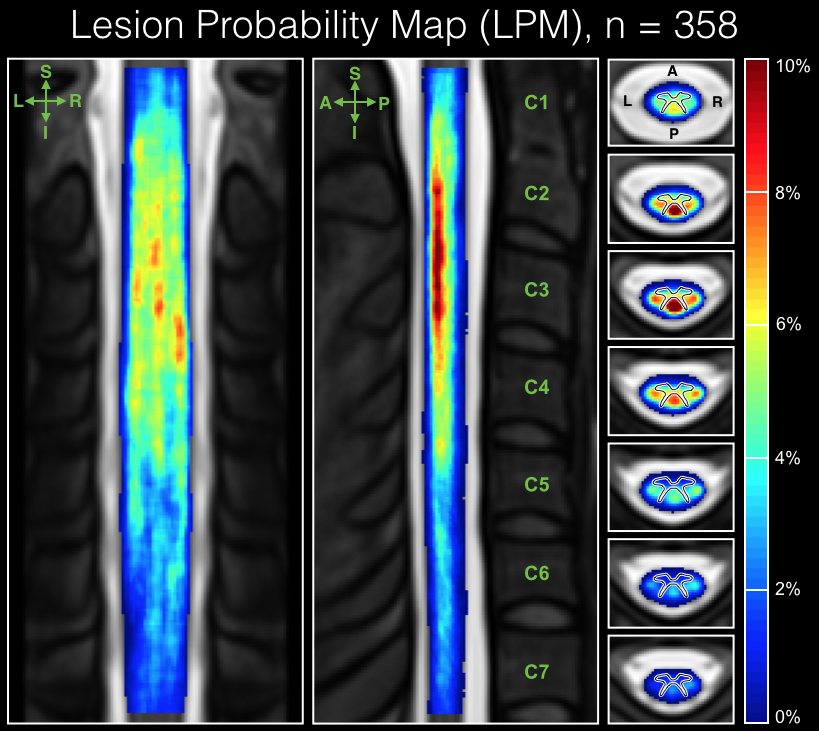
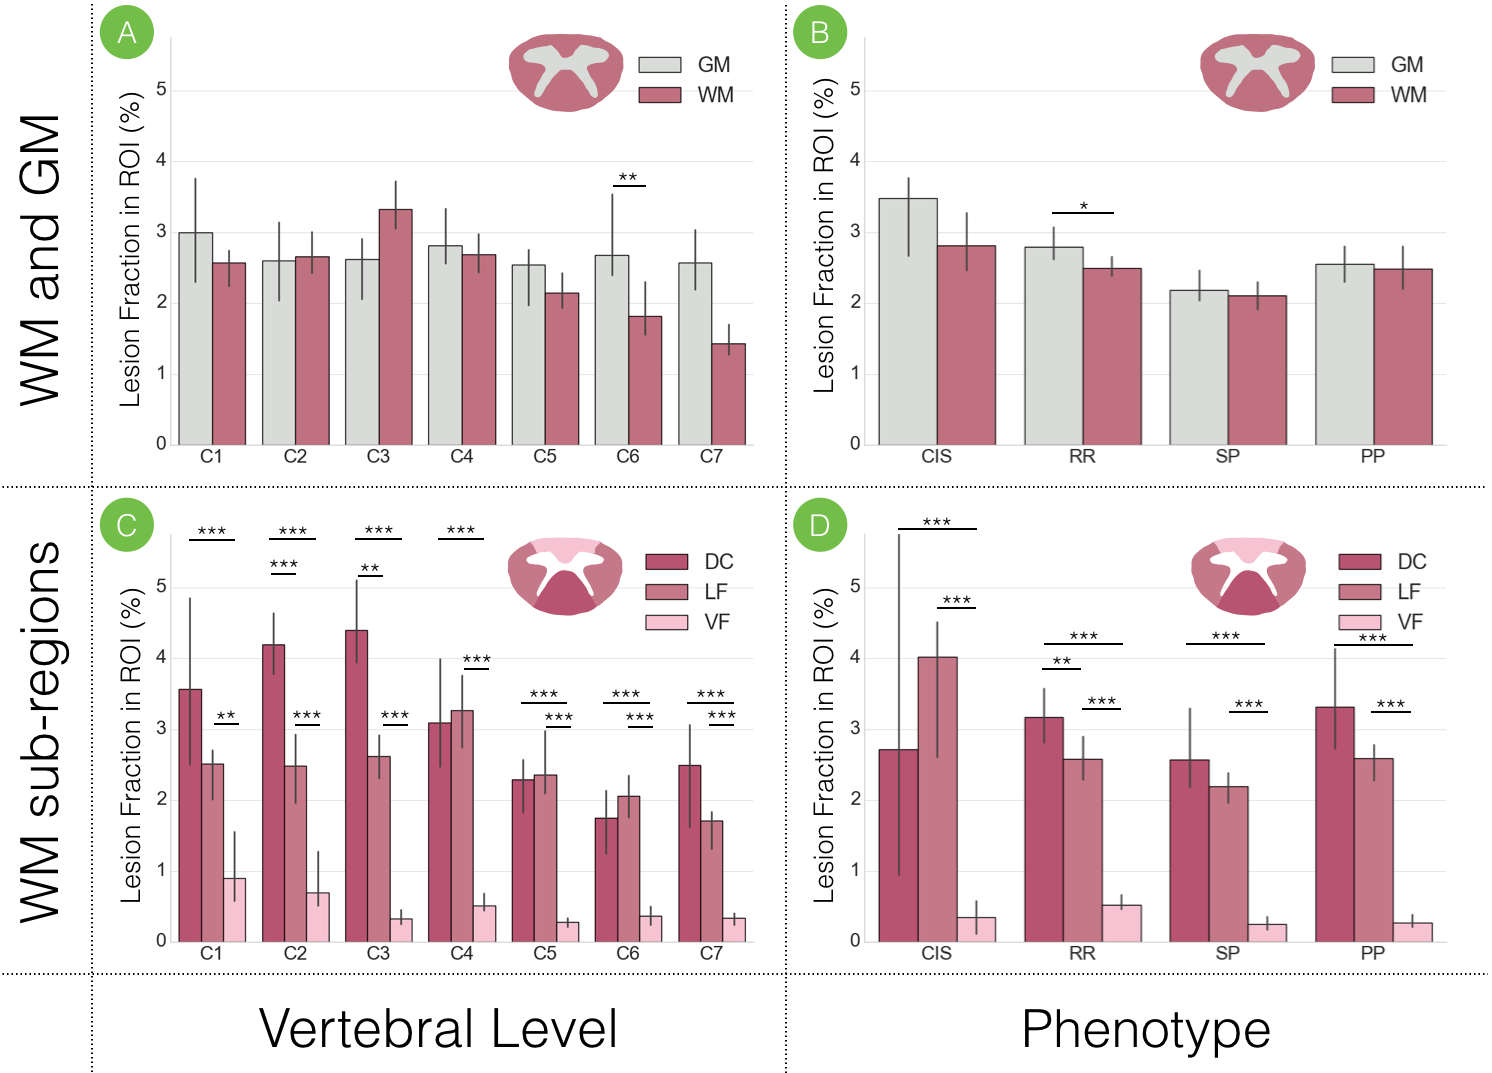
The averaged Dice coefficient yielded across raters was 0.71 +/- 0.11. Figure 3 shows lesion count and LV, for patients categorized by phenotype and MSSS scores. A mean accuracy of 69% was achieved by the prediction model 9, through 10 cross-validation iterations. Figure 4 displays the voxel-based LPM computed across the cohort, where a higher percentage of lesion occurrence was observed in the upper cervical cord (C1-C3: 2.43%, C4-C7: 1.19%). Among white matter tracts, lesions were more frequent in the DC for vertebral levels C1-C5 (DC: 2.45%, LF: 1.77%, VF: 0.41%) when studied across all subjects, and for the whole cervical cord for all phenotypes. The median lesion fraction, shown in Figure 5, was larger in DC than VF for all levels (DC, cord: 3.15%, VF cord: 0.43%; p<0.001, Mann-Whitney U test; Fig 5C) across the cohort, however was only significantly greater than LF in C2 and C3 (p<0.01). Similarly, lesion fraction in DC was greater than in VF for all phenotypes, however only significantly greater than LF in RR patients. Within the DC, substantially greater lesion fractions were present in the upper cervical cord (DC, C1-C3: 4.17%) over lower levels (DC, C4-C7: 2.35%; p<0.001).Discussion and Conclusion
To our knowledge, this study presents the first voxel-based LPMs of cervical cord lesions in MS across several clinical sites. Although differences between MRI lesion measures (count and LV) were modest between phenotypes, a clear tendency of increasing measures with respect to MSSS scores was observed. This preempted association between lesion measures and clinical status lead to the establishment of a disability prediction model, where the performance suggested strong associations between demographics, clinical status and cervical cord lesion measures. Our results establish a notable predominance of cervical cord lesions in upper portions, consistent with prior studies 3, as well as a predilection of lesions in the dorsal column. These results encourage further investigations on the topographical patterns of lesions in the cervical cord and, hence, we intend to further examine predilection of lesions in various regions, and incorporate additional measures such as cord cross-sectional area, on an even larger cohort. In conclusion, the study has demonstrated potential in characterizing the spatial distribution of lesions in the cervical spinal cord to render a better understanding of the heterogeneous nature of MS.Acknowledgements
Grant support:
- the Canada Research Chair in Quantitative Magnetic Resonance Imaging (JCA), the Canadian Institute of Health Research [CIHR FDN-143263], the Canada Foundation for Innovation [32454], the Fonds de Recherche du Québec - Santé [28826], the Fonds de Recherche du Québec - Nature et Technologies [2015-PR-182754], the Natural Sciences and Engineering Research Council of Canada [435897-2013], the Quebec BioImaging Network
- the Centre National de la Recherche Scientifique (CNRS), the “Fondation A*midex-Investissements d'Avenir” and the “Fondation Aix-MArseille Université”, the Stockholm County Council (ALF project), the French National Program for Clinical Research (PHRC) which funded the EMISEP study. The European Union (FEDER), the French State, the Brittany Council, Rennes Metropole, Inria, Inserm and the University Hospital of Rennes for supporting data acquisition.”
The authors thank Dr. Marie Claude Guertin and Simon Lévy for fruitful discussions and Claudia Gandini Wheeler-Kingshott (University College London) for sharing data.
References
1. Sombekke, M. H. et al. Spinal cord lesions in patients with clinically isolated syndrome: a powerful tool in diagnosis and prognosis. Neurology 80, 69–75 (2013).
2. Bot, J. C. J. et al. Spinal cord abnormalities in recently diagnosed MS patients: added value of spinal MRI examination. Neurology 62, 226–233 (2004).
3. Kearney, H., Miller, D. H. & Ciccarelli, O. Spinal cord MRI in multiple sclerosis--diagnostic, prognostic and clinical value. Nat. Rev. Neurol. 11, 327–338 (2015).
4. Rocca, M. A. et al. Voxel-wise mapping of cervical cord damage in multiple sclerosis patients with different clinical phenotypes. J. Neurol. Neurosurg. Psychiatry 84, 35–41 (2013).
5. Kearney, H. et al. Grey matter involvement by focal cervical spinal cord lesions is associated with progressive multiple sclerosis. Mult. Scler. 22, 910–920 (2016).
6. Roxburgh, R. H. S. R. et al. Multiple Sclerosis Severity Score: using disability and disease duration to rate disease severity. Neurology 64, 1144–1151 (2005).
7. De Leener, B. et al. SCT: Spinal Cord Toolbox, an open-source software for processing spinal cord MRI data. Neuroimage 145, 24–43 (2017).
8. De Leener, B. et al. PAM50: Multimodal Template of the Brainstem and Spinal Cord Compatible with the ICBM152 Space. in Proceedings of the 25th Annual Meeting of ISMRM 0187 (2017).
9. Parisot, S. et al. Spectral Graph Convolutions on Population Graphs for Disease Prediction. arXiv preprint arXiv:1703. 03020 (2017).
Figures