0080
Characterization of Abdominal Neoplasms using a Fast T2 Mapping Radial TSE Technique1Electrical and Computer Engineering, University of Arizona, Tucson, AZ, United States, 2Medical Imaging, University of Arizona, Tucson, AZ, United States, 3Biomedical Engineering, University of Arizona, Tucson, AZ, United States
Synopsis
Radial turbo spin-echo (RADTSE) based methods have been proposed for quantitative T2 mapping. RADTSE yields high spatio-temporal resolution and allows the reconstruction of co-registered images at multiple TE times from a short acquisition (i.e. a breath hold). We investigate the clinical utility of RADTSE for the quantitative characterization of abdominal neoplasms.
Introduction
T2-weighted imaging is widely used for the diagnosis of pathologies such as focal liver lesions. These are typically diagnosed as benign or malignant based on the qualitative assessment of signal intensity relative to liver [1-4]. T2 relaxation has also been proposed for the quantitative characterization of abdominal neoplasms. Previous studies have found significant differences in T2 relaxation times between different types of lesions, providing a range of classification for cysts, hemangiomas and malignancies [5-9].
Most methods for T2 mapping of the abdomen suffer from low spatial and/or temporal resolution, mis-registered TE images, or long acquisition times. Radial turbo spin-echo (RADTSE) based methods have been proposed for quantitative T2 mapping [10]. RADTSE yields high spatio-temporal resolution and allows the reconstruction of images at multiple TE times (which are registered by the nature of the acquisition) from a short acquisition (i.e. a breath hold). The use of a radial trajectory makes the technique robust to motion [11]. Recent developments in RADTSE incorporate model-based reconstructions. These take into account the presence of indirect echoes in T2 estimation and partial volume effects for small lesion (diameter < 1.5 cm) characterization.
In this work, we investigate the clinical utility of RADTSE for the quantitative characterization of abdominal neoplasms using data acquired on 56 subjects.
Methods
In vivo Imaging:
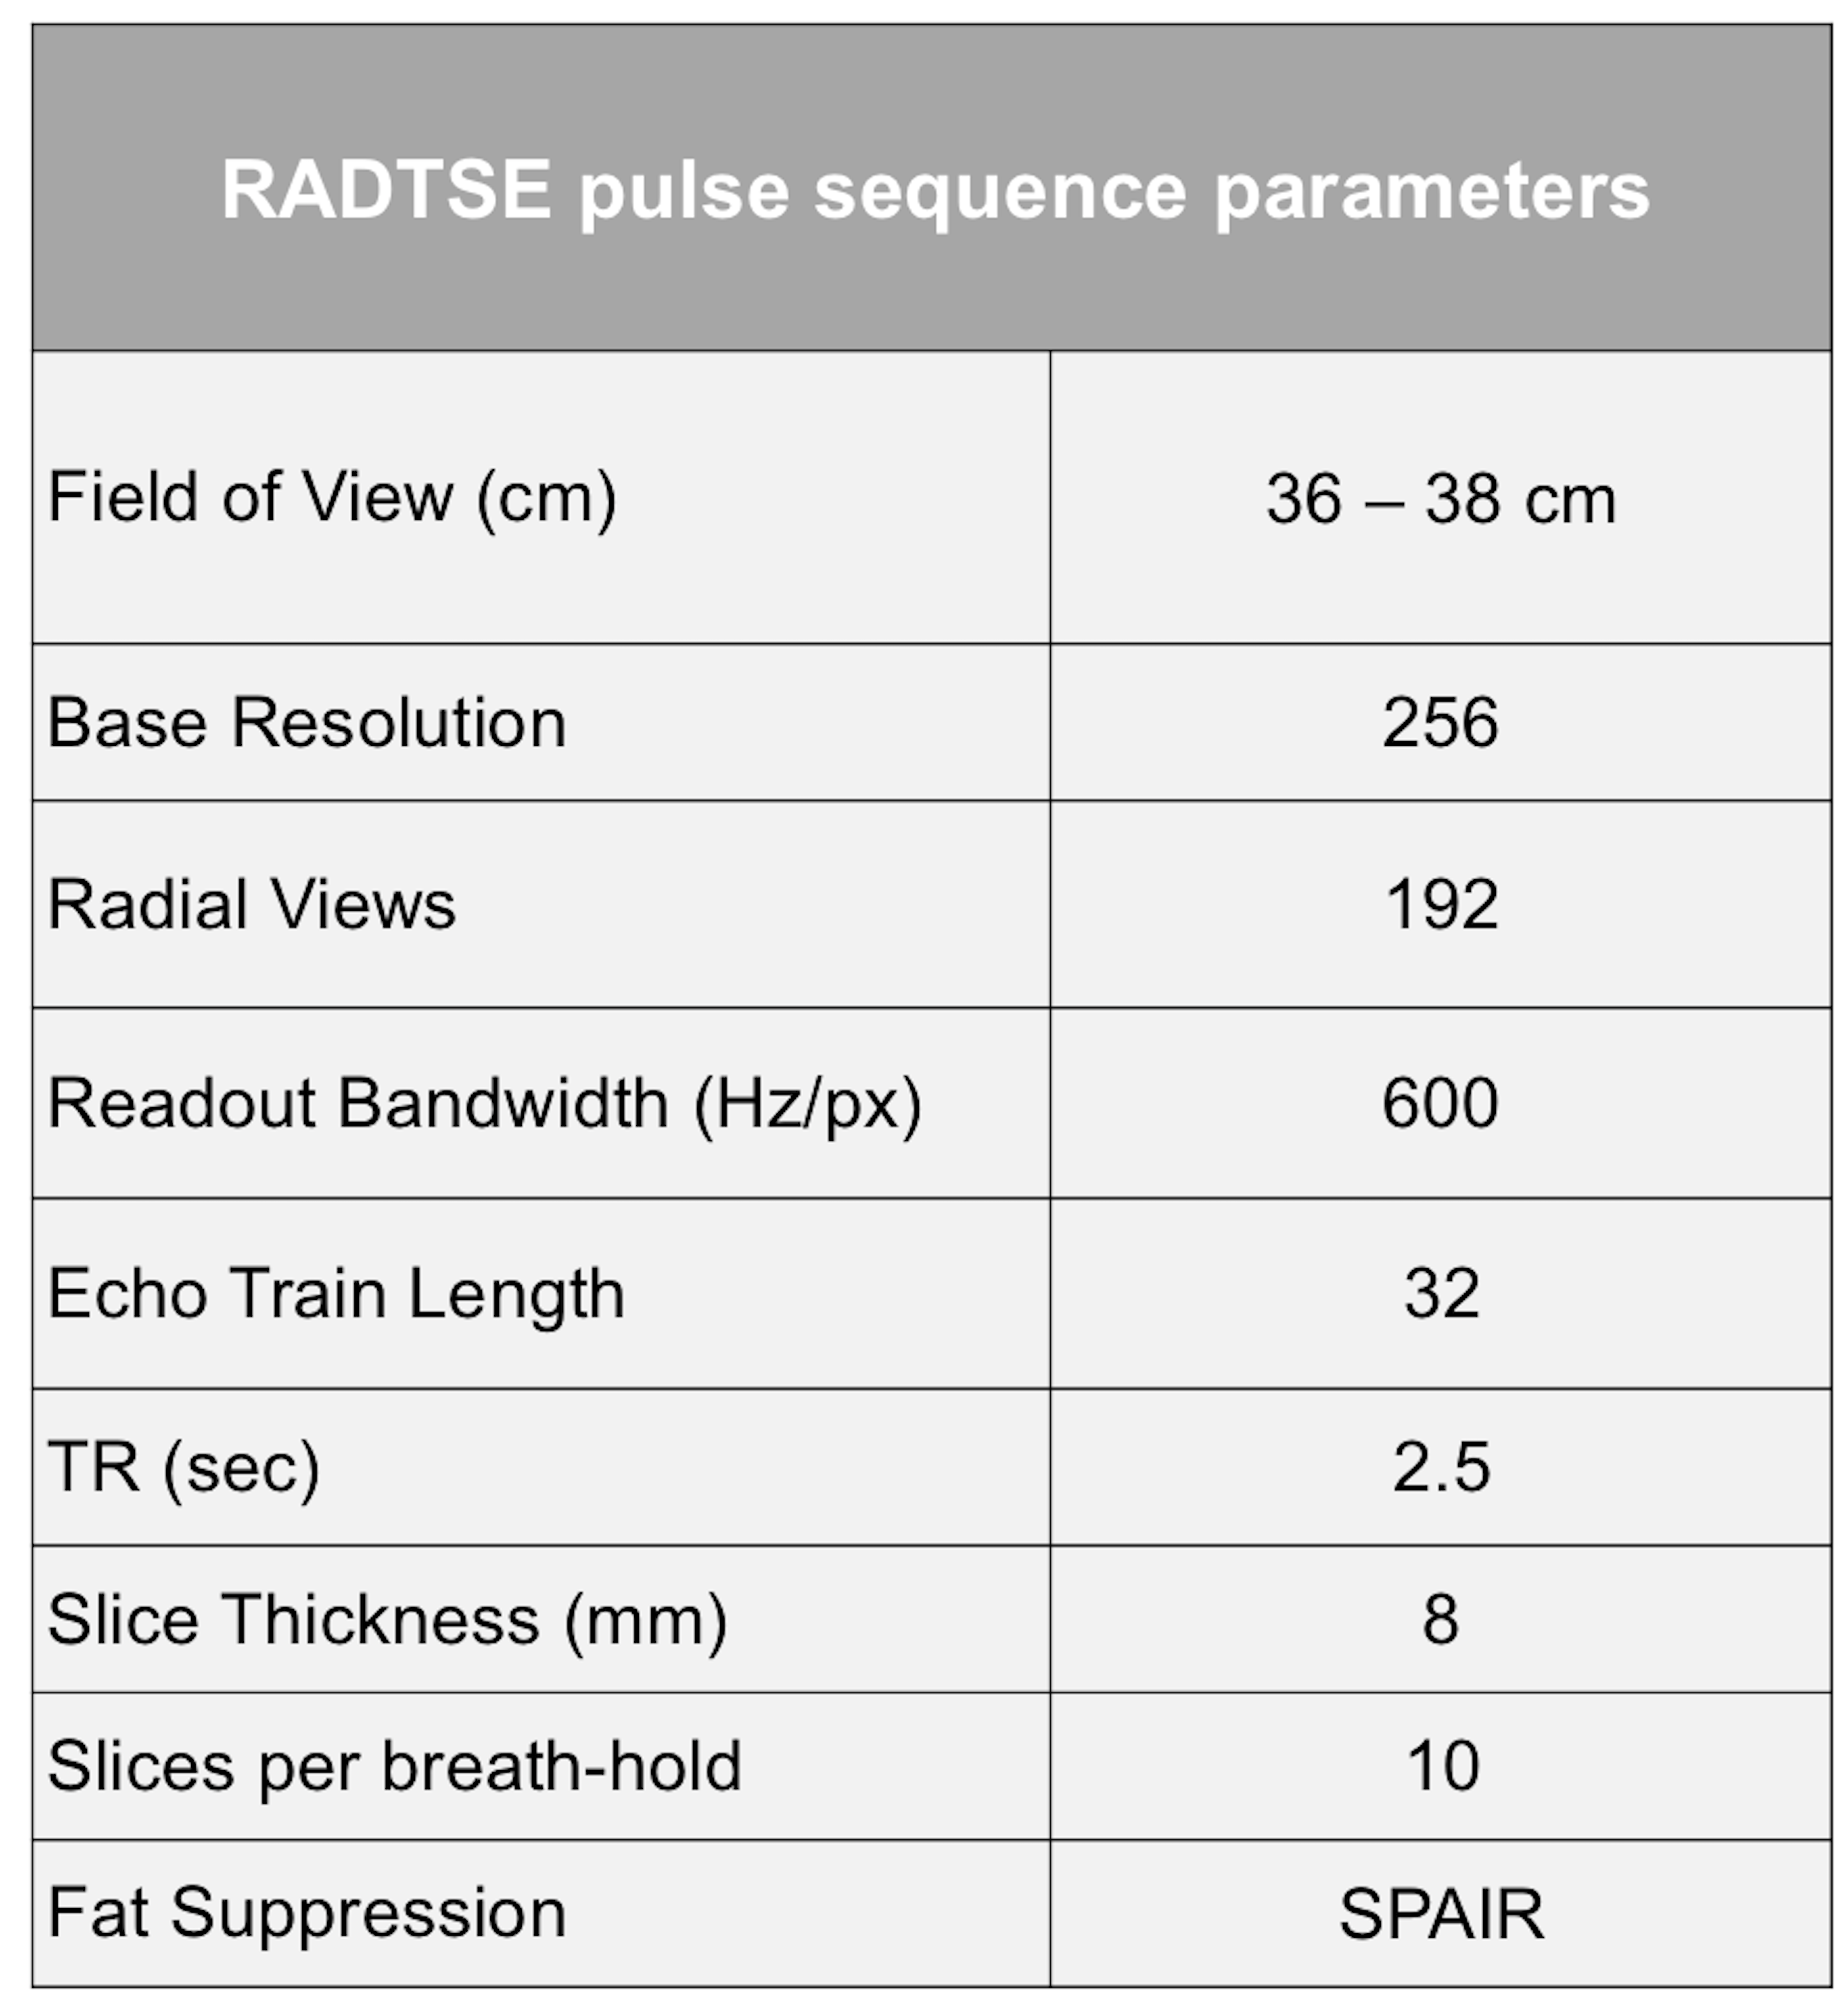
Informed consent was obtained from the subjects prior to imaging in compliance with the Institutional Review Board requirements. Breath-held abdominal imaging was performed using RADTSE on a 1.5T Siemens Aera scanner using torso and spine phased array coils. The pulse sequence parameters are shown in Table 1. The acquired data have high temporal sampling (every 6 ms) and covers TEs from 6 ms to 190 ms.
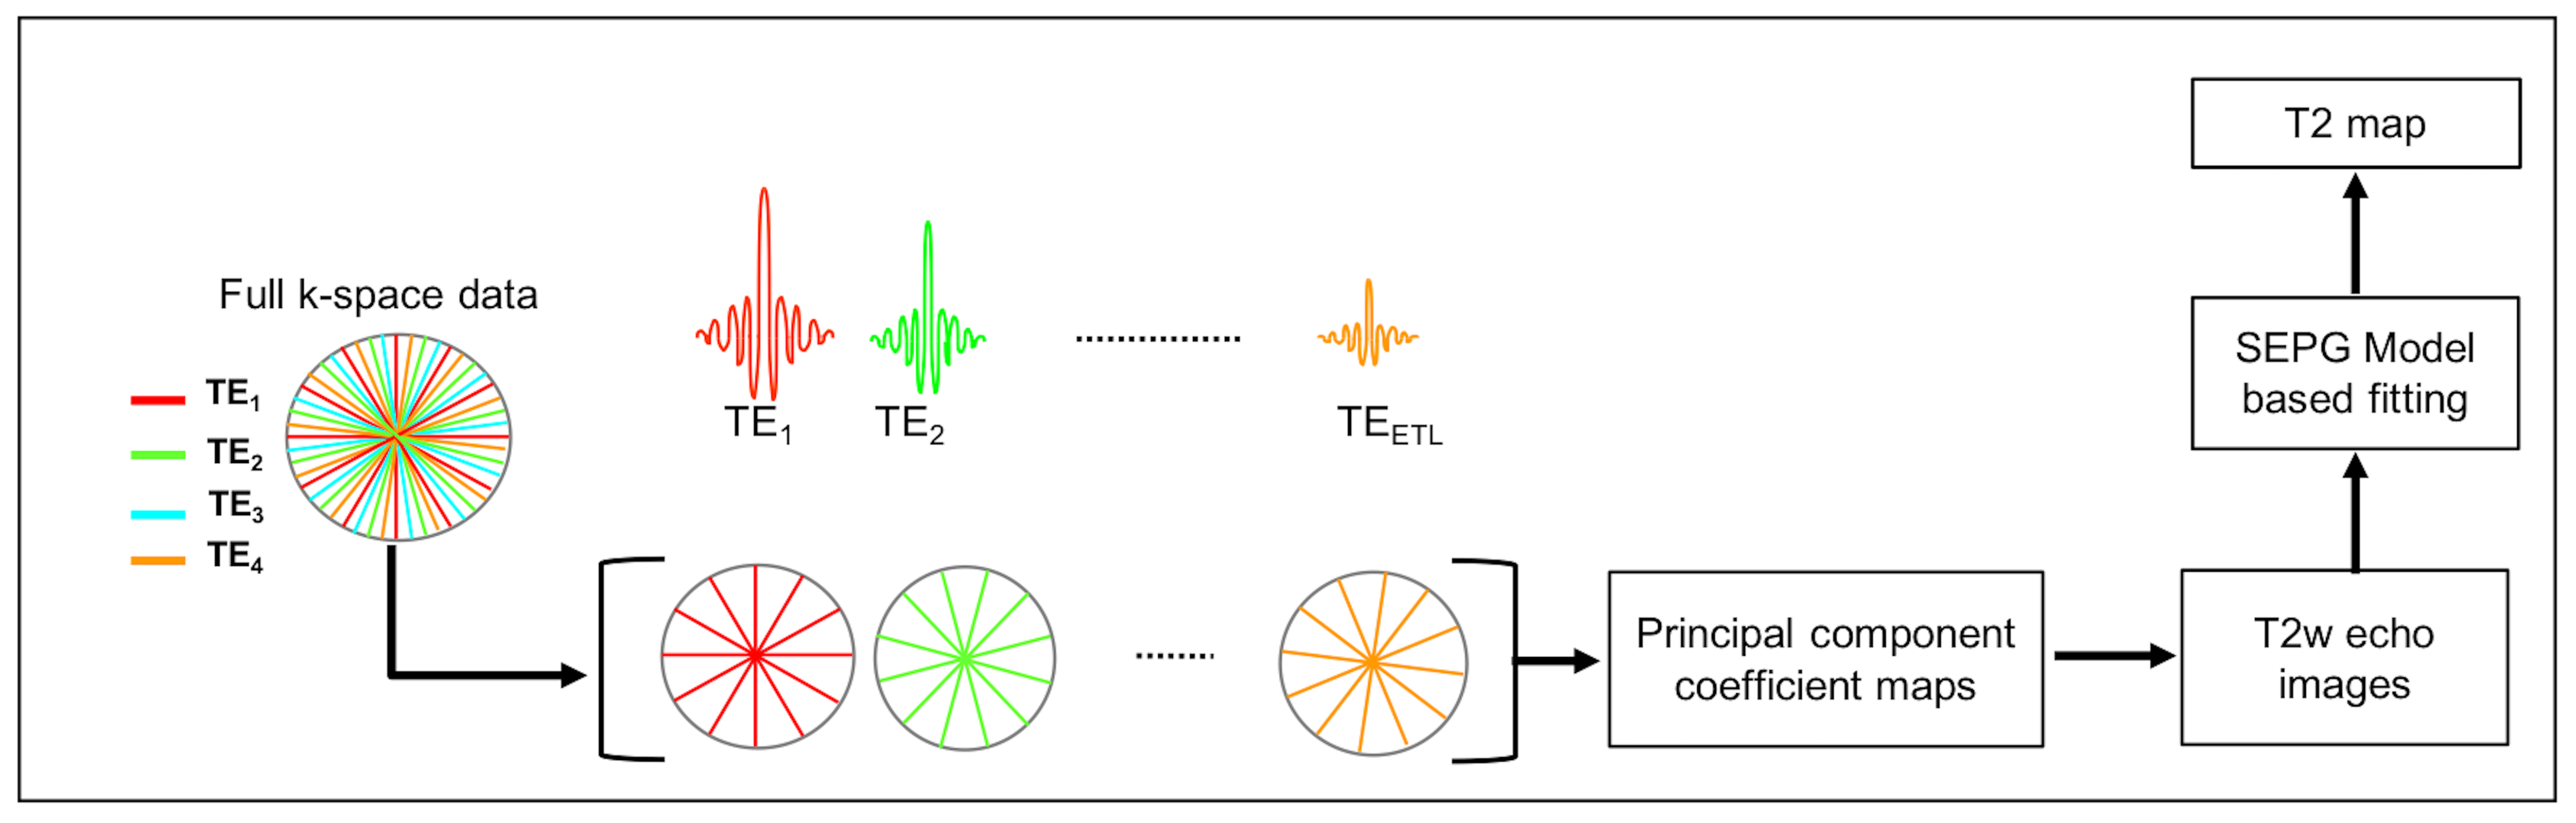
Image Reconstruction
In RADTSE all radial views sample the center of k-space and this enables the reconstruction of images at each individual TEs from highly under-sampled data using model based iterative algorithms [12-13] (Figure 1). These methods reconstruct the echo images by imposing principal component subspace constraints. The subspace basis is generated based on the underlying signal model. In order to account for the indirect echoes arising from imperfections in the refocusing pulse, the slice-resolved extended phase graph (SEPG) model was used to describe the T2 signal evolution. A T2 map is generated by fitting the echo images to the signal model using a pattern matching approach [14].
In multi-slice 2D imaging, partial volume effects introduce error in the estimated T2 due to contamination from the liver parenchyma. A joint estimation algorithm for bi-exponential fitting was previously proposed [15] to improve the T2 estimation in the presence of partial volume. This algorithm was adapted to work with the EPG model and used to generate more accurate T2 maps for the analysis.
Data from 56 subjects were analyzed, resulting in a set of 90 neoplasms (48 malignancies, 10 hemangiomas and 32 cysts).
Results
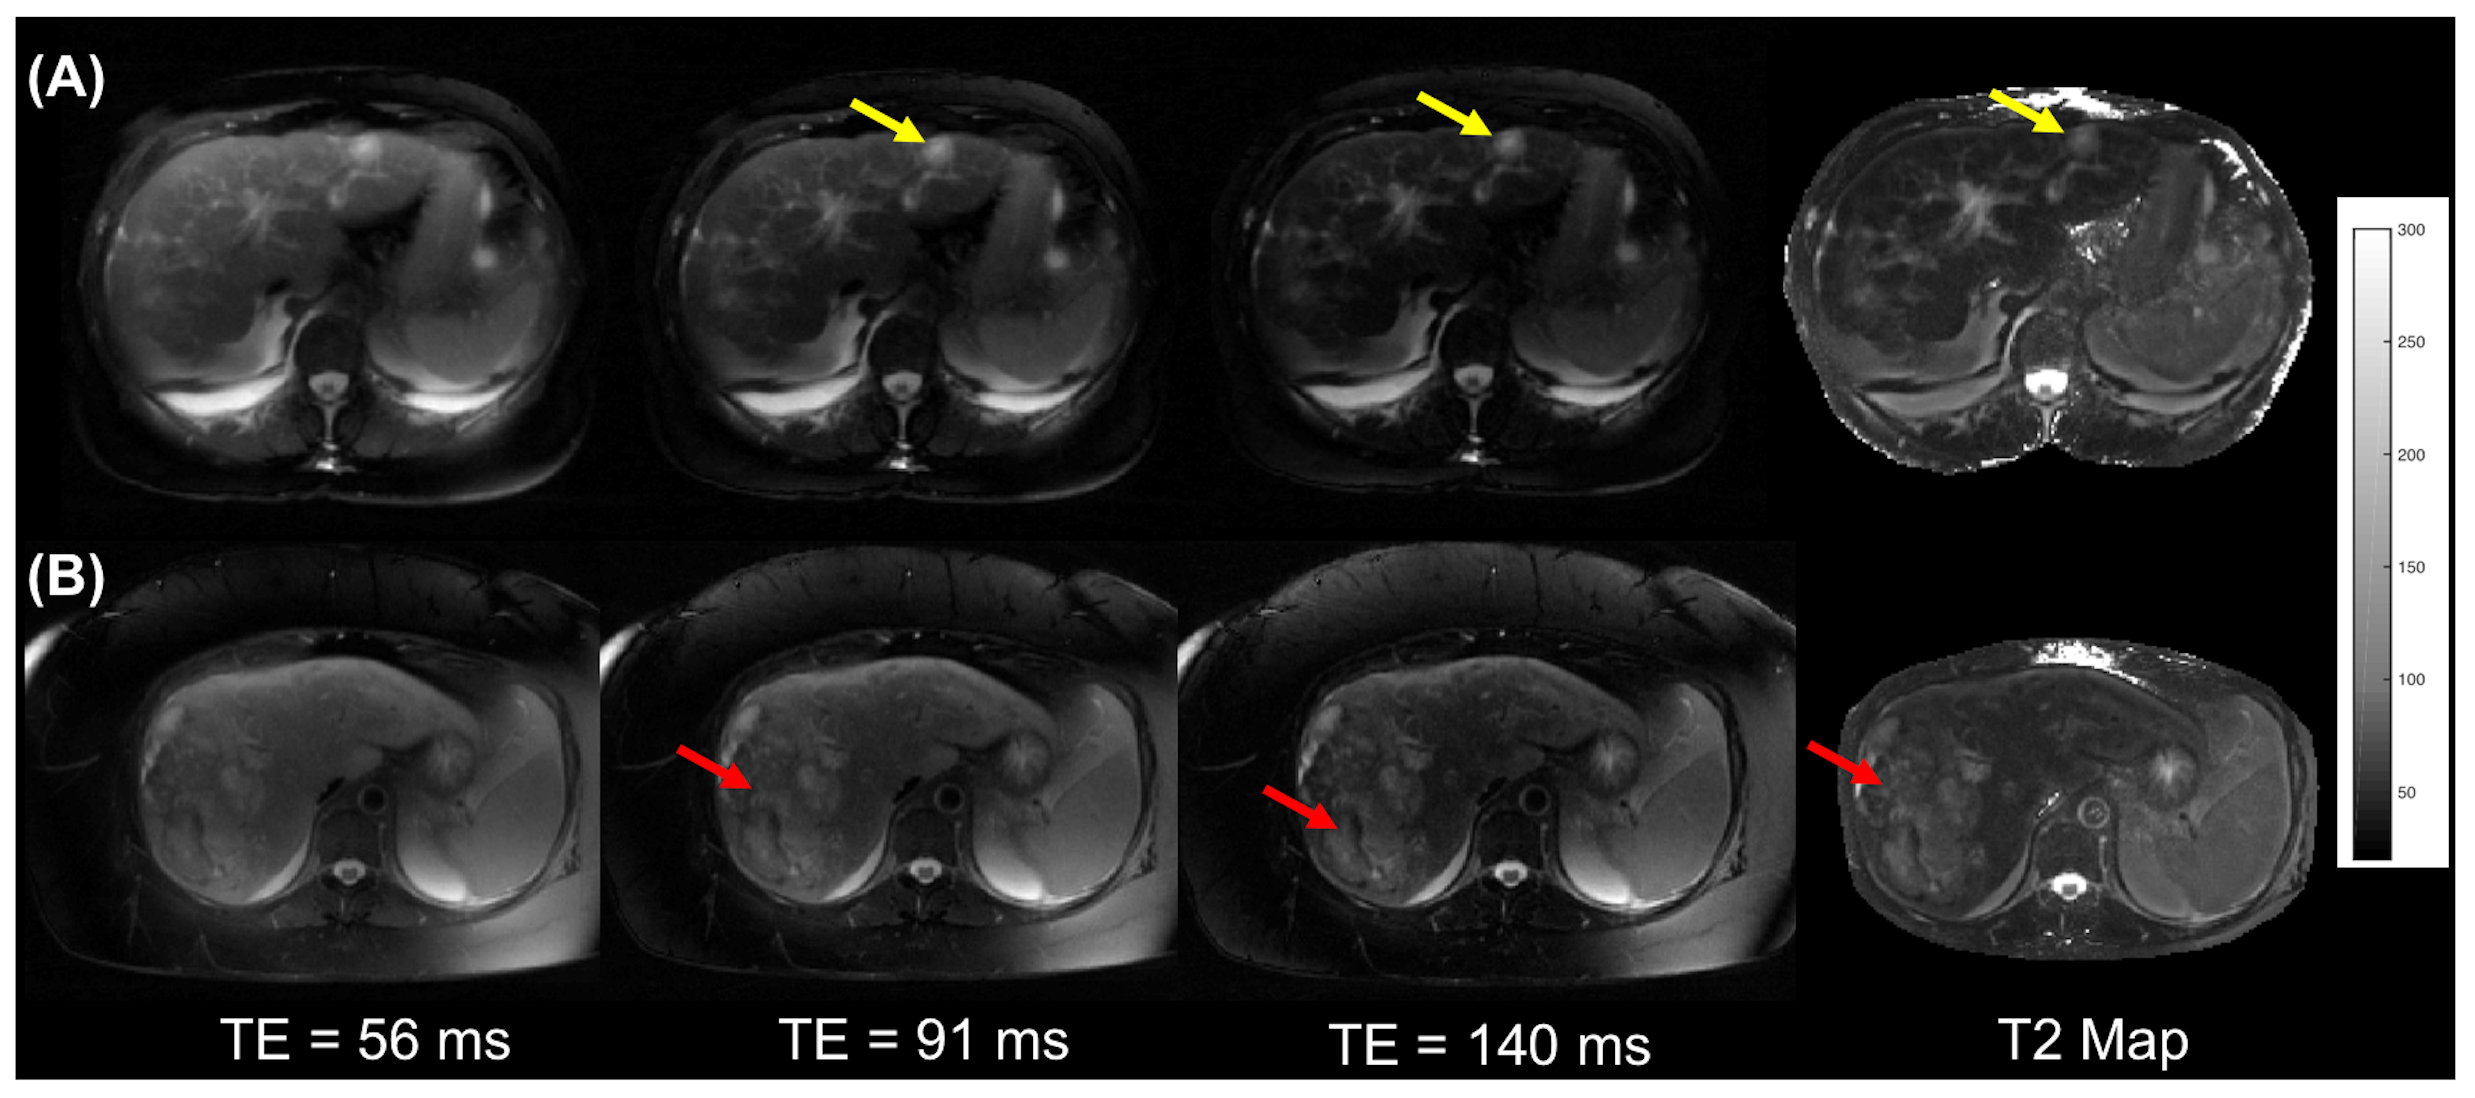
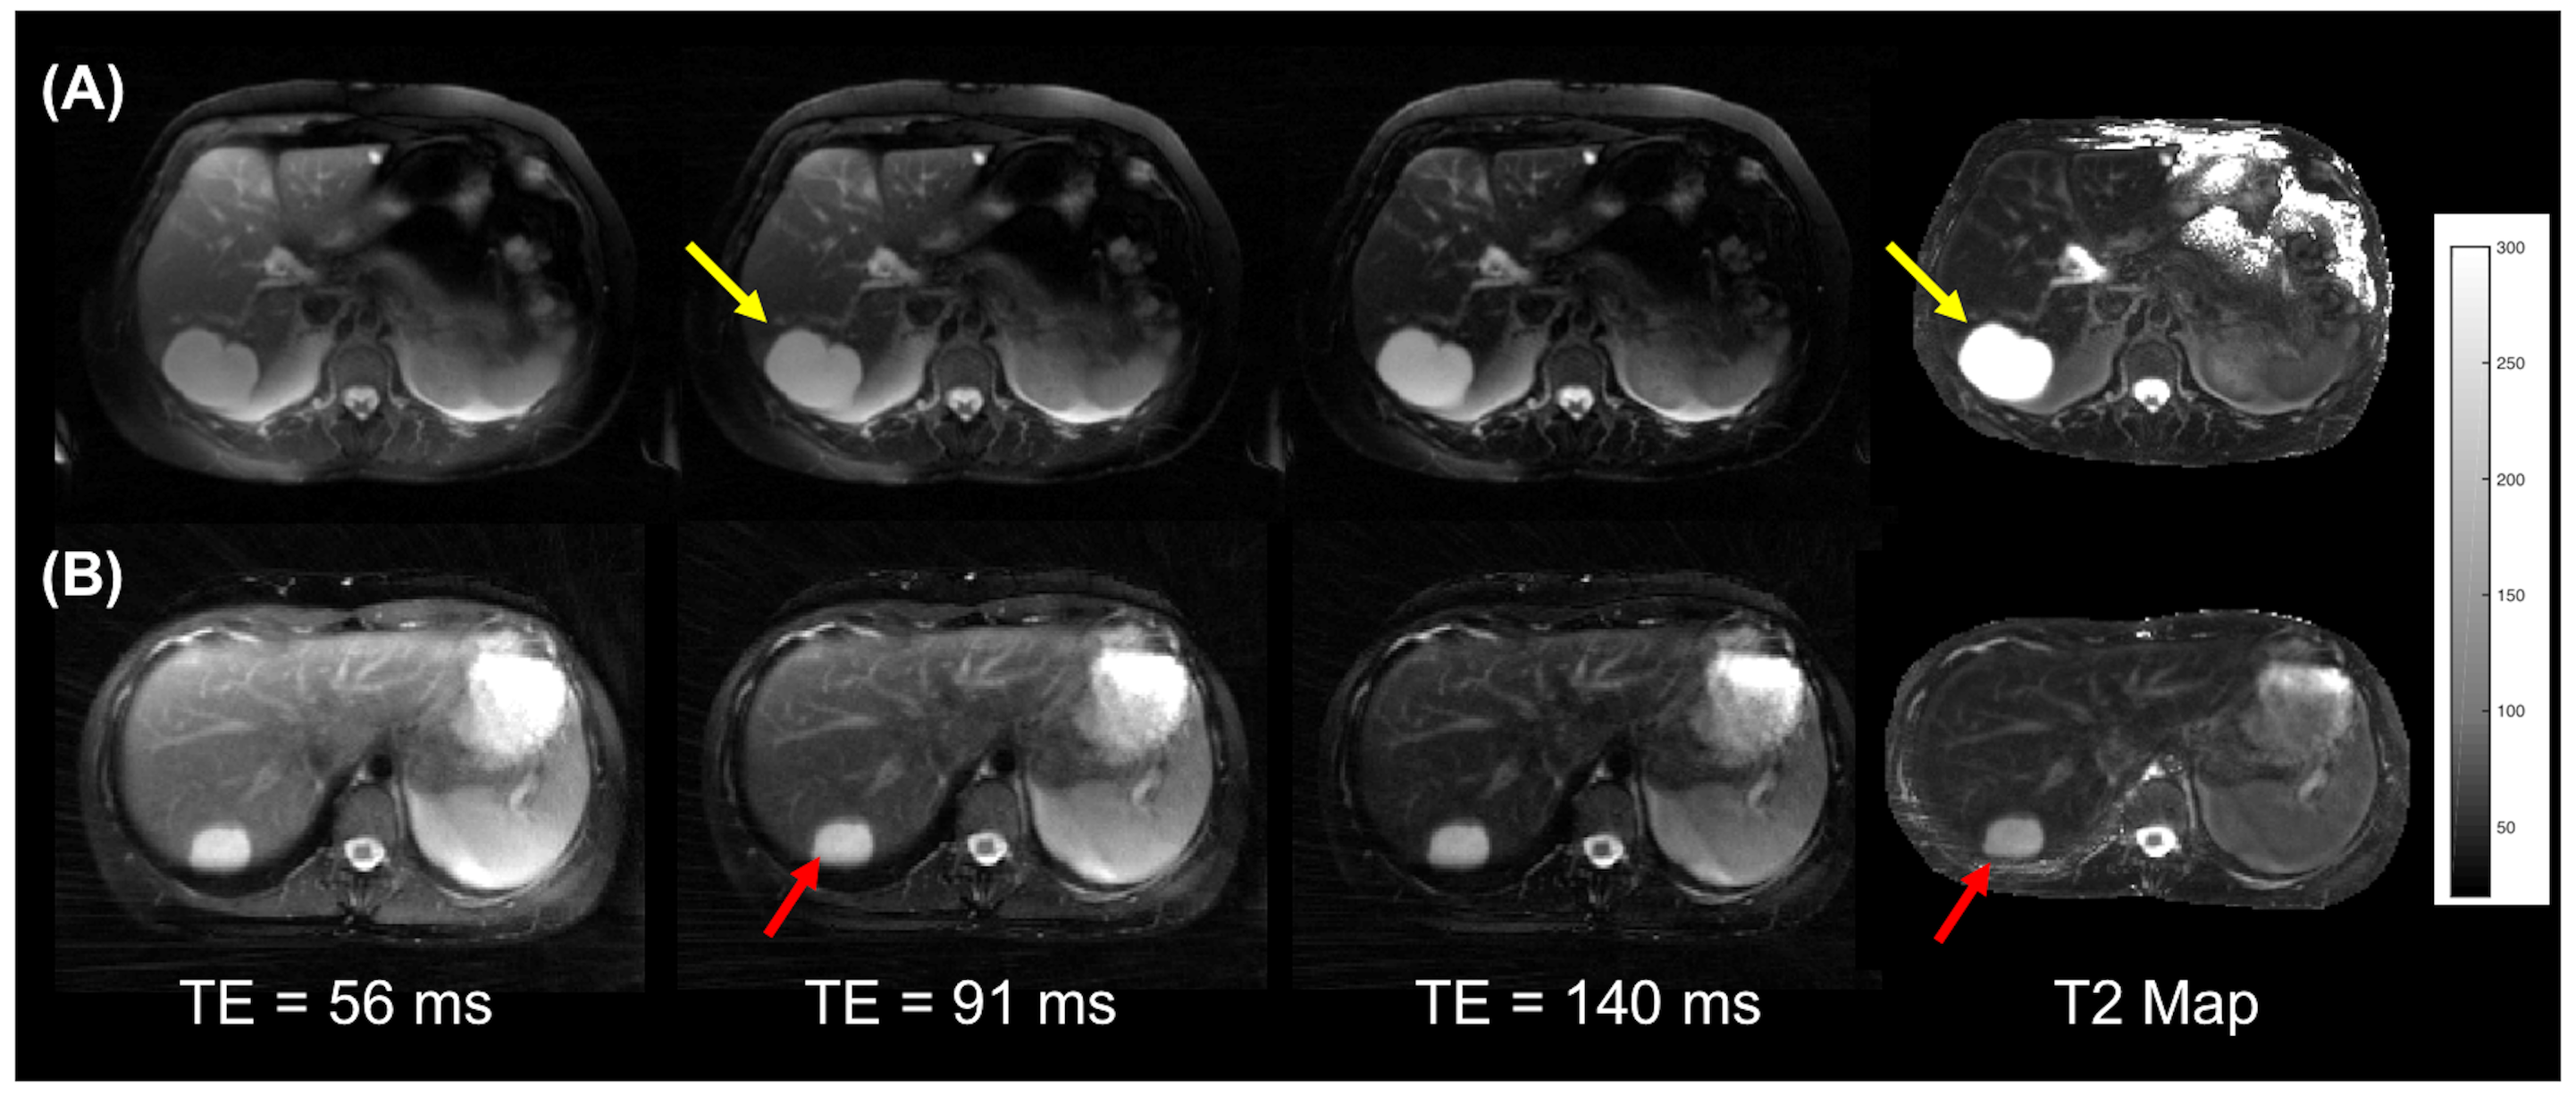
Figure 2 shows T2-weighted images and T2 maps for a subject with liver metastases and a subject with hepatocellular carcinoma. The malignancies appear mildly hyper-intense at longer TEs. Figure 3 shows representative images from subjects with benign lesions.
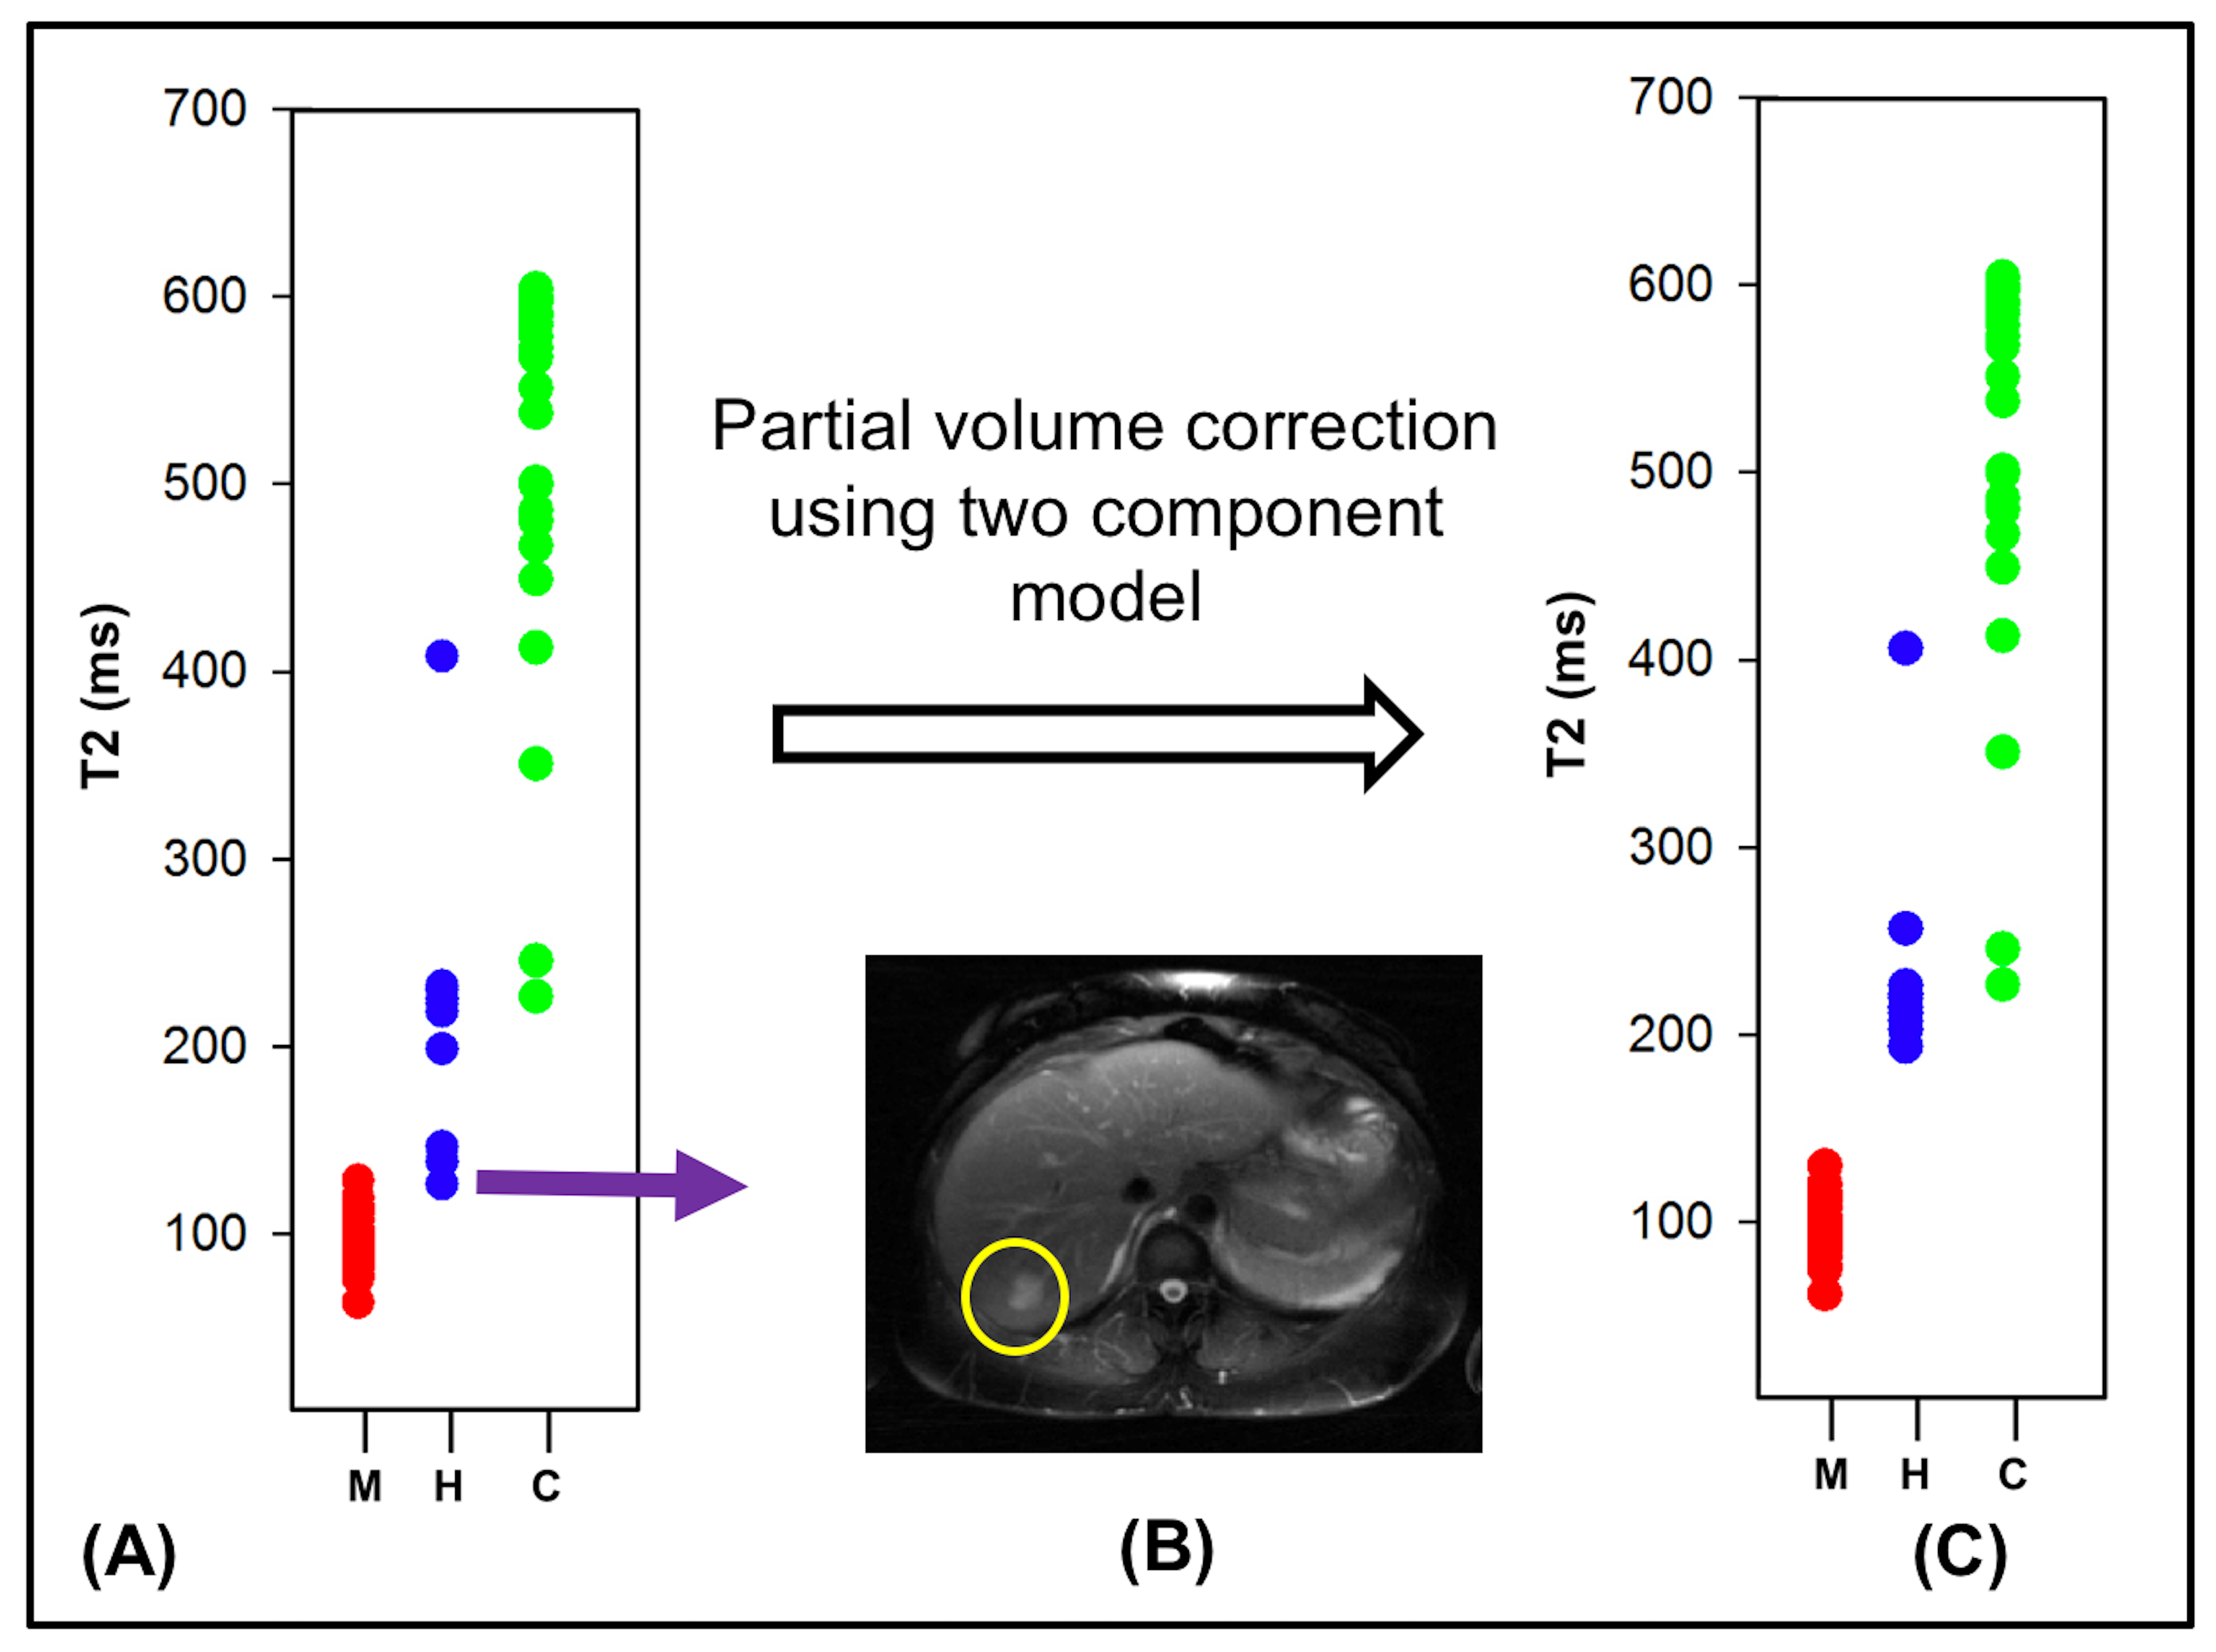
The mean T2 values for the abdominal neoplasms were extracted using a manual ROI and used for statistical evaluation. The plot in Figure 4(A) shows the T2 values of the malignant and the most common benign lesions. Separation between cysts and malignancies is excellent. Separation between malignancies and hemangiomas is excellent for larger lesions (diameter > 2 cm). For small hemangiomas (as the one shown in Figure 4B) T2s are underestimated due to contamination from liver, misclassifying them as malignancies (false positive). Complete separation between malignancies and all hemangiomas was achieved when partial volume correction was applied (as shown in Figure 4C). The mean T2 value of the lesions across the subjects were: malignancies = 90.70 ± 13.85 ms, hemangiomas = 228.15 ± 61.62 ms and cysts=525 ± 100.04 ms. A two-tailed t-test of the means showed significant difference (p-value < 0.01 and $$$\alpha$$$ = 0.05) in the mean T2 values of the three types of neoplasms.
Conclusion
The Radial TSE sequence provides co-registered motion robust T2-weighted images at multiple echo times. The use of iterative reconstruction algorithms along with multi-component modeling of the T2 signal enables the generation of accurate T2 maps. The utility of the sequence has been demonstrated for T2 based characterization of abdominal neoplasms.Acknowledgements
No acknowledgement found.References
[1] McFarland EG, Mayo-Smith WW, Saini S, Hahn PF, Goldberg MA, Lee MJ. Hepatic hemangiomas and malignant tumors: improved differentiation with heavily T2-weighted conventional spin-echo MR imaging. Radiology 1994;193:43–47.
[2] Schima W, Saini S, Echeverri JA, Hahn PF, Harisinghani M, Mueller PR. Focal liver lesions: characterization with conventional spin-echo versus fast spin-echo T2-weighted MR imaging. Radiology 1997;202:389–393.
[3] Ito K, Mitchell DG, Outwater EK, Szklaruk J, Sadek AG. Hepatic lesions: discrimination of nonsolid, benign lesions from solid, malignant lesions with heavily T2-weighted fast spin-echo MR imaging. Radiology 1997;204:729–737.
[4] Taouli B, Vilgrain, et al , Evaluation of Liver Diffusion Isotropy and Characterization of Focal Hepatic Lesions with Two Single-Shot Echo-planar MR Imaging Sequences: Prospective Study in 66 Patients, Radiology, 2003
[5] Cieszanowski A, Anysz-Grodzicka A, Szeszkowski W, Kaczynski B, Maj E, Gornicka B, Grodzicki M, Grudzinski I, Stadnik A, Krawczyk M, Rowinski O. Characterization of focal liver lesions using quantitative techniques: comparison of apparent diffusion coefficient values and T2 relaxation times. Eur Radiol 2012;22:2514–2524.
[6] Kim YH, Saini S, Blake MA, Harisinghani M, Chiou YY, Lee WJ, Yu JS, Hahn PF. Distinguishing hepatic metastases from hemangiomas: qualitative and quantitative diagnostic performance through dual echo respiratory-triggered fast spin echo magnetic resonance imaging. J Comput Assist Tomogr 2005;29:571–579.
[7] Farraher SW, Jara H, Chang KJ, Ozonoff A, Soto JA. Differentiation of hepatocellular carcinoma and hepatic metastasis from cysts and hemangiomas with calculated T2 relaxation times and the T1, 2006
[8] Goldberg MA, Hahn PF, et al, Value of T1 and T2 relaxation times from echoplanar MR imaging in the characterization of focal hepatic lesions. American Journal of Roentgenology 1993 160:5, 1011-1017
[9] Fenlon, H. M., Tello, R., Victor, L. S., & Yucel, E. K. (2000). Signal characteristics of focal liver lesions on double echo T2-weighted conventional spin echo MRI: observer performance versus quantitative measurements of T2 relaxation times. Journal of computer assisted tomography, 24(2), 204-211.
[10] Altbach MI, Outwater EK, Trouard TP, Krupinski EA, Theilmann RJ, Stopeck AT, Kono M, Gmitro AF. Radial fast spin-echo method for T2-weighted imaging and T2 mapping of the liver. J Magn Reson Imaging 2002;16:179–189.
[11] Glover G and Pauly J. Projection reconstruction techniques for reduction of motion effects in mri. Magnetic Resonance in Medicine, 28(2):275–289, 1992.
[12] Huang C, Graff CG, Clarkson EW, Bilgin A, Altbach MI. T2 mapping from highly undersampled data by reconstruction of principal component coefficient maps using compressed sensing. Magn Reson Med. 2012 May; 67(5):1355-66.
[13] Huang C, Bilgin A, Barr T, and Altbach MI. T2 relaxometry with indirect echo compensation from highly undersampled data. Magn Reson Med, 70(4):1026-37, 2013.
[14] Huang C., Altbach M, Fakhri G., Pattern recognition for rapid T2 mapping with stimulated echo compensation, Magnetic Resonance Imaging, 32, 2014
[15] Huang C, Galons J-P, Graff CG, et al. Correcting Partial Volume Effect in Bi-exponential T2 Estimation of Small Lesions. Magnetic resonance in medicine. 2015;73(4):1632-1642.
Figures