0078
Motion Correction of Diffusion-weighted imaging in the analysis of Apparent Diffusion Coefficient for preoperative staging of hepatocellular carcinoma1School of Medical Information Engineering, Guangzhou University of Chinese Medicine, Guangzhou, China, 2Shenzhen Institutes of Advanced Technology, Chinese Academy of Sciences, Shenzhen, China, 3Guangzhou Medical University, Guangzhou, China, 4Department of Radiology, Guangdong General Hospital, Guangdong Academy of Medical Sciences, Guangzhou, China
Synopsis
Preoperative tumor staging of hepatocellular carcinoma (HCC) is a critical issue that influences tumor recurrence and patient survival in clinical practice. One of the challenges encountered in DWI of the liver is cardiac motion that can affect the accuracy of ADC measurements, which may inevitably influence the performance of DWI for HCC staging. However, the impact of motion for ADC and HCC staging has not been thoroughly investigated. In this work, we quantitatively investigate the relationship of motion correction, ADC and staging of HCC in order to widen the understanding of applications in DWI for tumor assessment.
Introduction
Hepatocellular carcinoma (HCC) is the third leading cause of cancerous death worldwide. Preoperative tumor staging is a critical issue that influences tumor recurrence and patient survival in clinical practice1. It has been reported that Diffusion-weighted imaging (DWI) is useful for lesion characterization, from which apparent diffusion coefficients (ADC) is expected to have the potential for preoperative staging of HCC2-3. One of the challenges encountered in DWI of the liver is cardiac motion that can affect the accuracy of ADC measurements, which may inevitably influence the performance of DWI for HCC staging. However, the impact of motion for ADC and HCC staging has not been thoroughly investigated in the literature4. In this work, we quantitatively investigate the relationship of motion correction, ADC and staging of HCC in order to widen the understanding of applications in DWI for tumor assessment.Method
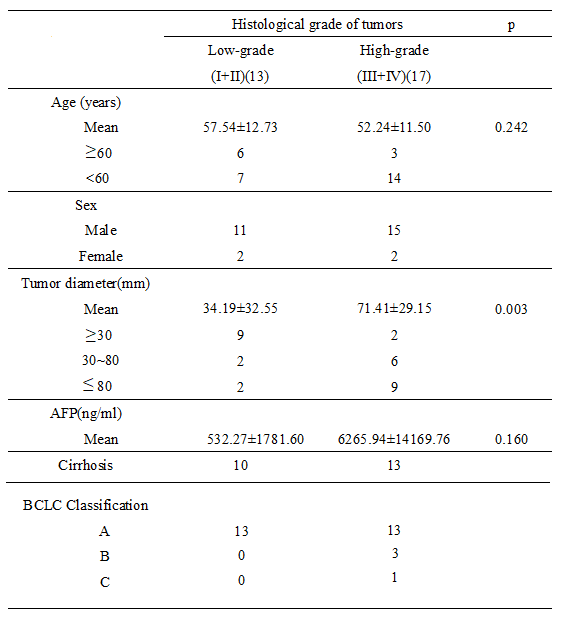
Thirty pathologically confirmed HCC lesions in 30 patients from July 2012 to October 2015 were included in this retrospective study. The clinical characteristic of thirty patients and pathological features of tumors were summarized in Table 1. Diffusion-weighted imaging (DWI) examinations were performed with a 3.0T MR scanner (Signa Excite HD 3.0T, GE Healthcare, Milwaukee, WI, USA), using a single-shot echo-planar imaging in a breath-hold routine. DWI parameters were: three b values of 0,100,600 sec/mm2; TR/TE 1800/35ms; flip angle, 90; a matrix of 128×128;slice thickness: 8 mm; interslice gap, 1 mm. The region of interest (ROI) extraction of HCCs in DWI images was performed manually by an experienced radiologist (10 years of experience in abdominal radiology), using a free-form curve fitting technique. An intensity-based rigid/non-rigid image registration approach was adopted to register each volume (b100 and b600) to the reference MR image (b0) for motion compensation5. The difference of quantitative values of HCCs in differentiating their pathological grades was assessed by the independent student’s t-test. The performance of ADC value in differentiating the biological aggressiveness of HCC was assessed using Receiver Operating Characteristic (ROC) analysis, and the area under the standard ROC curves (AUC) was also calculated. P<0.05 was considered statistically significant.Results
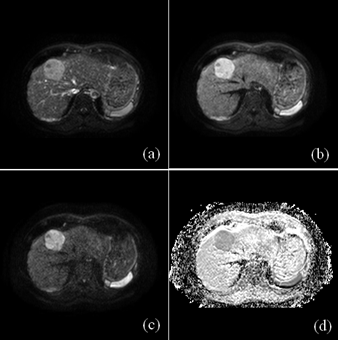
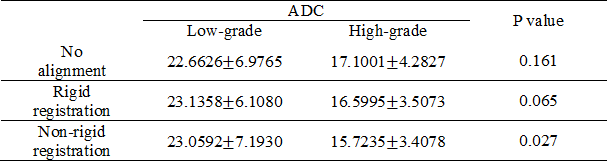
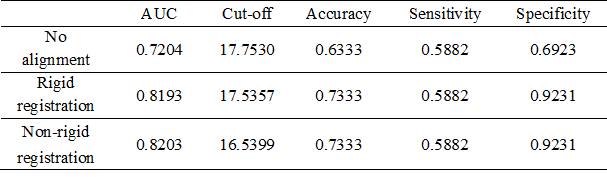
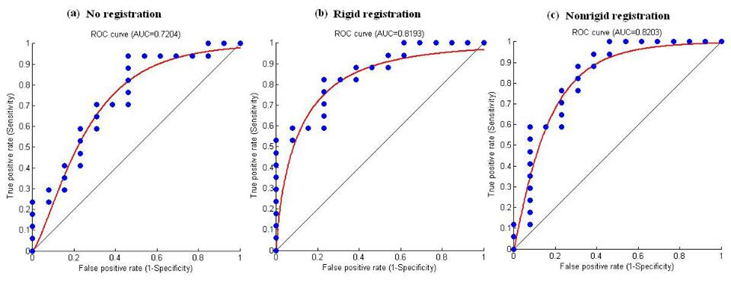
Figure 1 showed representative DWI images and the generated ADC map of a 59 year-old man with pathologically confirmed high-differentiated HCCs (grade II). As shown in Table 2, the ADC values of low-grade HCCs were larger than those of the high-grade HCCs for all the cases. However, there is no correlation between the histological grade of differentiation and the ADC value with the no alignment and the rigid registration (P>0.05, Table 2), while there is statistical difference for the ADC value between the low-grade and high-grade HCCs with the non-rigid registration (P=0.027, Table 2). In the case of no alignment, the results of AUC, accuracy, sensitivity and specificity were 0.7204, 0.6333, 0.5882 and 0.6923, respectively (Table 3). In contrast, both the rigid and non-rigid registration methods yielded improved performance (Table 3). Specifically, the sensitivity was the same for all the cases, while the specificity was significantly improved when registration was performed. Furthermore, the ROC curves were also plotted for the ADC value with the no alignment, the rigid registration, and the non-rigid registration method as shown in Figure 2.Discussion
Previous studies proposed exactly opposite findings for the relationship of the histopathological grade of HCC and the ADC including correlation and no correlation between them2-3. However, none of them considered the impact of motion for the evaluation of the relationship. Our quantitative results demonstrated that the histopathological grade of HCC was correlated with the ADC value when non-rigid image registration was performed, but not for no alignment and rigid registration, suggesting that motion correction with better alignment may reduce the overlap of ADC values between histological grades. Meanwhile, motion correction with rigid or non-rigid registration significantly improved the performance of specificity with respect to low-grade HCCs. It might be explained that low-grade HCCs are usually with relatively smaller size, which may be more susceptible to large motion compared with that of high-grade HCCs with relatively larger size. Furthermore, non-rigid registration yielded very weak improvement of performance for HCC staging compared with rigid registration (AUC: 0.8193 versus 0.8203), implying that the conventional non-rigid registration may also be difficult to achieve better performance than that of rigid registration within tumor regions due to the challenge of alignment for noisy DWI images6. Therefore, more robust and accurate registration method for ADC measurement in DWI images is encouraged to be required in clinical practice.
Conclusion
Our study suggests that motion correction can further improve the performance of HCC staging when performing DWI imaging in a breath-hold routine for lesion characterization, especially for low-grade HCCs.Acknowledgements
This research is supported by the grant from National Natural Science Foundation of China (NSFC: 81771920), in part by grants from National Natural Science Foundation of China (NSFC: 61302171 and U1301258) and Shenzhen Basic research project (No. JCYJ20150630114942291).References
1. Bruix J, Sherman M. Management of hepatocellular carcinoma. Hepatology 2005; 42:1208-1236.
2. Nasu K, Kuroki Y, Tsukamoto T, et al. Diffusion-weighted imaging of surgically resected hepatocellular carcinoma: imaging characteristics and relationship among signal intensity, apparent diffusion coefficient, and histopathologic grade. AJR Am J Roentgenol 2009; 193(2): 438-444.
3. Nishie A, Tajima T, Asayama Y, et al.Diagnostic performance of apparent diffusion coefficient for predicting histological grade of hepatocellular carcinoma. Eur J Radiol 2011;80(2): e29-e33.
4. Guyader JM, Bernardin L, Douglas NH, et al. Influence of image registration on apparent diffusion coefficient images computed from free-breathing diffusion MR images of the abdomen. J Magn Reson Imaging 2015; 42:315-330.
5. Klein S, Staring M, Murphy K, Viergever M.A, Pluim J.P.W. elastix: a toolbox for intensity based medical image registration. IEEE Trans Med Imaging 2010; 29(1):196 - 205.
[6] Sotiras A, Davatzikos C, Paragios N. Deformable medical image registration: a survey. IEEE Trans Med Imaging 2013; 32: 1153-1190.
Figures