0077
Volumetric Apparent Diffusion Coefficient Histogram Analysis in Differentiating Intrahepatic Cholangiocarcinoma from Hepatocellular Carcinoma1Department of Radiology, Tongji Hospital, Tongji Medical College, Huazhong University of Science and Technology, Wuhan, China
Synopsis
Accurate differentiation between intrahepatic cholangiocarcinoma (IHCC) and hepatocellular carcinoma (HCC) is essential for adequate treatment planning. In the present study, non-contrast volumetric ADC histogram analysis was employed to differentiate IHCC (n=33) and HCC (n=98). The results suggested that except the kurtosis and skewness, all the volumetric ADC histogram parameters, were helpful in distinguishing IHCC from HCC. Among all the parameters, 75th percentile ADC was most helpful to distinguish the two diseases. This non-contrast method provides useful information in differentiating IHCC from HCC, it benefits patients who are contraindicate to contrast agents.
Introduction
Accurate differentiation between intrahepatic cholangiocarcinoma (IHCC) and hepatocellular carcinoma (HCC) is essential because the treatment and prognosis differ significantly. IHCC is usually fatal and surgical resection is the mainstay for treatment.1 Liver transplantation for IHCC is controversial, while for HCC, it is an important treatment option. Currently, the differentiation between IHCC and HCC is mainly based on enhancement pattern on multiphasic CT or MRI.2 However, some IHCCs and HCCs may share similar enhancement pattern,3 making it difficult to differentiate between these two diseases. What is more, concerns have been raised about the health impacts of using contrast agents.4 If it is difficult to obtain dynamic contrast-enhanced images, radiologists should provide as much useful information as possible for clinical by using non-contrast methods. Here we try to explore the value of noncontrast volumetric ADC histogram analysis in differentiating IHCC from HCC.Methods
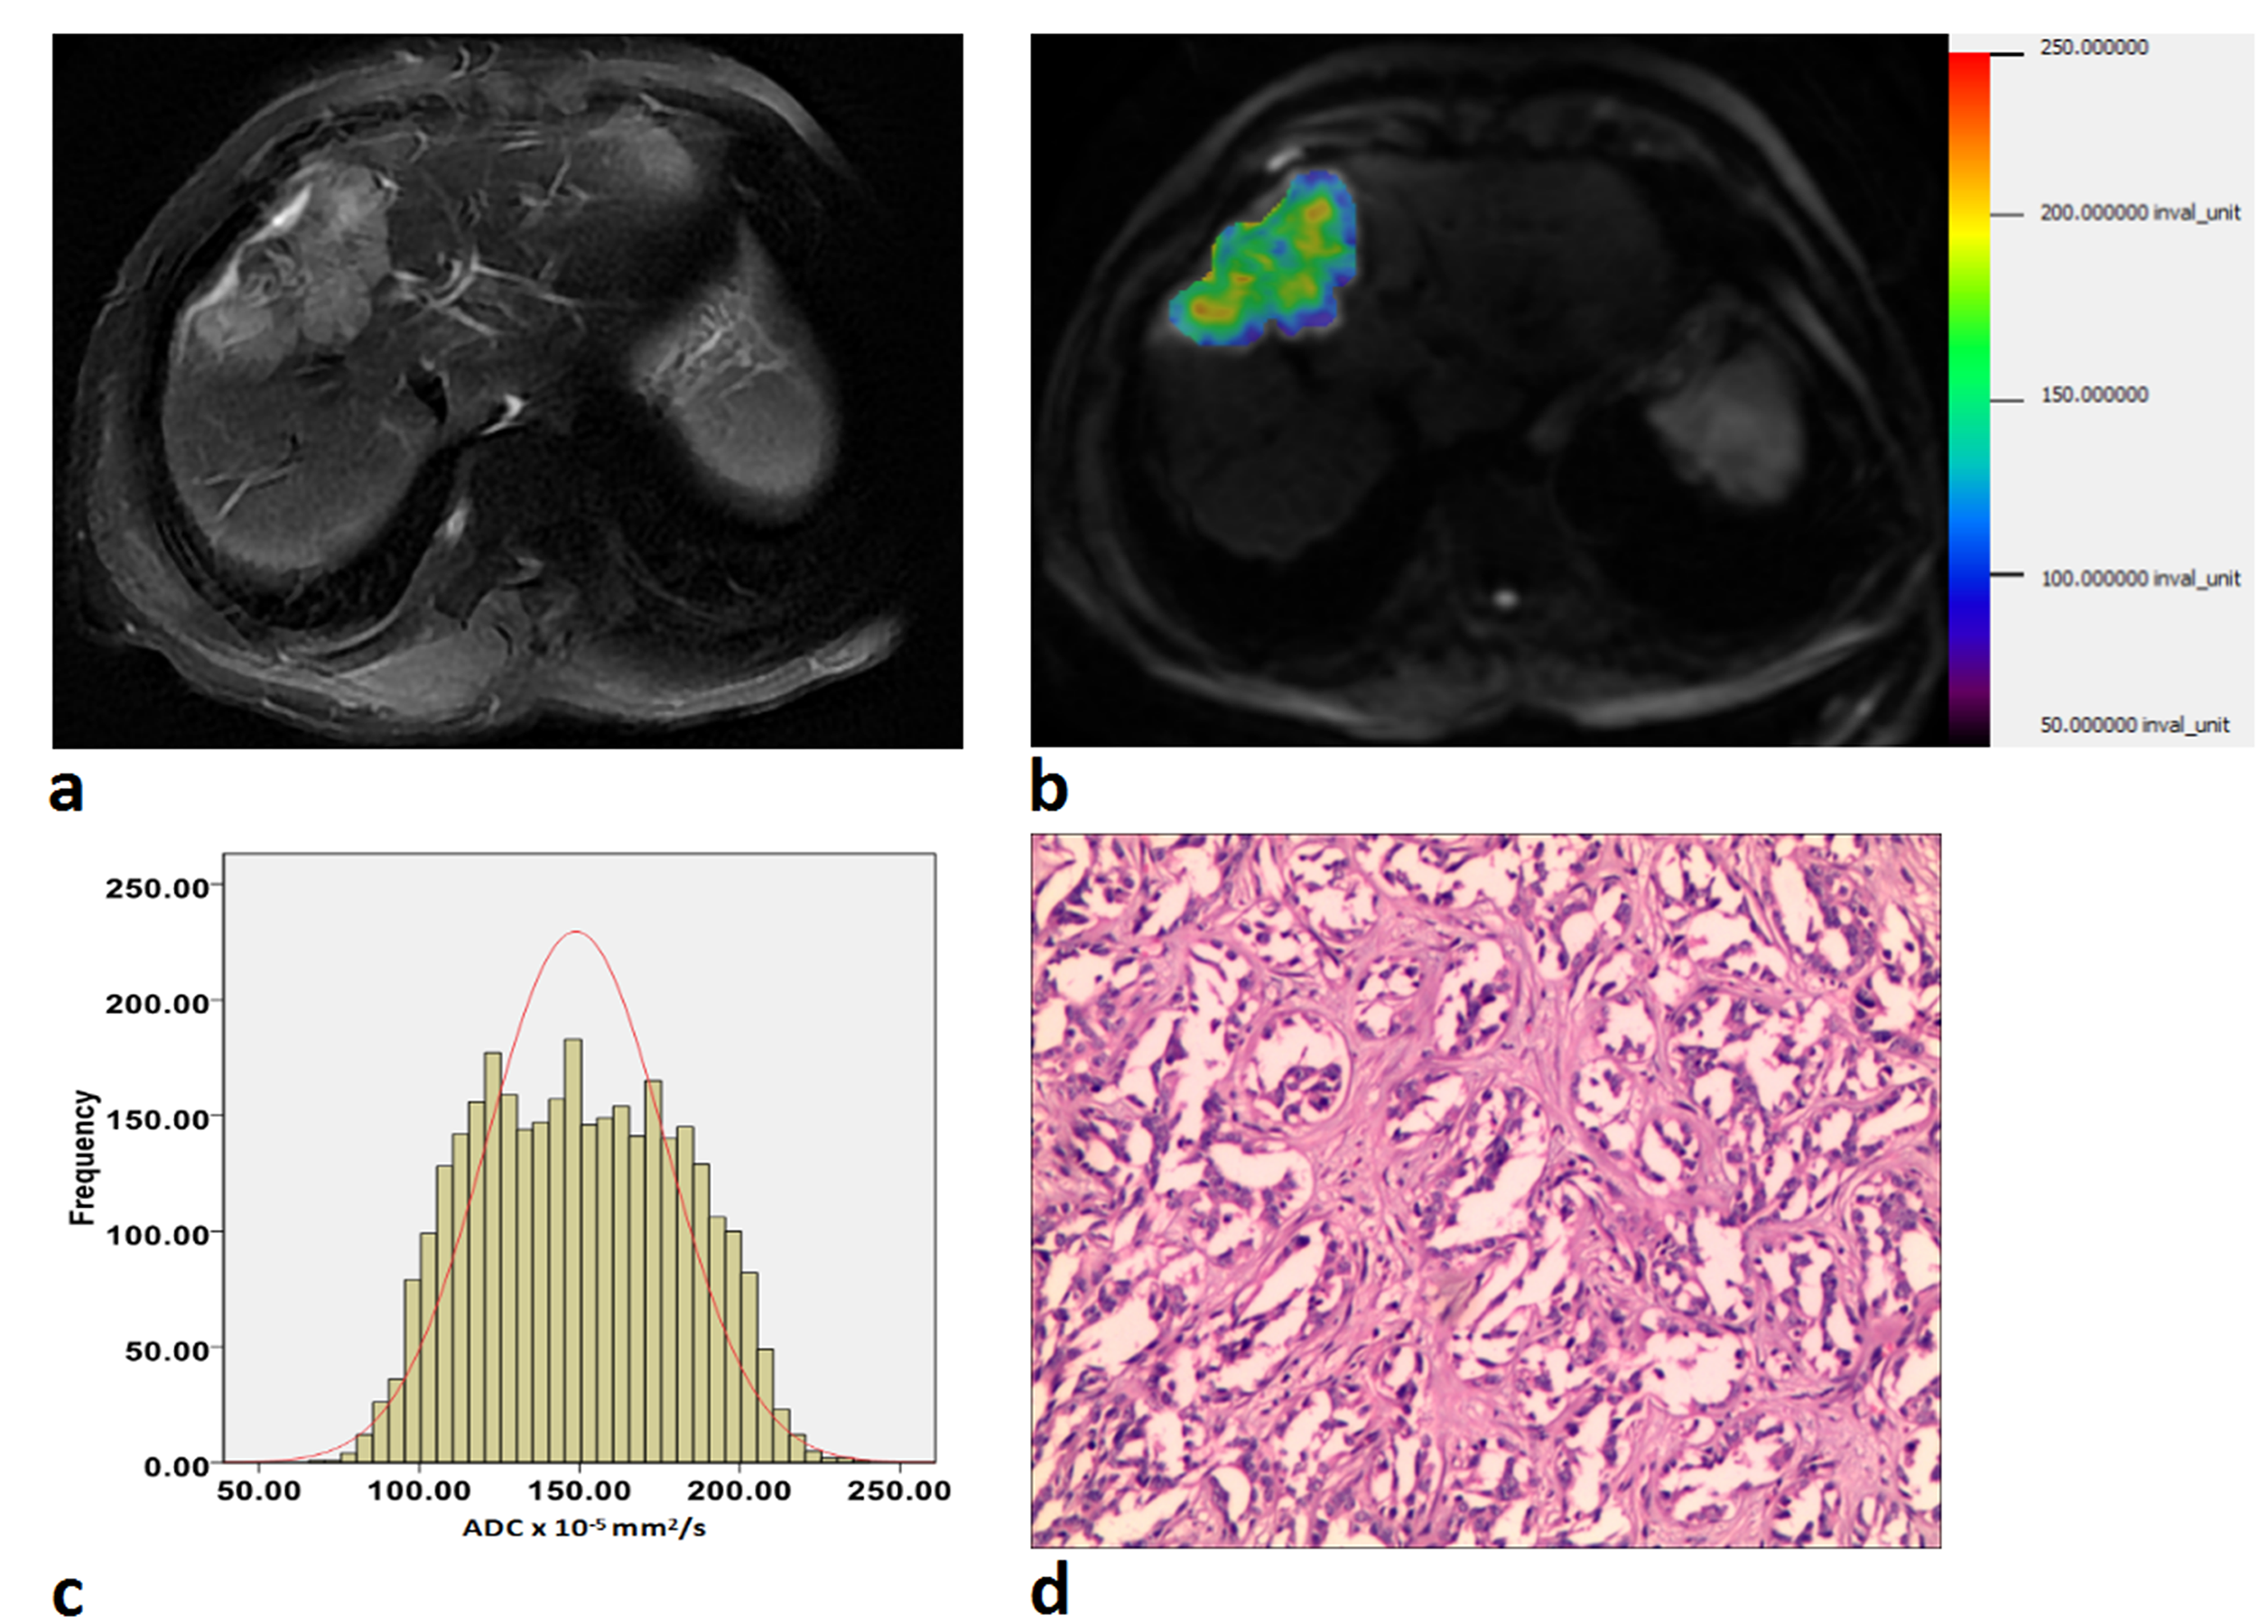
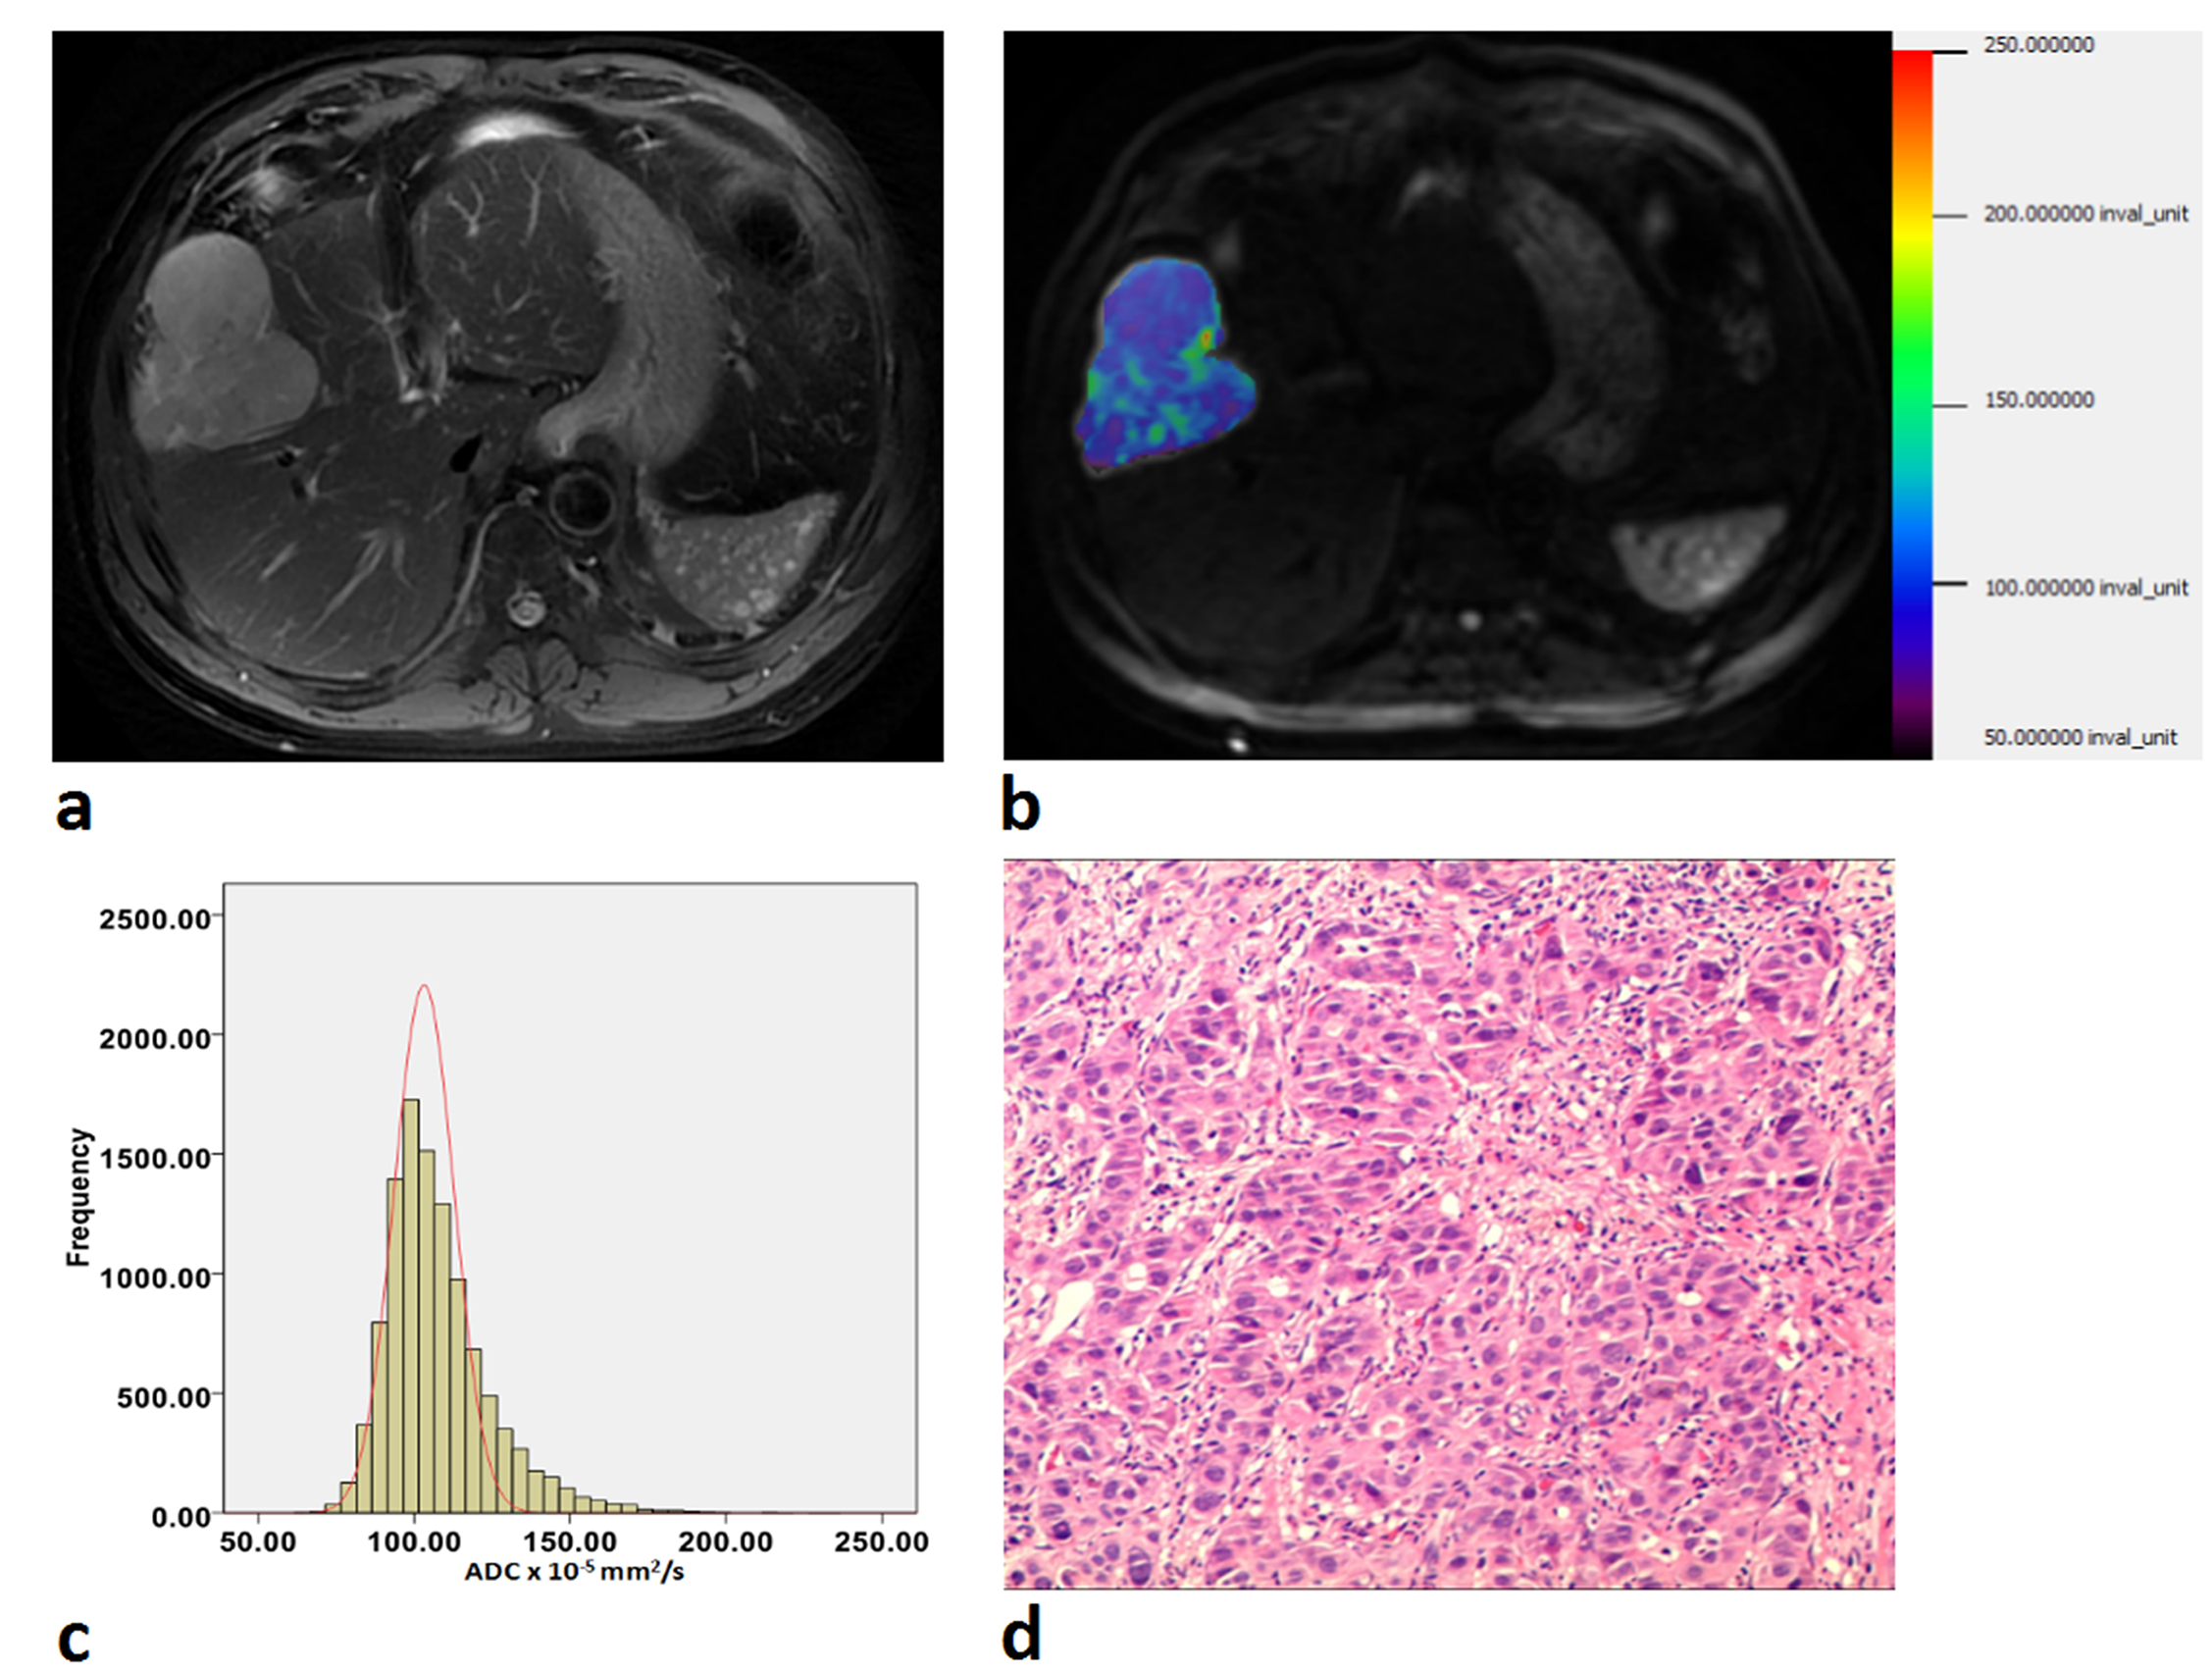
We retrospectively reviewed 131 pathology-proven cases (33 patients with IHCC and 98 patients with HCC), who underwent diffusion-weighted imaging (DWI) (b=0, 800 sec/mm2) at 3.0 Tesla MR Scanner. Volumetric ADC assessments were applied with FireVoxel (an open source software), and all quantitative histogram parameters were compared between IHCC group and HCC group. Receiver operating characteristic (ROC) curve analysis was used to determine and compare the diagnostic value of each parameter.Results
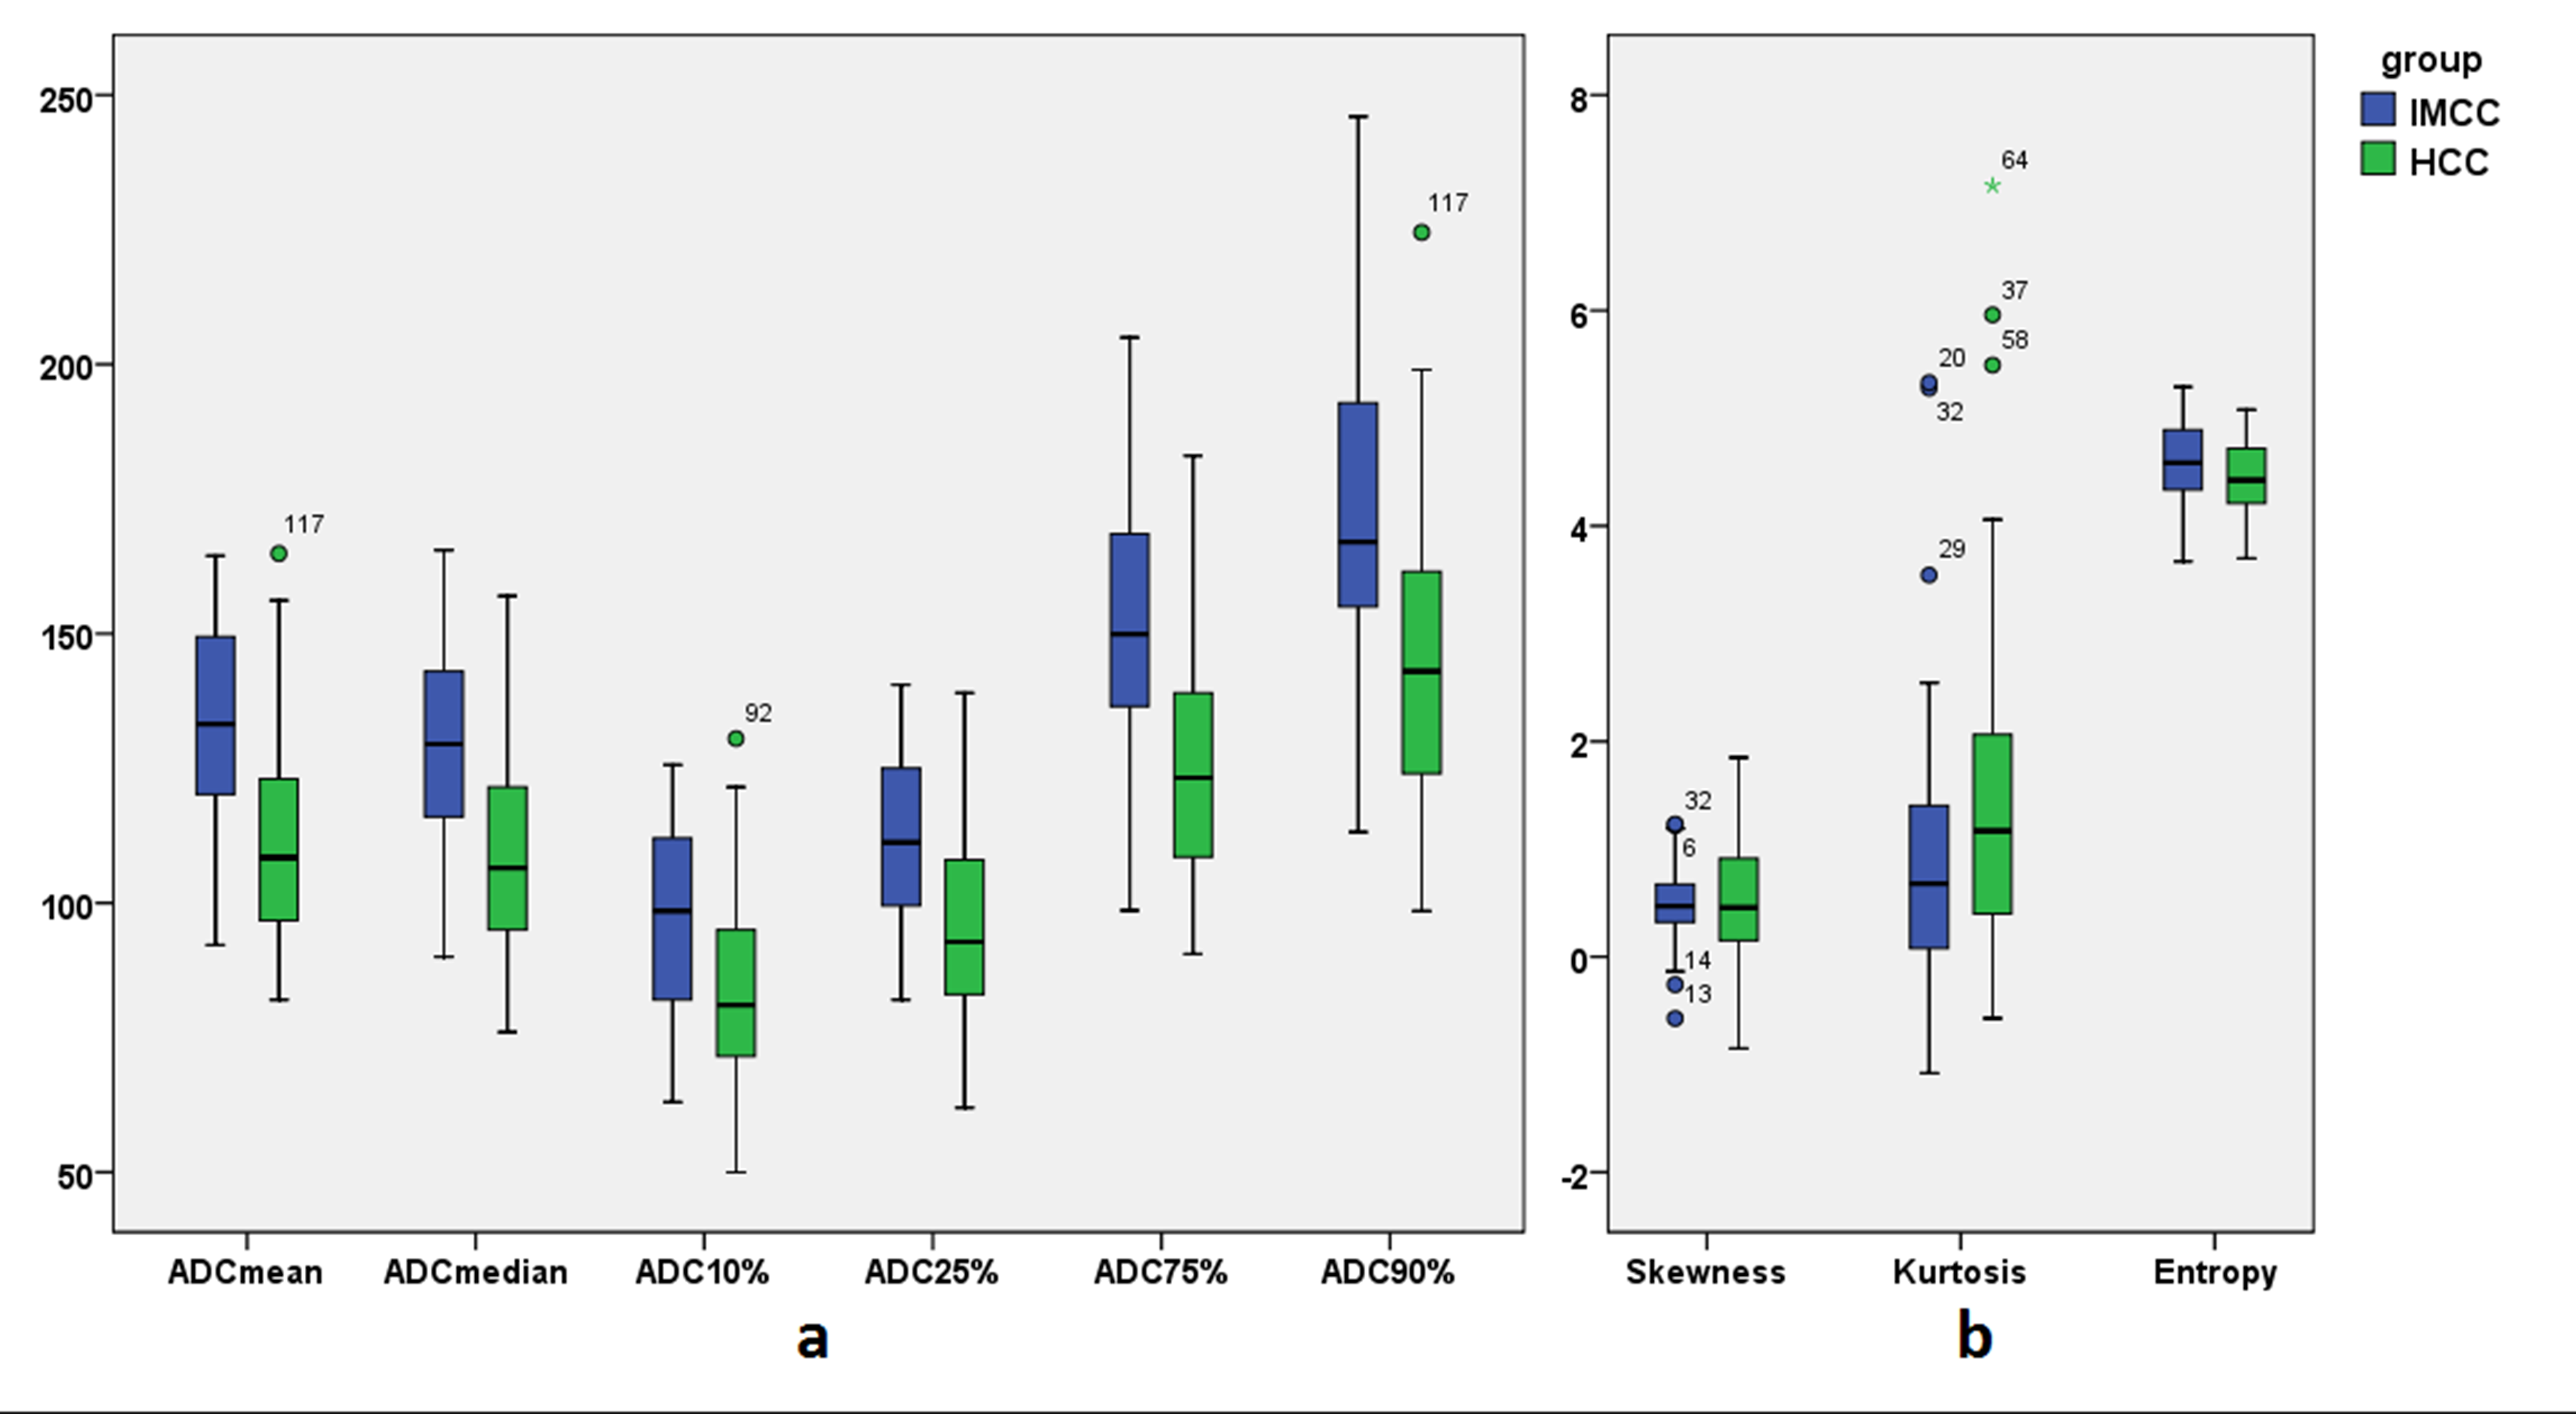
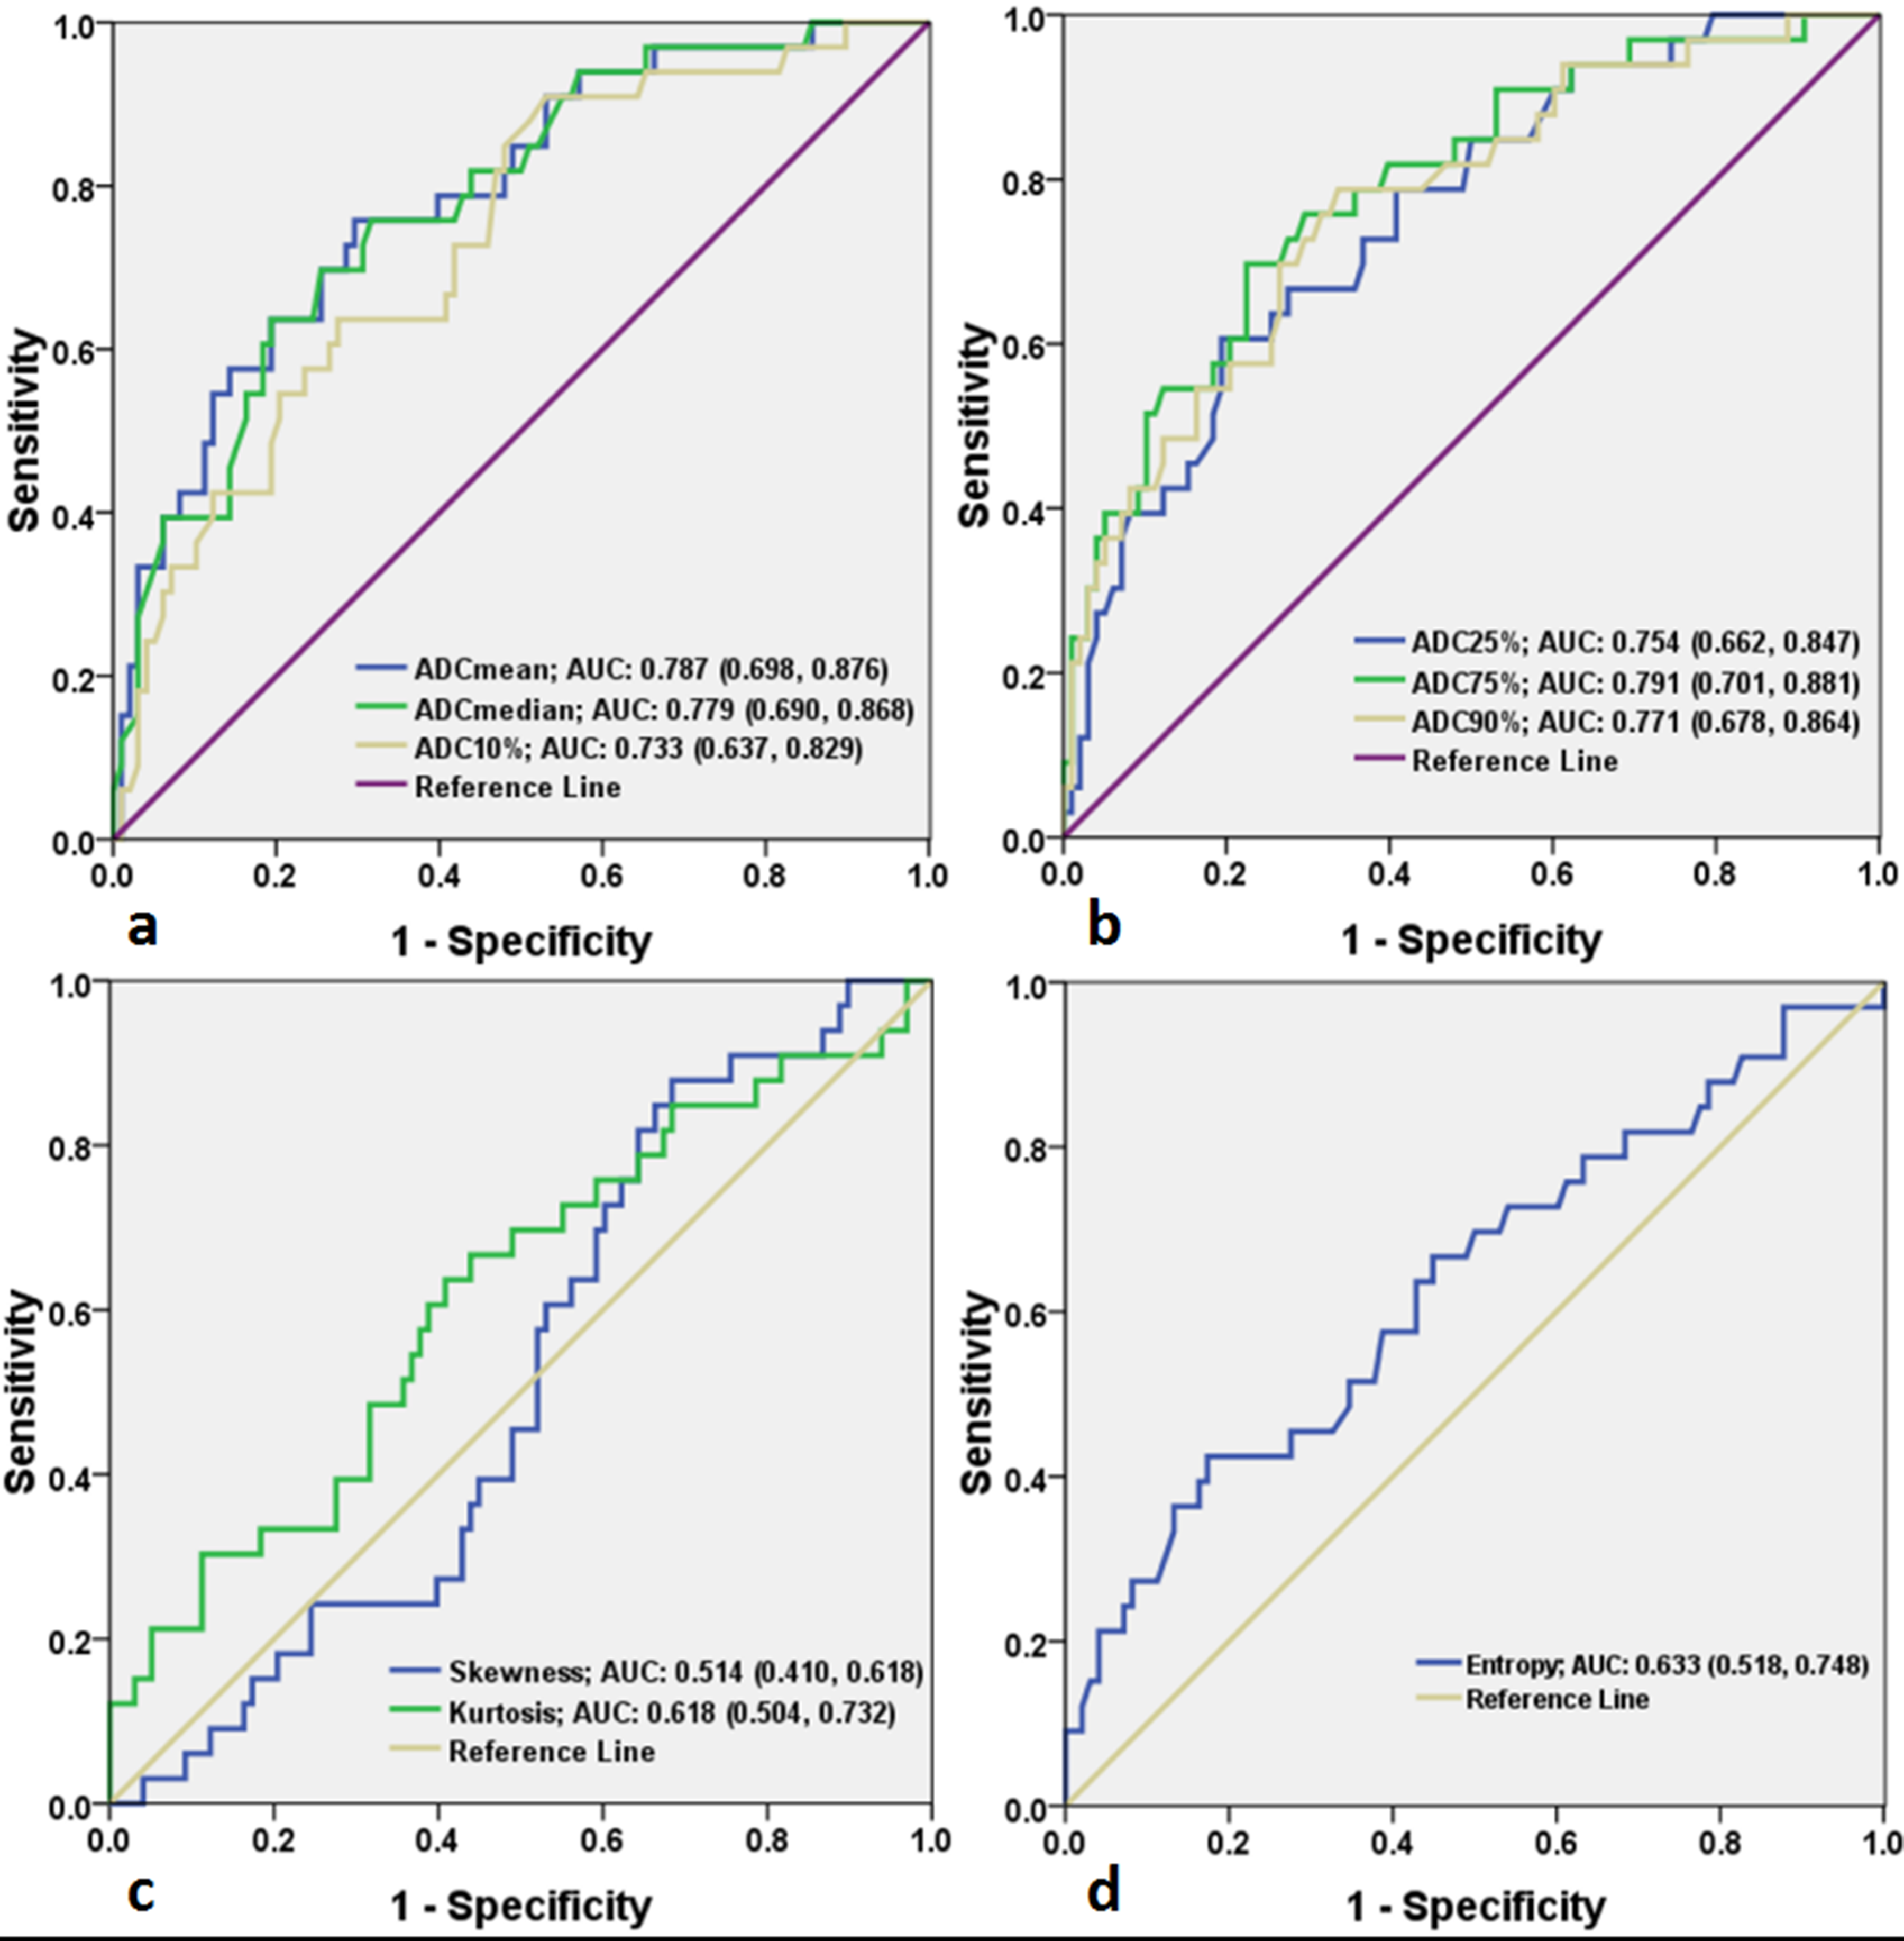
Compared to HCC group, IHCC group had higher mean ADC, median ADC, 10th percentile ADC, 25th percentile ADC, 75th percentile ADC, 90th percentile ADC and entropy values(P=0.000-0.016). The kurtosis of IHCC group was lower than that of HCC group with no statistical difference (P=0.108). No significant difference was observed in the skewness between IHCC and HCC (P=0.674). 75th percentile ADC generated the highest area under the ROC curve (AUC, 0.791) for differentiating IHCC from HCC with cut-off value of 141.25×10⁻⁵ mm2/s.Discussion
In present study, the preliminary data demonstrate that, except the kurtosis and skewness, all the volumetric ADC histogram parameters, were helpful in distinguishing IHCC from HCC. Among all the parameters, 75th percentile ADC was most helpful to distinguish the two diseases. The ADC values of IHCC were significantly higher than those of HCC. Histologically, the carcinoma cells of IHCC proliferate in a compact pattern in the peripheral areas, whereas they proliferate sparsely with abundant fibrous stroma in the central area,5 which results in large extracellular space and would yield high ADC values. Conversely, central fibrosis is rare in HCC, only occasionally found in rare scirrhous subtype HCCs. That’s why the ADC values of IHCC were higher than those of HCC. The distribution of ADC values of the whole lesion might reflect the histopathological features and we hypothesized that 75th percentile ADC of IHCC mainly representing the central area which was abundant of fibrous stroma.
The entropy represents a statistical measure of the ‘irregularities’ in a histogram, allowing describing the variation of a parameter of interest’s distribution. In this study, the entropy of IHCC was significantly higher than that of HCC, which may indicate that IHCC was more heterogeneous than HCC. We speculated that the abundant fibrous stroma, coagulative necrosis, mucin and other complex components within the tumor made IHCC more heterogeneous, resulting in a higher entropy.
Conclusion
Volumetric ADC histogram analysis might be considered as a useful and non-contrast method to help differentiate IHCC from HCC.Acknowledgements
No acknowledgement found.References
1. Bridgewater J, Galle PR, Khan SA, et al. Guidelines for the diagnosis and management of intrahepatic cholangiocarcinoma. J Hepatol. 2014; 60(6):1268-1289.
2. Choi SH, Lee SS, Kim SY, et al. Intrahepatic Cholangiocarcinoma in Patients with Cirrhosis: Differentiation from Hepatocellular Carcinoma by Using Gadoxetic Acid-enhanced MR Imaging and Dynamic CT. Radiology. 2017; 282(3):771-781.
3. Huang B, Wu L, Lu XY, et al. Small Intrahepatic Cholangiocarcinoma and Hepatocellular Carcinoma in Cirrhotic Livers May Share Similar Enhancement Patterns at Multiphase Dynamic MR Imaging. Radiology. 2016; 281(1):150-157.
4. McDonald RJ, McDonald JS, Kallmes DF, et al. Gadolinium Deposition in Human Brain Tissues after Contrast-enhanced MR Imaging in Adult Patients without Intracranial Abnormalities. Radiology. 2017; 285(2):546-554.
5. Lee J, Kim SH, Kang TW, Song KD, Choi D, Jang KT. Mass-forming Intrahepatic Cholangiocarcinoma: Diffusion-weighted Imaging as a Preoperative Prognostic Marker. Radiology. 2016; 281(1):119-128.
Figures