0075
Combined Gadoxetic Acid and Gadobenate Dimeglumine Enhanced Liver MRI for Liver Metastasis Detection: A Parameter Optimization Study1Department of Radiology, University of Wisconsin – School of Medicine and Public Health, Madison, WI, United States, 2Department of Biomedical Engineering, University of Wisconsin – School of Medicine and Public Health, Madison, WI, United States, 3Department of Medical Physics, University of Wisconsin – School of Medicine and Public Health, Madison, WI, United States, 4Department of Medicine, University of Wisconsin – School of Medicine and Public Health, Madison, WI, United States, 5Department of Emergency Medicine, University of Wisconsin – School of Medicine and Public Health, Madison, WI, United States
Synopsis
The detection of small perivascular metastatic lesions can be challenging with gadoxetic acid-enhanced liver MRI because both, blood vessels and metastases appear hypointense during the hepatobiliary phase. We sought to demonstrate the feasibility of combined gadoxetic acid (GA)/gadobenate dimeglumine (GD) liver MRI for improved lesion detection and optimize the imaging protocol regarding GA-dosing, imaging time after GD-injection and flip angle. Preliminary results show a homogenously enhanced liver and vasculature (“plain-white-liver”) 1-3min after GD-bolus detection with optimal contrast using flip angles of 25-35°. The combined GA/GD protocol has potential to improve the diagnostic performance of hepatobiliary phase liver MRI.
Introduction
The detection of small perivascular metastatic lesions can be challenging with gadoxetic acid (GA) enhanced liver MRI because both, blood vessels and lesions appear hypointense during the hepatobiliary phase. The combined use of delayed phase GA-enhanced MRI and gadofosveset trisodium (GT) has previously been shown to improve the detection of liver metastases by creating a homogeneously hyperintense parenchyma and vasculature (“plain-white-liver”) (1). However, GT has been withdrawn from the market. We aimed to demonstrate the feasibility of combined GA and gadobenate dimeglumine (GD) liver MRI as an off-label use for improved lesion detection and to optimize the imaging protocol regarding GA-dosing, imaging time after GD-injection and optimal flip angle (FA) for best image contrast.
Methods
Twelve healthy volunteers (6:6 M:F; 31±11.5 years, 75±12.1kg) were included in this prospective IRB-approved, HIPAA-compliant feasibility study. Subjects underwent two visits, separated by ≥4 weeks. MR-imaging was performed at 3.0T (Discovery MR 750, GE Healthcare, Waukesha, WI) using a 32-channel torso coil (Neocoil, Pewaukee, WI). At each visit, subjects underwent two consecutive injections: 1) GA (Visit 1=0.025mmol/kg; Visit 2=0.05mmol/kg) and 2) GD (both visits=0.1 mmol/kg) 20 minutes after GA administration.
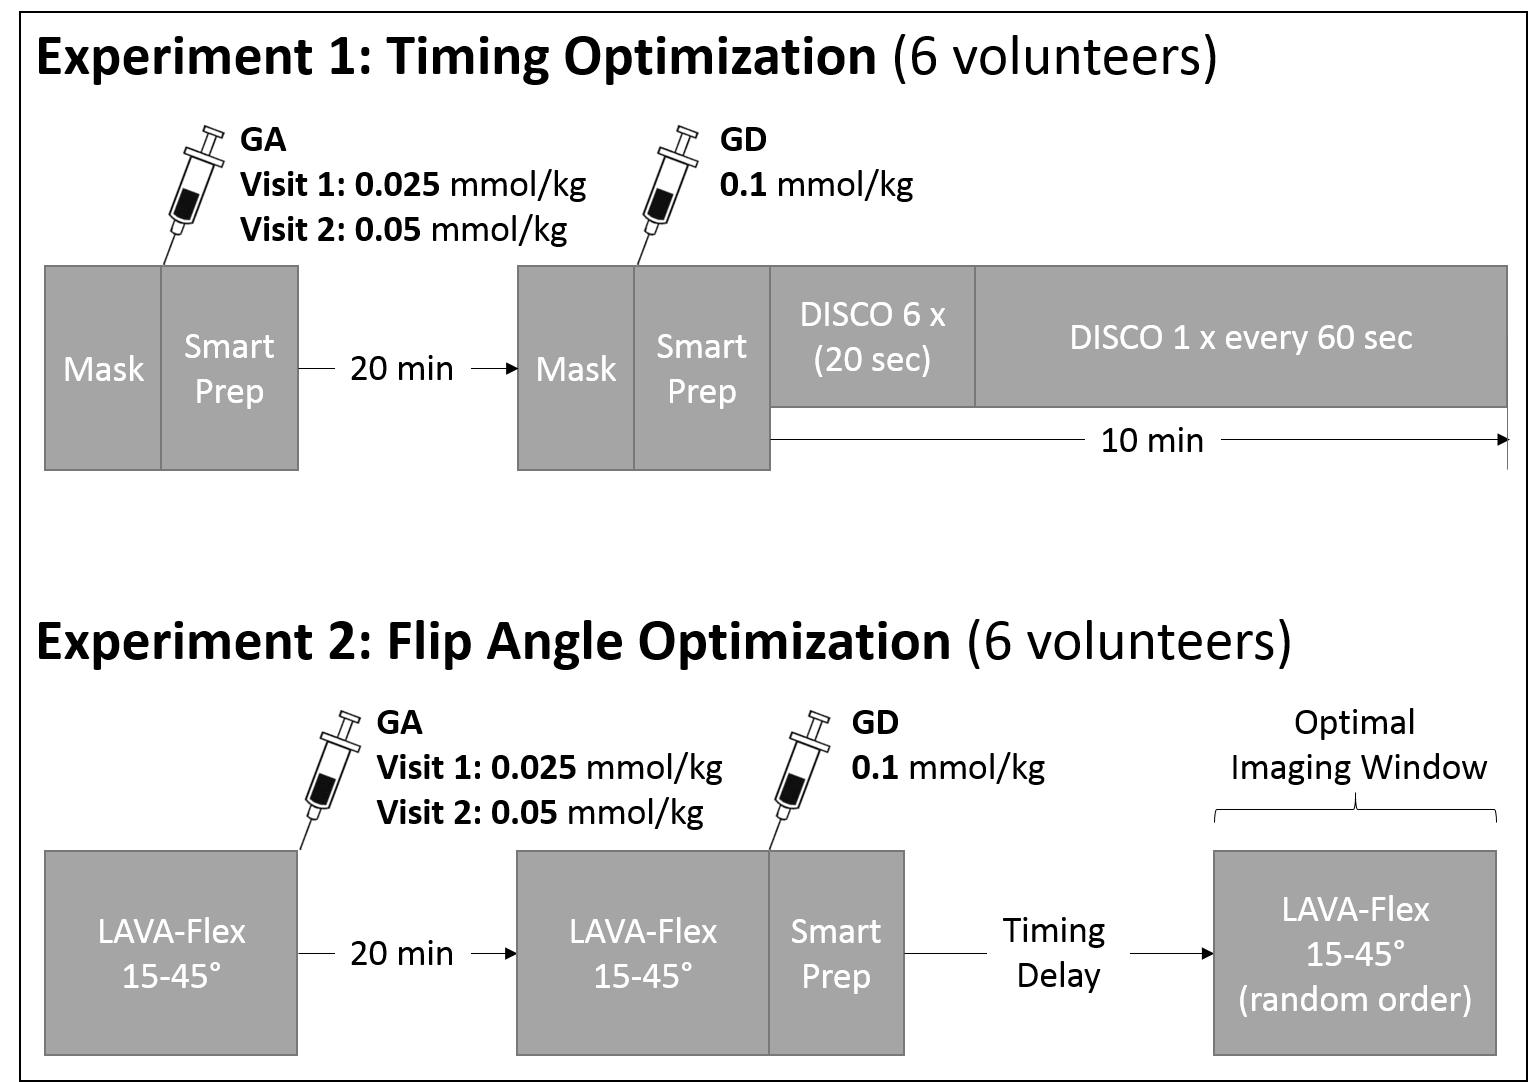
Two sub-studies were performed (see Figure 1):
Experiment 1 (Timing optimization): To determine the optimal imaging window with the least possible contrast between liver and hepatic vessels, the first six subjects underwent multi-phase liver MRI using a breath-held 3D-fat-saturated T1-weighted GRE sequence (DIfferential Subsampling with Cartesian Ordering; DISCO: TR=3.88ms; TE=1.67ms; FA=15°; matrix=320x256; FOV=44x35.2cm; slice thickness=4mm; slice-spacing=2mm; number of slices=16; bandwidth=166.6kHz) over 10 minutes after GD-bolus detection in the right heart (SmartPrep). Relative signal-to-noise (SNRrel) and contrast-to-noise (CNRrel) measurements of the liver and vasculature were performed. Muscle signal after GA was used as the reference tissue.
Experiment 2 (FA optimization): A breath-held 3D-fat-saturated T1-weighted GRE sequence (LAVA-Flex: TR=5.44ms; TE=2.0ms; matrix=256x192; FOV=40x32; slice thickness=8mm; number of slices=16; bandwidth=166.6kHz) was used in the remaining six subjects as a series of five FA (15°, 25°, 30°, 35°, 45°). No parallel imaging was used to facilitate absolute SNR and CNR measurements.
Imaging was performed before GA-injection, 20 minutes after GA-injection, and during the optimal imaging window (determined from Experiment 1) that yielded an isointense signal in the liver and vasculature. Absolute SNR(abs) and CNR(abs) was measured from images with GA alone and GA/GD to determine which FA maximized liver signal, while minimizing contrast between liver and vessels and maximizing contrast between liver and muscle. Muscle was used as a surrogate for liver lesions of non-hepatocyte origin (2-4).
Results
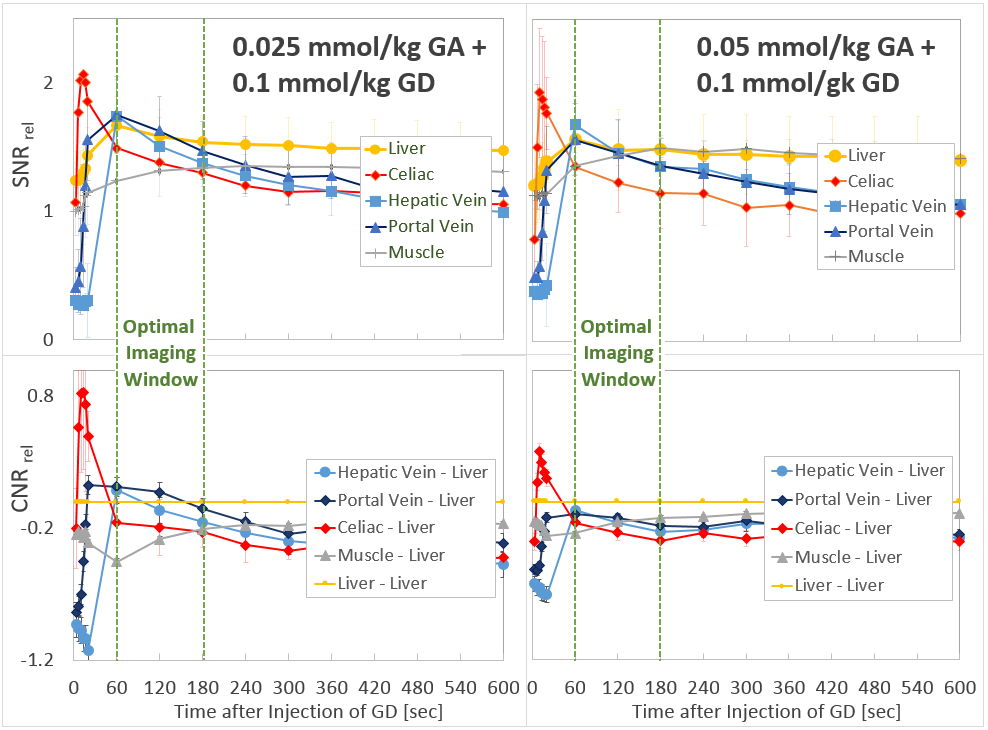
Experiment 1: As shown in Figure 2, dynamic imaging between 60-180 seconds after automatic GD-bolus detection resulted in increased intravascular signal with a minimum SNRrel and CNRrel difference between liver and hepatic vessels while producing maximum CNRrel between liver and muscle. A GA dose of 0.05 mmol/kg did not significantly increase SNRrel of the liver compared to 0.025mmol/kg, while the higher GA-dose slightly increased CNRrel between liver and vessels and slightly decreased CNRrel between liver and muscle.
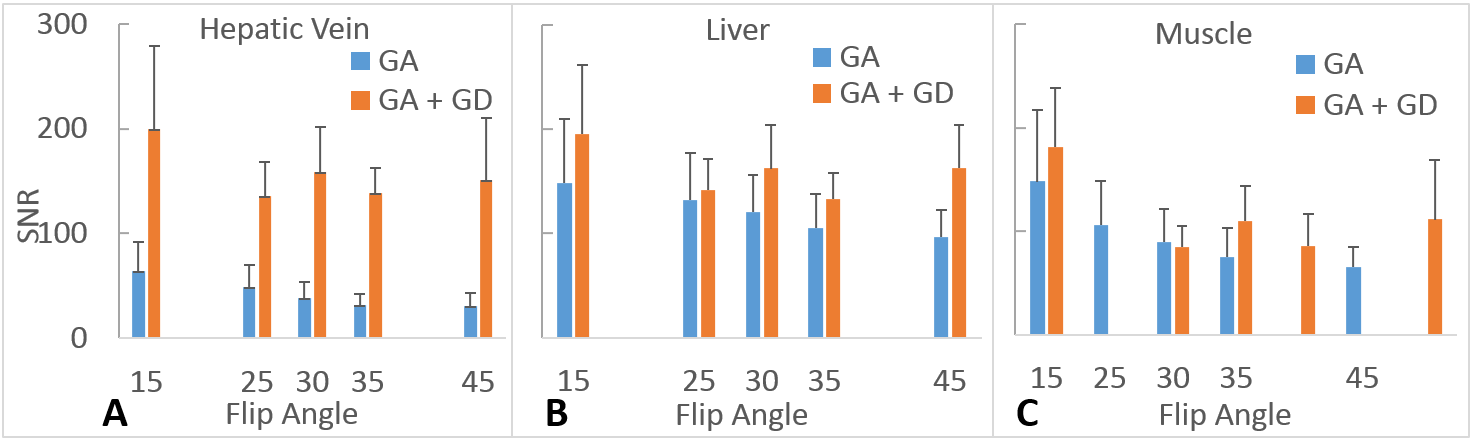
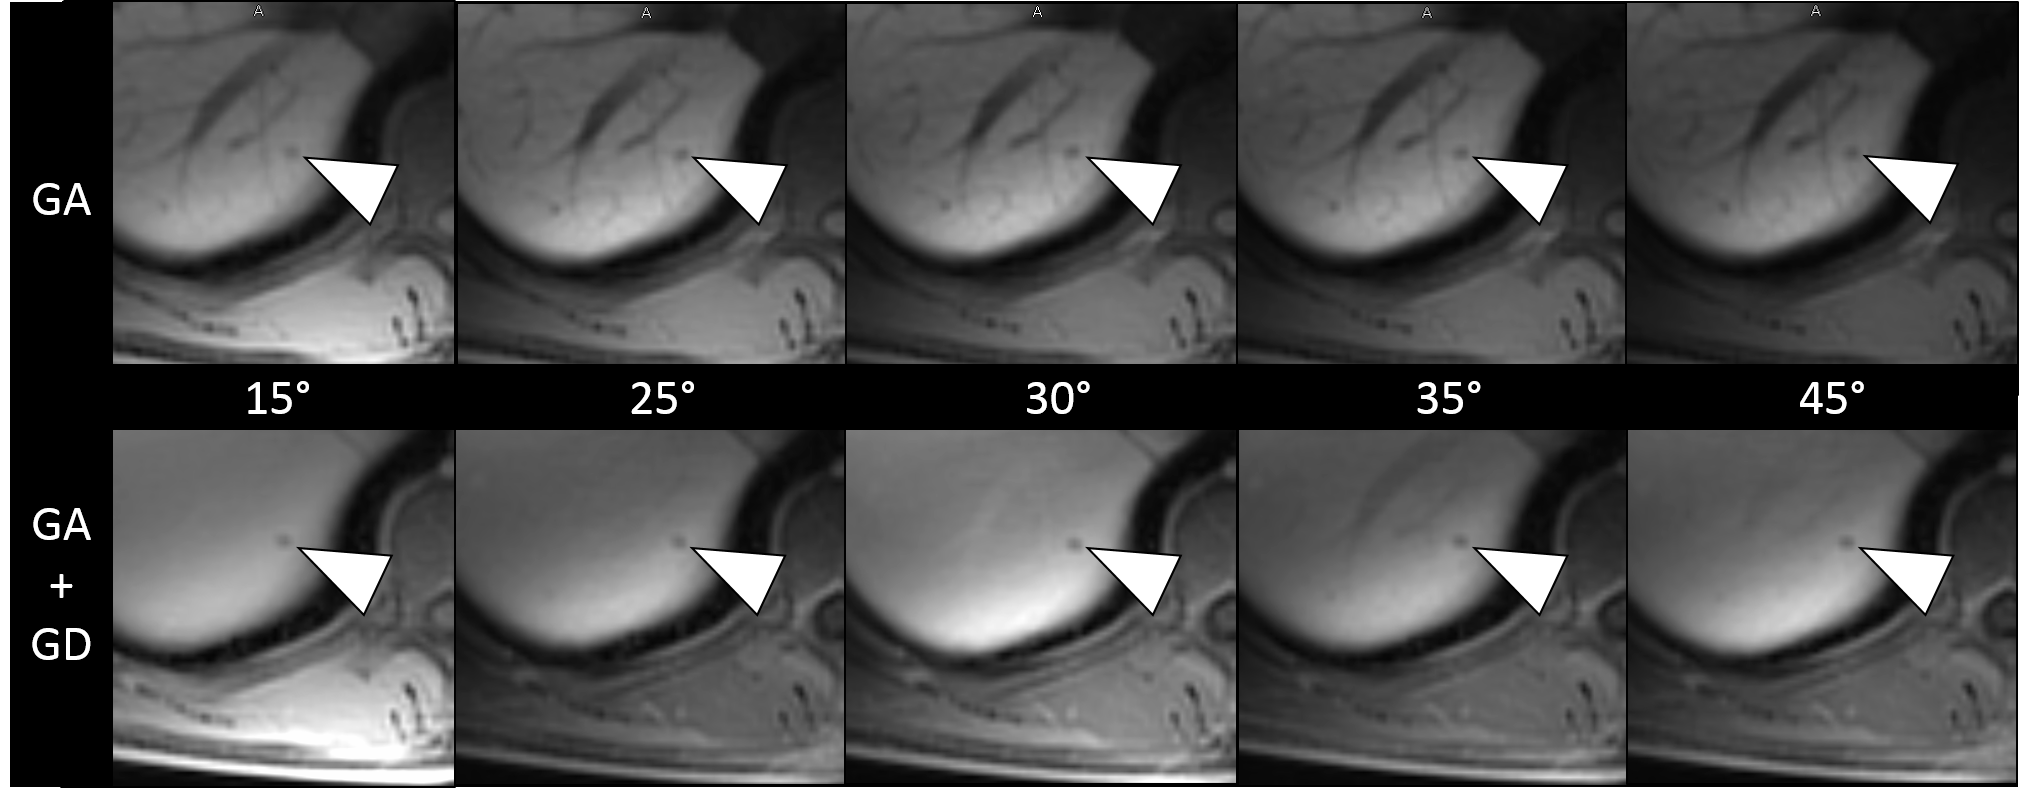
Experiment 2: (Preliminary results from six subjects with 0.025 mmol/kg GA only.) Images acquired 60-180 seconds after detection of the GD-bolus with the combined GA/GD protocol resulted in homogenously enhanced liver parenchyma and vasculature with significantly increased vascular SNRabs across flip angles (p≤0.001) (Figure 3). Only a non-significant increase in SNRabs was observed in liver and muscle across flip angles. The CNRabs between liver and hepatic vessels decreased significantly to almost zero with the GA/GD protocol (p≤0.05), particularly using FA between 15-35°. Maximum CNRabs between liver and muscle was observed at a FA of 25° (Figure 4). Representative image examples of GA alone and combined GA/GD liver MRI are shown in Figure 5.
Discussion
Combined GA/GD enhanced T1-weighted MRI to achieve a “plain-white-liver” is feasible when images are acquired 60-180 seconds after GD-bolus detection in the right heart. A GA-dose of 0.025 mmol/kg and flip angles between 25-35° are optimal to minimize the conspicuity of blood vessels while ensuring adequate contrast between liver and muscle, which was used as a surrogate for nonenhancing liver lesions (2-4). Consequently, the visual impression of a homogeneously hyperintense liver is expected to improve the conspicuity of small hypointense liver lesions. Our preliminary results are consistent with those reported by Bannas et al. who demonstrated improved detection of liver metastases (1, 5) using a combined GA/GT protocol. Due to the market withdrawal of GT, the combined GA/GD protocol may provide a viable alternative. Further clinical studies are needed to confirm that the GD-timing and FA parameters suggested in this study can improve the sensitivity of liver lesion detection in patients.
Acknowledgements
This project was supported by the Departments of Radiology and Medical Physics, at the University of Wisconsin. The authors also wish to acknowledge support from GE Healthcare and Bracco Diagnostics who provide research support to the University of Wisconsin. Further, we also wish to acknowledge support from the NIH (K24 DK102595).
Tilman Schubert contributed to this work while employed by UW-Madison but is now an employee of the Department of Radiology, University Hospital Bern, Switzerland.
References
1. Bannas P, Bookwalter CA, Ziemlewicz T, et al. Combined gadoxetic acid and gadofosveset enhanced liver MRI for detection and characterization of liver metastases. Eur Radiol. 2017;27(1):32-40.
2. Frydrychowicz A, Nagle SK, D'Souza SL, et al. Optimized high-resolution contrast-enhanced hepatobiliary imaging at 3 tesla: a cross-over comparison of gadobenate dimeglumine and gadoxetic acid. J Magn Reson Imaging. 2011;34(3):585-94.
3. Nagle SK, Busse RF, Brau AC, et al. High resolution navigated three-dimensional T(1)-weighted hepatobiliary MRI using gadoxetic acid optimized for 1.5 Tesla. J Magn Reson Imaging. 2012;36(4):890-9.
4. Runge VM. A comparison of two MR hepatobiliary gadolinium chelates: Gd-BOPTA and Gd-EOB-DTPA. J Comput Assist Tomogr. 1998;22(4):643-50.
5. Bannas P, Motosugi U, Hernando D, et al. Combined gadoxetic acid and gadofosveset enhanced liver MRI: A feasibility and parameter optimization study. Magn Reson Med. 2016;75(1):318-28.
Figures