0067
Measuring human placental blood flow with multi-delay 3D GRASE pseudo-continuous arterial spin labeling at 3 Tesla1Laboratory of FMRI Technology (LOFT), Mark & Mary Stevens Neuroimaging and Informatics Institute, Keck School of Medicine, University of Southern California, Los Angeles, CA, United States, 2Department of Radiology, David Geffen School of Medicine at UCLA, Los Angeles, CA, United States, 3Department of Pediatrics, David Geffen School of Medicine at UCLA, Los Angeles, CA, United States, 4Department of Obstetrics and Gynecology, Division of Maternal Fetal Medicine, David Geffen School of Medicine at UCLA, Los Angeles, CA, United States
Synopsis
Placenta influences the health of both a woman and her fetus during pregnancy. Maternal blood supply to placenta can be measured non-invasively using arterial spin labeling (ASL). The purpose of this study is to present a multi-delay pseudo-continuous arterial spin labeling (pCASL) combined with a fast 3D inner-volume gradient- and spin-echo (GRASE) imaging technique to simultaneously measure placental blood flow (PBF) and arterial transit time (ATT), and to study PBF and ATT evolution with gestational age during the second trimester. The PBF values were compared with uterine arterial Doppler ultrasound to assess its potential clinical utility.
Background
Placenta supports the pregnancy by providing the developing fetus with nutrients and oxygen via maternal blood supply. Pathological development of the utero-placental unit or defective trophoblastic invasion, which can lead to intrauterine growth restriction (IUGR) and Pre-eclampsia (PE), increases the resistance to blood flow, and restricts placental perfusion.
The purpose of this study was to present a multi-delay pseudo-continuous artierial spin labeling (pCASL) sequence, which is capable of selectively labeling maternal feeding aorta, combined with a fast 3D inner-volume Gradient-and Spin Echo (GRASE) imaging technique for non-invasive and simultaneous assessment of placental blood flow (PBF) and arterial transit time (ATT) in pregnant women.
Methods
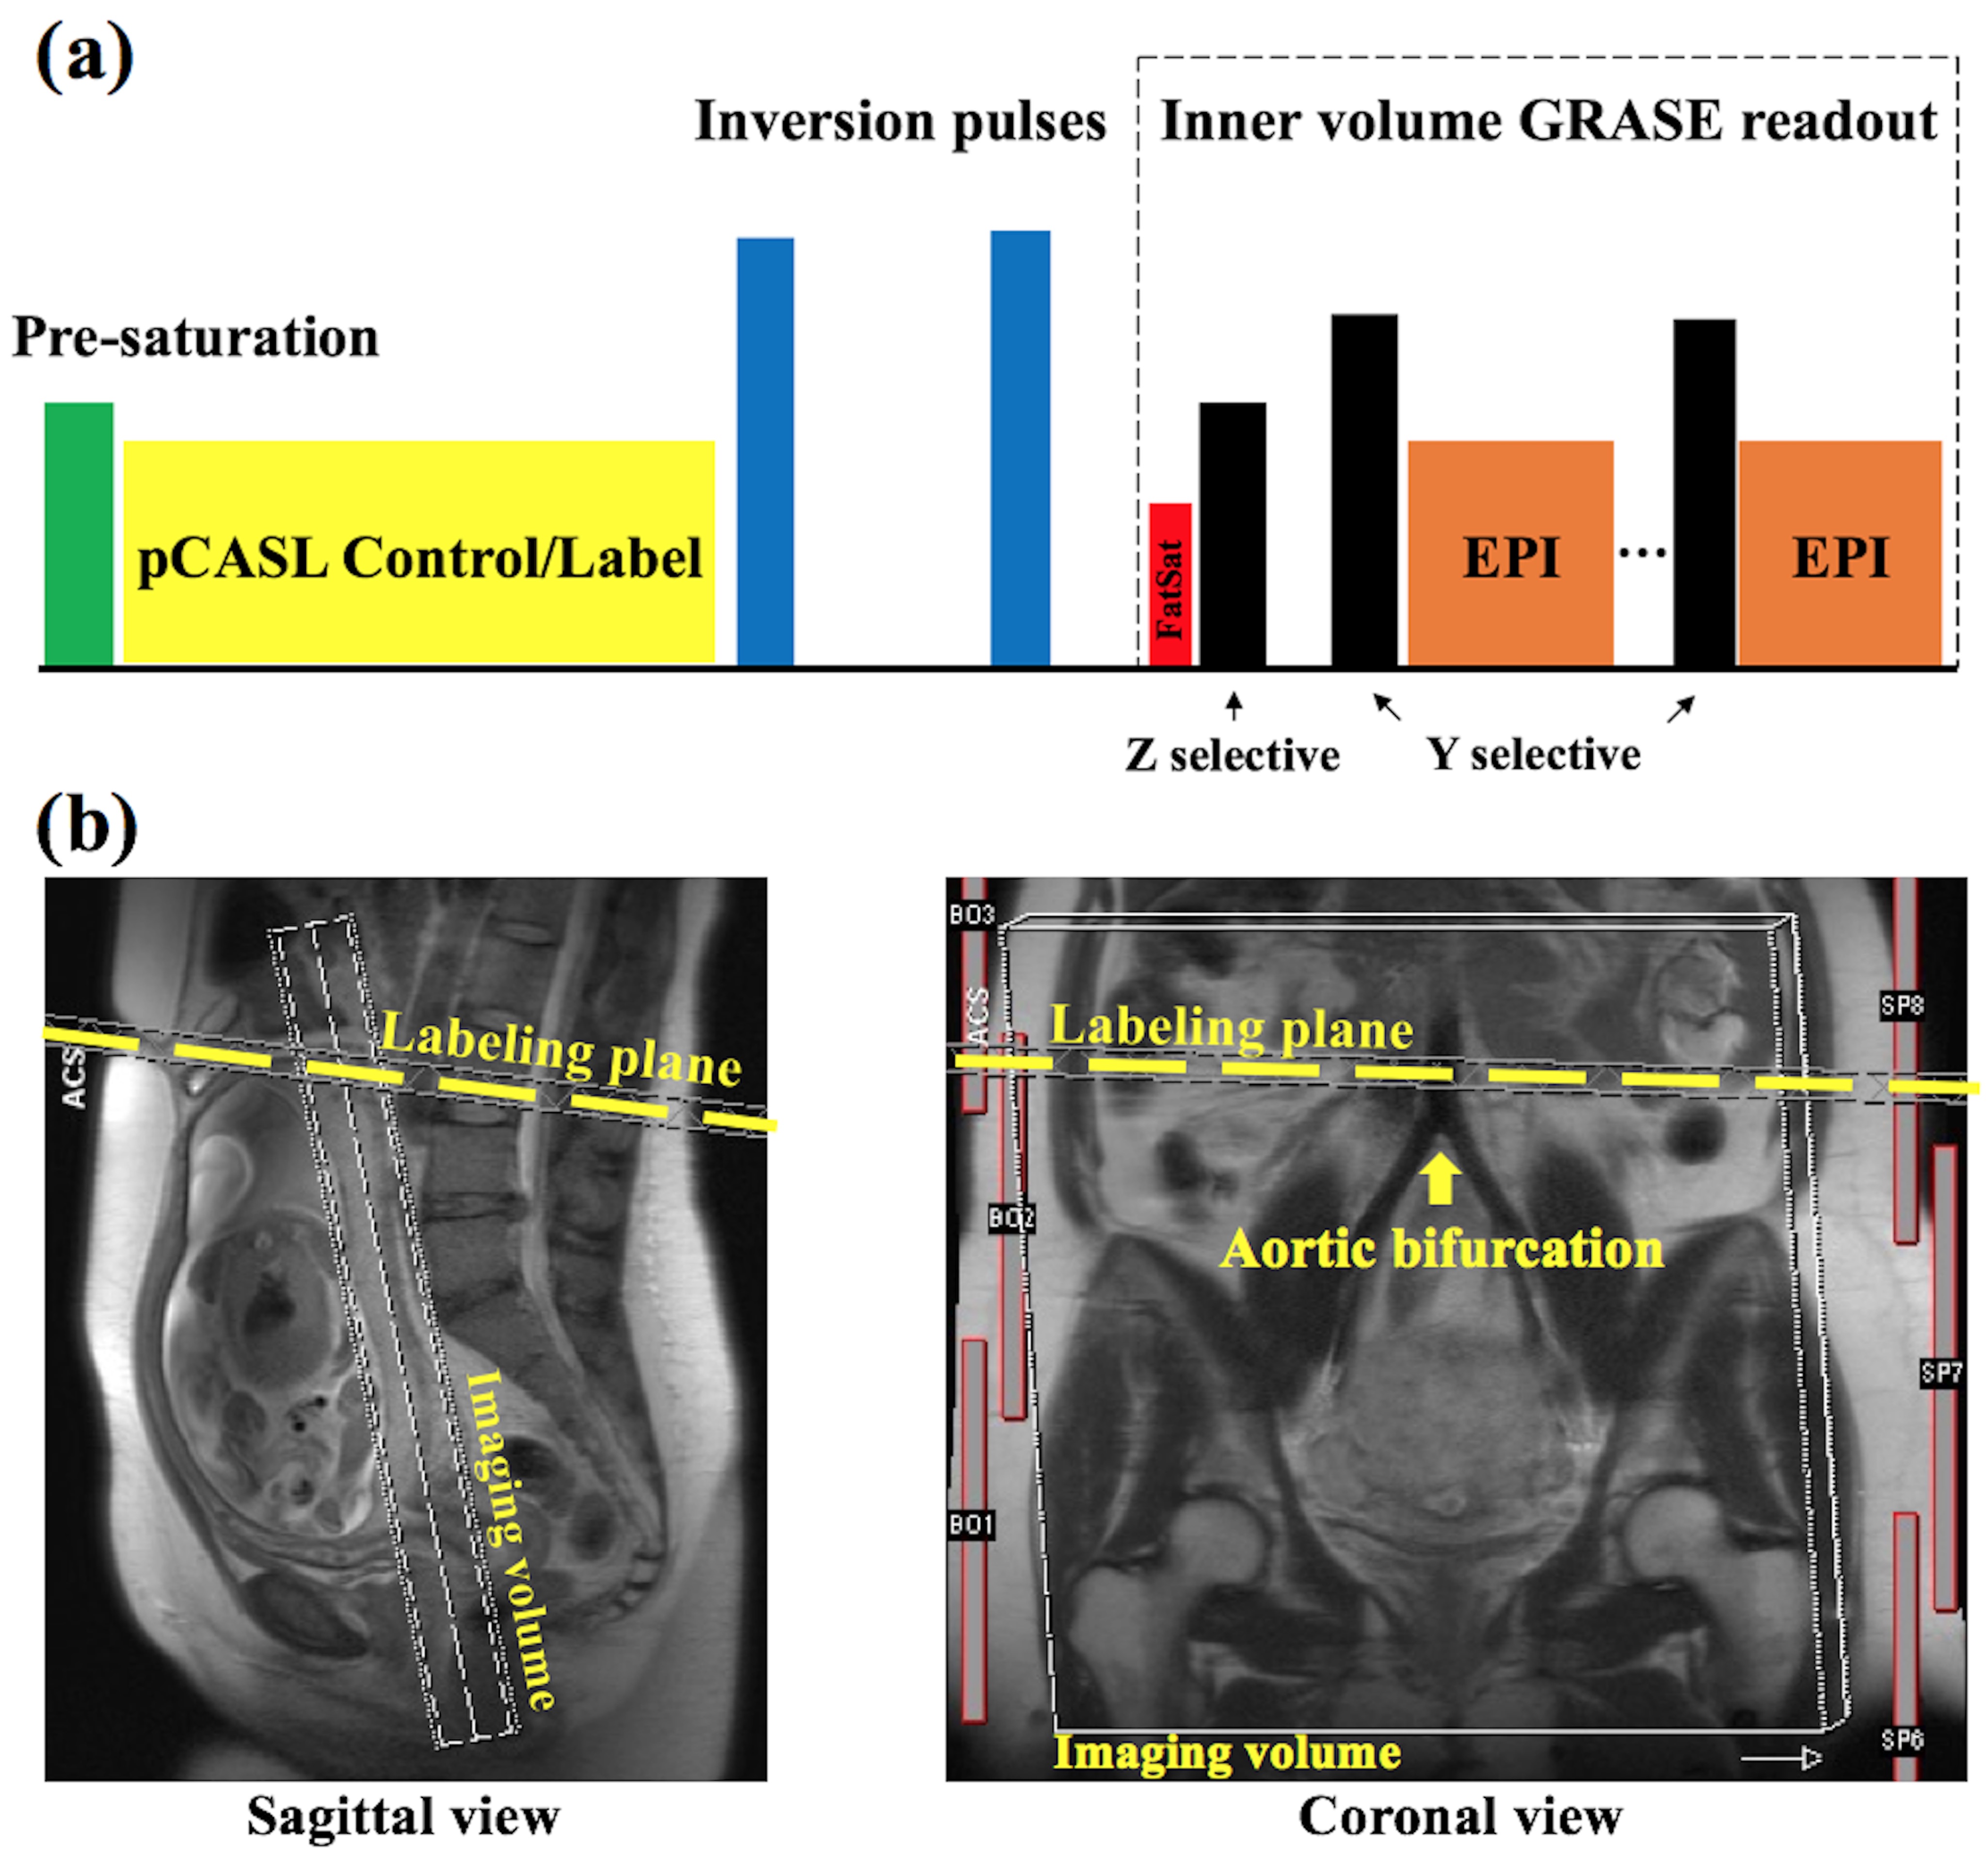
Figure 1 (a) shows the diagram of pCASL GRASE sequence. Background suppression was applied to minimize temporal fluctuations.1 Inner-volume excitation was achieved by switching the slice-selective gradient to phase encoding axis for re-focusing pulses,2 which enables single-shot readout to cover the whole placenta. The imaging volume was selected as perpendicular to the maternal-fetal axis, and the labeling plane was placed proximal perpendicular to the abdominal aorta and above the aortic bifurcation (Fig. 1b).
34 normal pregnant women (32.6±4.5yrs) were scanned on Siemens 3T scanners (Prisma and Skyra). Each subject was scanned twice within the second trimester (first/second scans were conducted between 14-16/19-22 weeks of gestational age). Imaging parameters were: FOV=300mm, eight slices (20% oversampling), single shot, resolution=3.1×3.1×3mm3, echo spacing=0.49ms, TE=36.5ms, TR=4000ms, label/control duration=1500ms, PLD=1000/1500/2000ms, each PLD contained 14 repetitions and one $$$M_0$$$ scan (2min4sec). Global specific absorption rate (SAR) was monitored for RF heating.
Pixel-wise PBF was estimated by:3
$$f=\frac{\Delta M\lambda R_{1a} }{2\alpha M_0[exp((min(\delta -w,0)-\delta)R_{1a})-exp(-(\tau +w)R_{1a})]}$$[1]
where $$$\Delta M$$$ is the perfusion signal, $$$M_0$$$ is the equilibrium magnetization, $$$f$$$ is blood flow, $$$\alpha$$$=0.63 is the labeling efficiency at the aortic bifurcation (vessel center velocity=11.5 cm/s) estimated by the numerical integration,4 $$$\lambda$$$=1ml/g is tissue water partition coefficient,5 $$$w$$$ is PLD, $$$\tau$$$ is labeling duration, $$$R_{1a}$$$=1/1660ms-1 is the longitudinal relaxation rate of blood, $$$\delta$$$ is ATT, which was calculated based on a monotonic relationship with weighted delay (WD):6
$$WD=\frac{\sum_{i=1}^Nw_i\Delta M_i}{\sum_{i=1}^N\Delta M_i}$$[2]
where $$$N$$$=3. $$$f_i$$$ was calculated for each PLD, and averaged to produce the final PBF. Repeated scans from 34 subjects were analyzed for PBF and ATT variations with placental development.
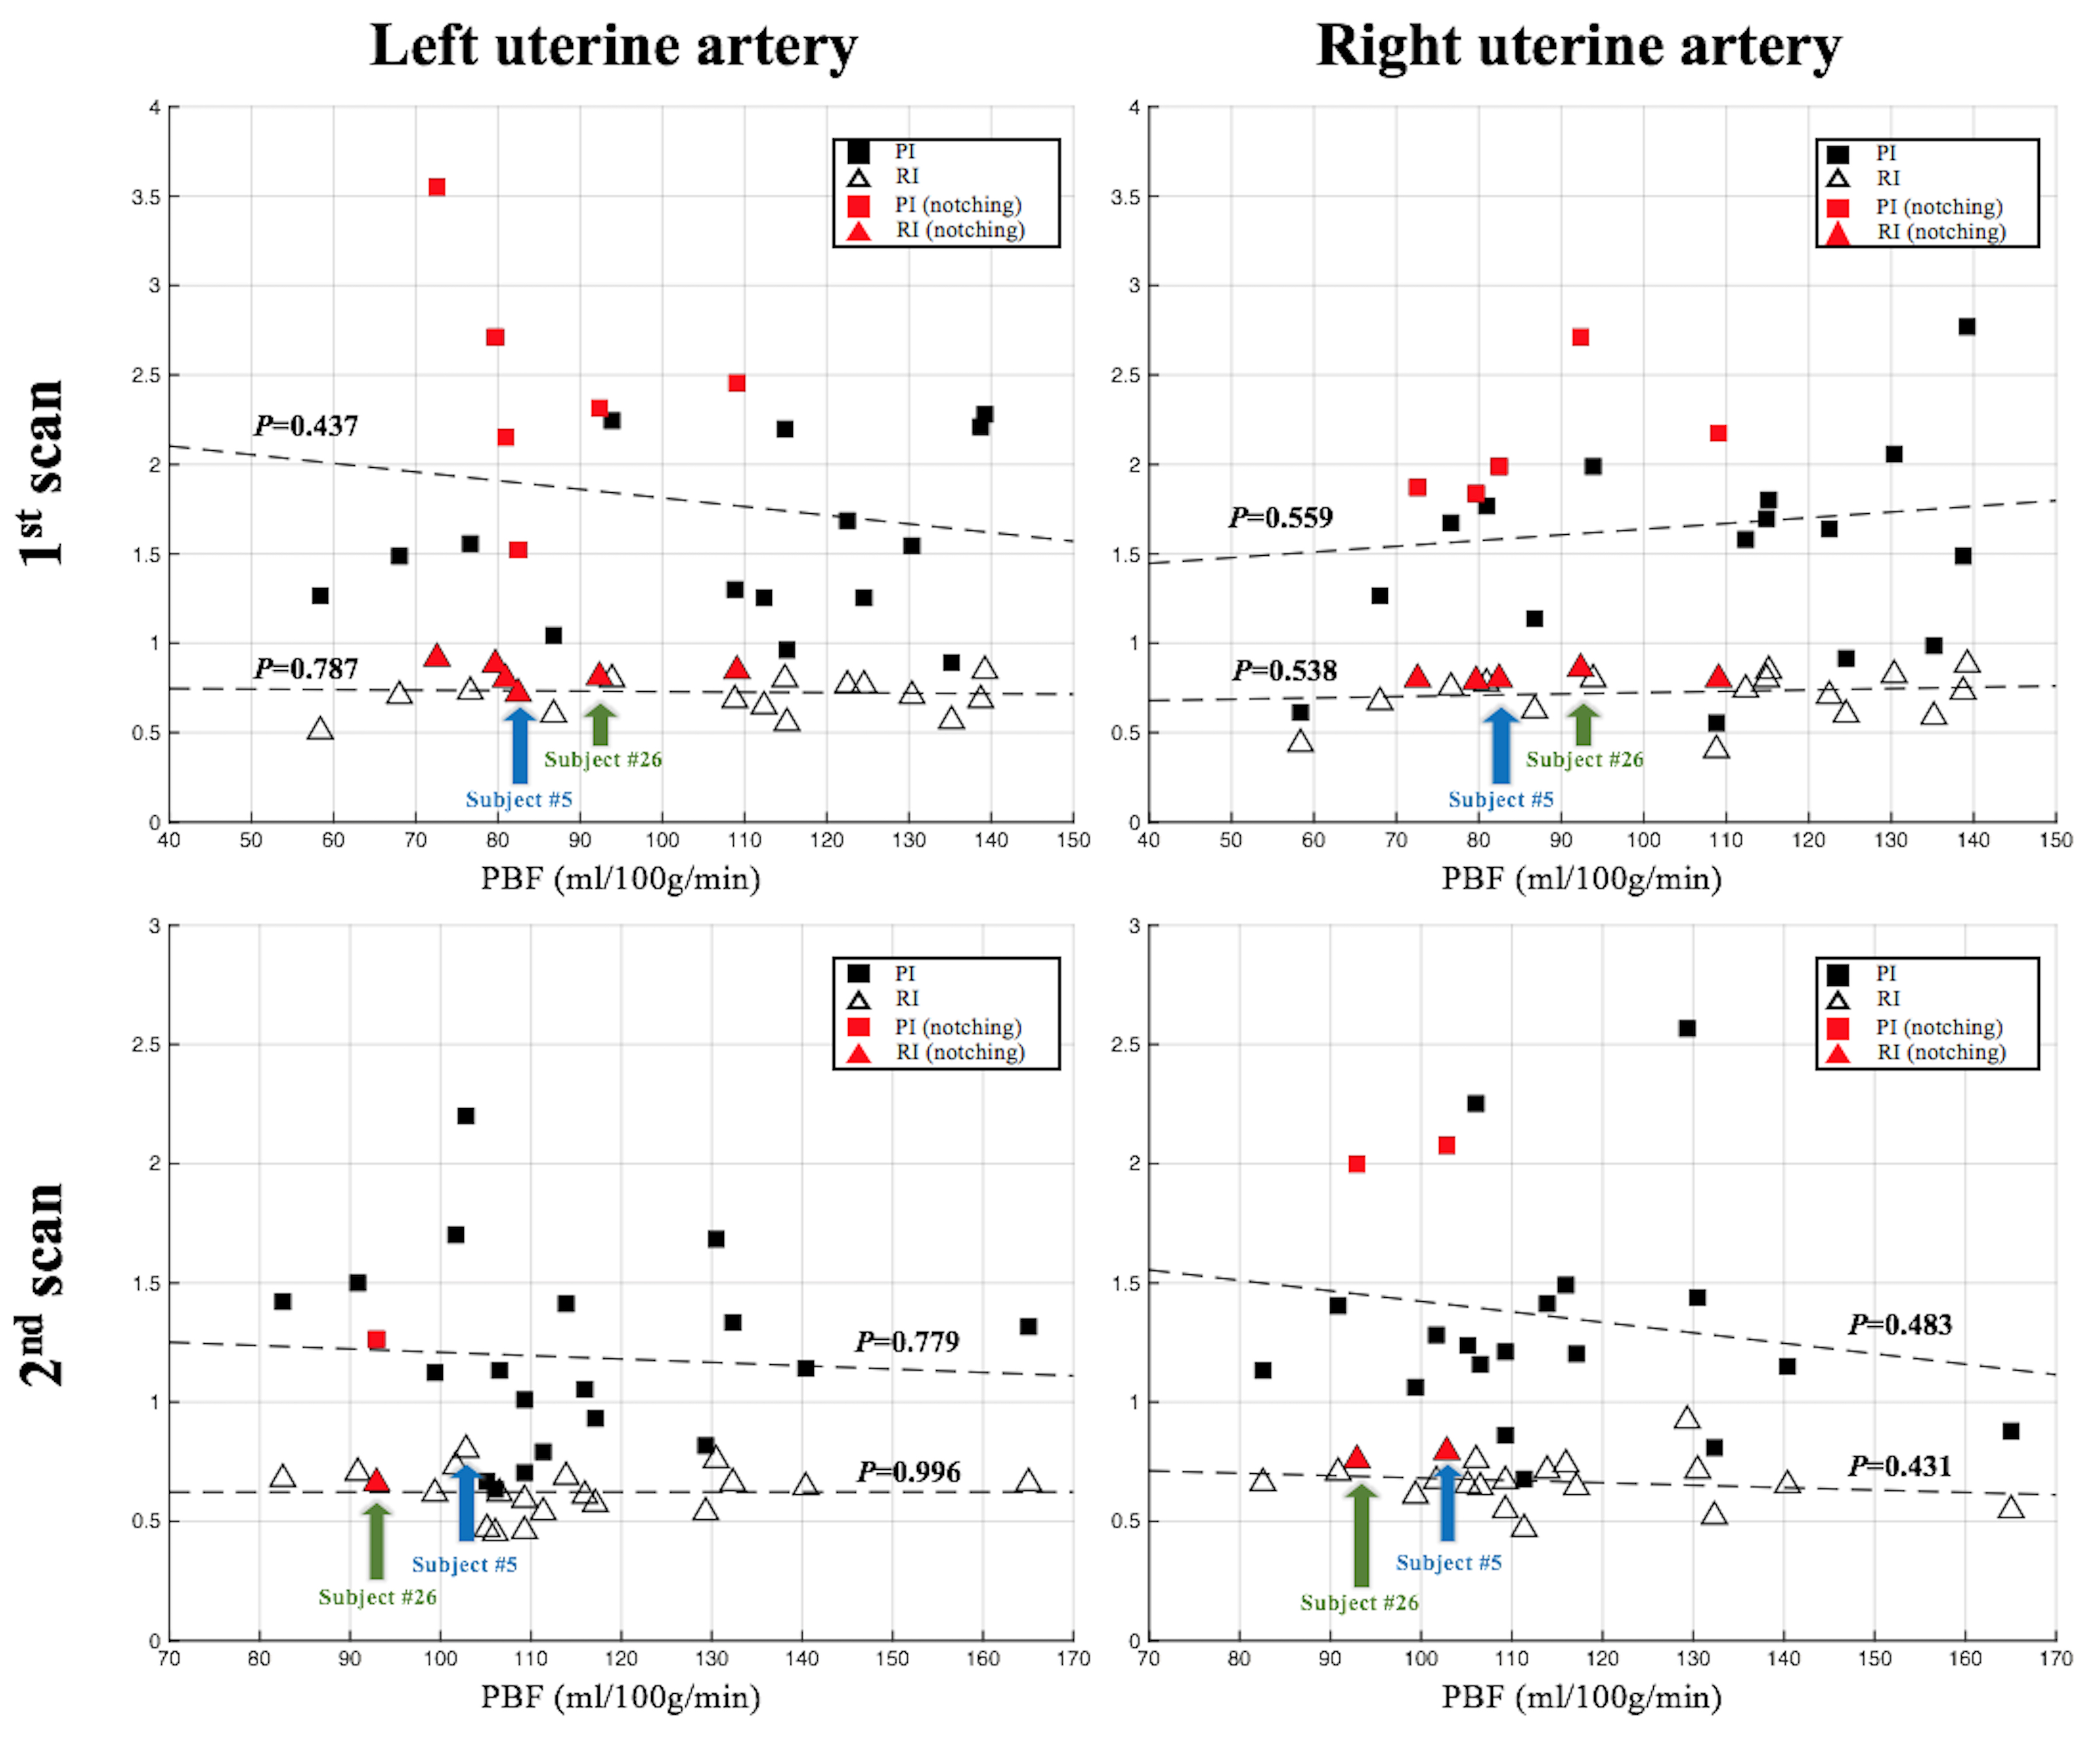
The PBF values were compared with ultrasound measurement to assess its potential clinical utility. Uterine arterial Doppler ultrasound was collected from 21/20 subjects after the first/second MRI scans (16 subjects had ultrasound after both MRI scans). RI (resistive index), PI (pulsatility index), and notching at early diastole were measured on both sides of uterine arteries. Poor placental perfusion is typically indicated by increased RI, PI or the persistence of an early diastolic notch in uterine blood flow waveform pattern.
Paired t-test was conducted to evaluate the significance of PBF/ATT variations with placental development. RI and PI were correlated with average PBF using linear regression. Two-sample t-test was conducted to evaluate the significance of PBF difference in subjects with and without early diastolic notch.
Results and discussion
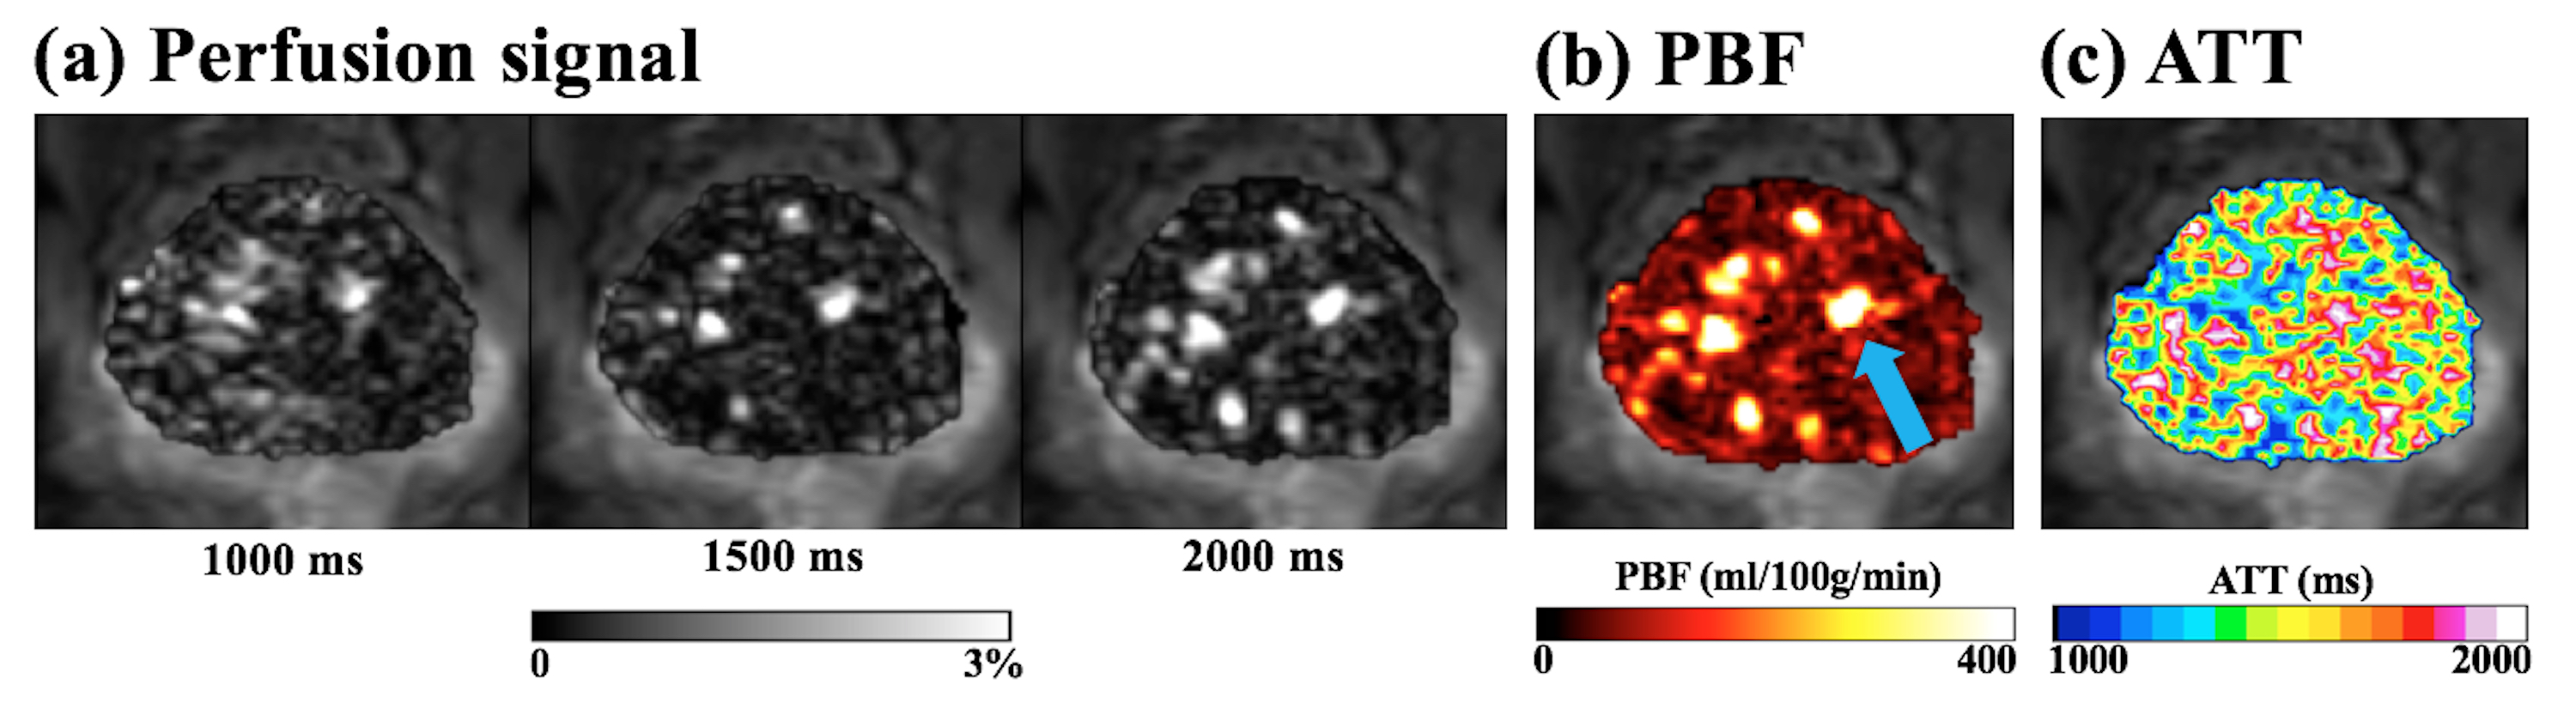
Figure 2 shows perfusion images, PBF and ATT maps. With perfusion signals acquired at three delay times, it is feasible to perform dynamic analysis of regions of interest to better understand how labeled blood passes through the placenta. The global SAR was averaged to be 1.19±0.23 W/kg, about 60% of normal mode limit.
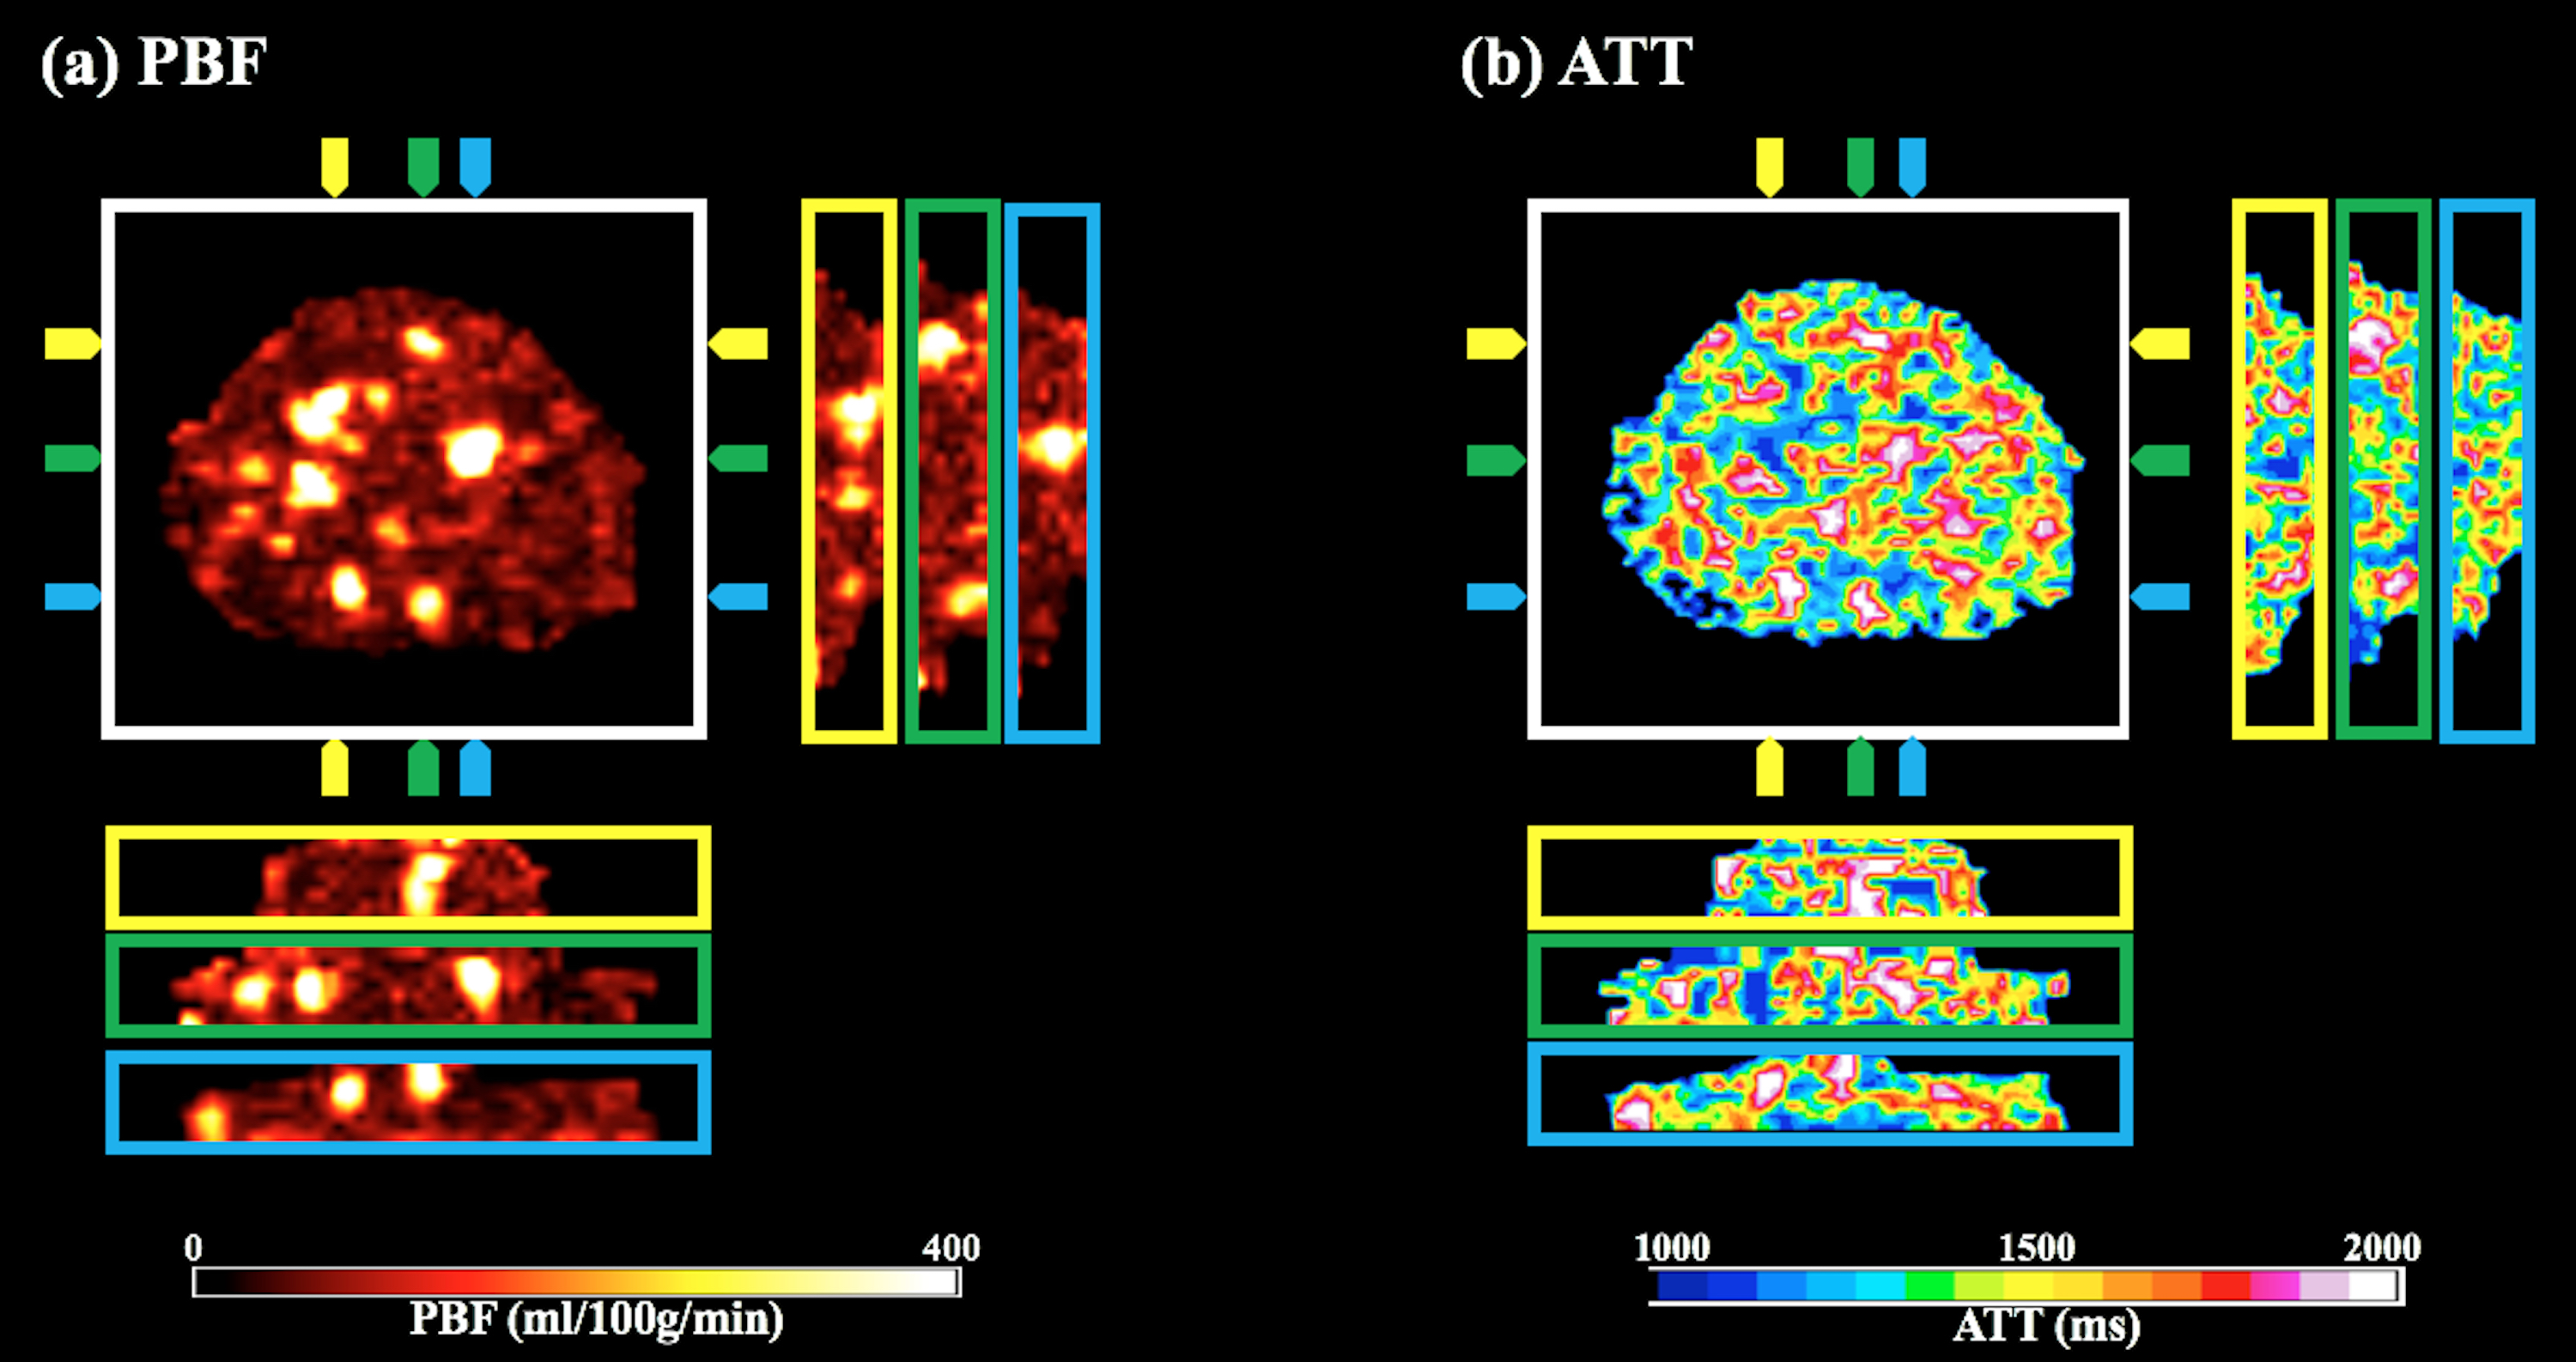
Figure 3 shows 3D view of PBF (a) and ATT (b). Apparent hyper-perfusion regions are displayed in coronal/sagittal views, with arrows indicating the spatial locations corresponds to the transversal image. Whole placenta PBF maps provide spatially resolved diagnostic information, which provides an understanding of the underlying vasculature.
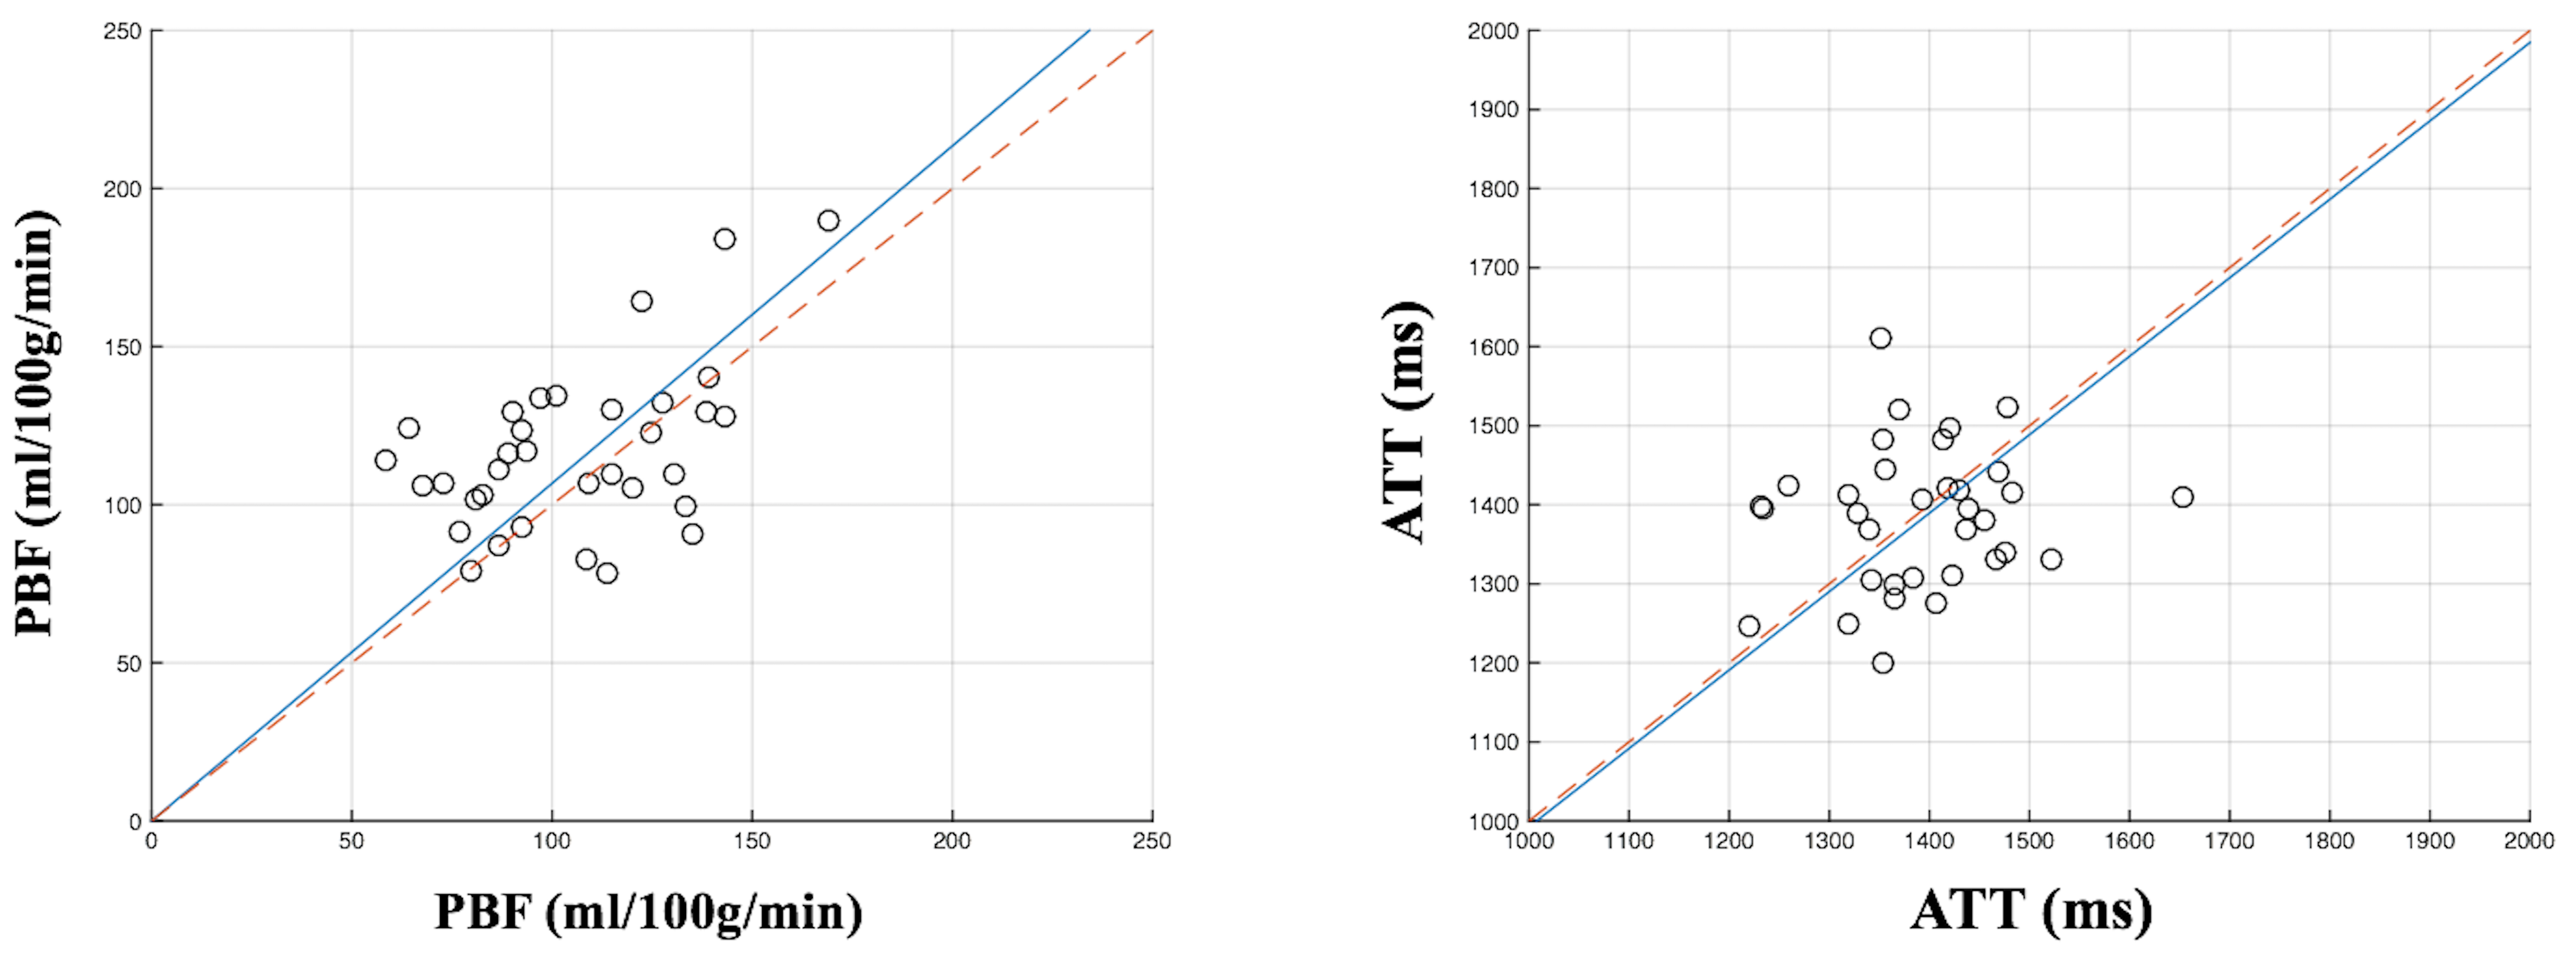
PBF/ATT values of the second scan are plotted against the first scan (Fig. 4). The average PBF increased by 10.4% (P<0.05) while no significant change in ATT (P=0.72) along gestational age. Overall, PBF and ATT for the second trimester were 111.4±26.7 ml/100g/min and 1387.5±88.0 ms, matching well with the literature.7
Scatter plot of PI and RI against PBF was shown in Figure 5. No significant correlation between PI/RI and PBF was found. PBF across subjects with unilateral/bilateral notch is 89.1±12.4ml/100g/min, which is significantly lower than 111.9±22.4ml/100g/min from the subjects without notch (P<0.01). A 20.3% reduction in PBF is consistent with the presence of notches, which represents the sign of high impedance to flow.8 Since ultrasound is an established imaging modality, this result supports the validity of the presented ASL approach for assessing placental function.
Conclusion
We present a 3D multi-delay pCASL sequence, which is promising for non-invasive measurement of PBF and ATT. Its clinical use for the detection of aberrations in placental function and prediction of fetal developmental disorders awaits further evaluation.Acknowledgements
This work was supported by National Institute of Health (NIH) grant NIH U01-HD087221.References
[1] Shao X, Wang Y, Moeller S, Wang DJ. A constrained slice-dependent background suppression scheme for simultaneous multislice pseudo- continuous arterial spin labeling. Magn Reson Med 2017 [Epub ahead of print].
[2] Feinberg DA, Hoenninger JC, Crooks LE, Kaufman L, Watts JC, Arakawa M. Inner volume MR imaging: technical concepts and their application. Radiology 1985;156:743–747.
[3] Wang DJ, Alger JR, Qiao JX, et al. Multi-delay multi-parametric arte- rial spin-labeled perfusion MRI in acute ischemic stroke — Compari- son with dynamic susceptibility contrast enhanced perfusion imaging. Neuroimage Clin 2013;3:1–7.
[4] Maccotta L, Detre JA, Alsop DC. The efficiency of adiabatic inversion for perfusion imaging by arterial spin labeling. NMR Biomed 1997;10(4-5):216-221.
[5] Gowland PA, Francis ST, Duncan KR, et al. In vivo perfusion measure- ments in the human placenta using echo planar imaging at 0.5 T. Magn Reson Med 1998;40:467–473.
[6] Dai W, Robson PM, Shankaranarayanan A, Alsop DC. Reduced resolution transit delay prescan for quantitative continuous arterial spin labeling perfusion imaging. Magn Reson Med 2012;67:1252– 1265.
[7] Moore P, Cooper G. Placental blood flow. Curr Anaesth Crit Care 1999;10:83–86.
[8] Bower S, Vyas S, Campbell S, Nicolaides KH. Color Doppler imaging of the uterine artery in pregnancy: normal ranges of impedance to blood flow, mean velocity and volume of flow. Ultrasound Obstet Gynecol 1992;2:261–265.
Figures