0054
Hemodynamic response altered by focused ultrasound-mediated disruption of the blood-brain barrier1Brigham and Women's Hospital, Boston, MA, United States, 2Harvard Medical School, Boston, MA, United States, 3Boston Children's Hospital, Boston, MA, United States
Synopsis
Focused ultrasound (FUS) disruption of the blood-brain barrier (BBB) is a promising technology for achieving targeted delivery of pharmacological agents into the brain. While the method has been shown to be safe from the standpoint of not damaging tissue cells, it causes other changes to local physiology that are not fully understood. This study aims to characterize the effects on the hemodynamic response that FUS BBB opening causes. We present BOLD fMRI data showing the effect and preliminary ASL measurements of cerebral blood flow designed to better understand the effect.
Introduction
Focused ultrasound (FUS) disruption of the blood-brain barrier (BBB) is a non-invasive technique that can be used to facilitate targeted delivery of pharmacological agents into the brain1. The BBB can be successfully disrupted without causing damage to tissue cells that is observable in histology2,3. However, studies have shown that BBB disruption alone causes changes in the BOLD response to a stimulus in rats4 and possibly changes in non-human primates that are observable in behavior5.
In this study, we aim to use BOLD and arterial spin labeling (ASL) imaging to characterize the changes in the hemodynamic response that are caused by FUS-induced BBB opening in the rat brain.
Methods
N=7 rats underwent BOLD EPI imaging after BBB opening, N=7 rats underwent BOLD EPI imaging after sham BBB opening, and N=1 rats underwent both BOLD EPI and ASL imaging after BBB opening.
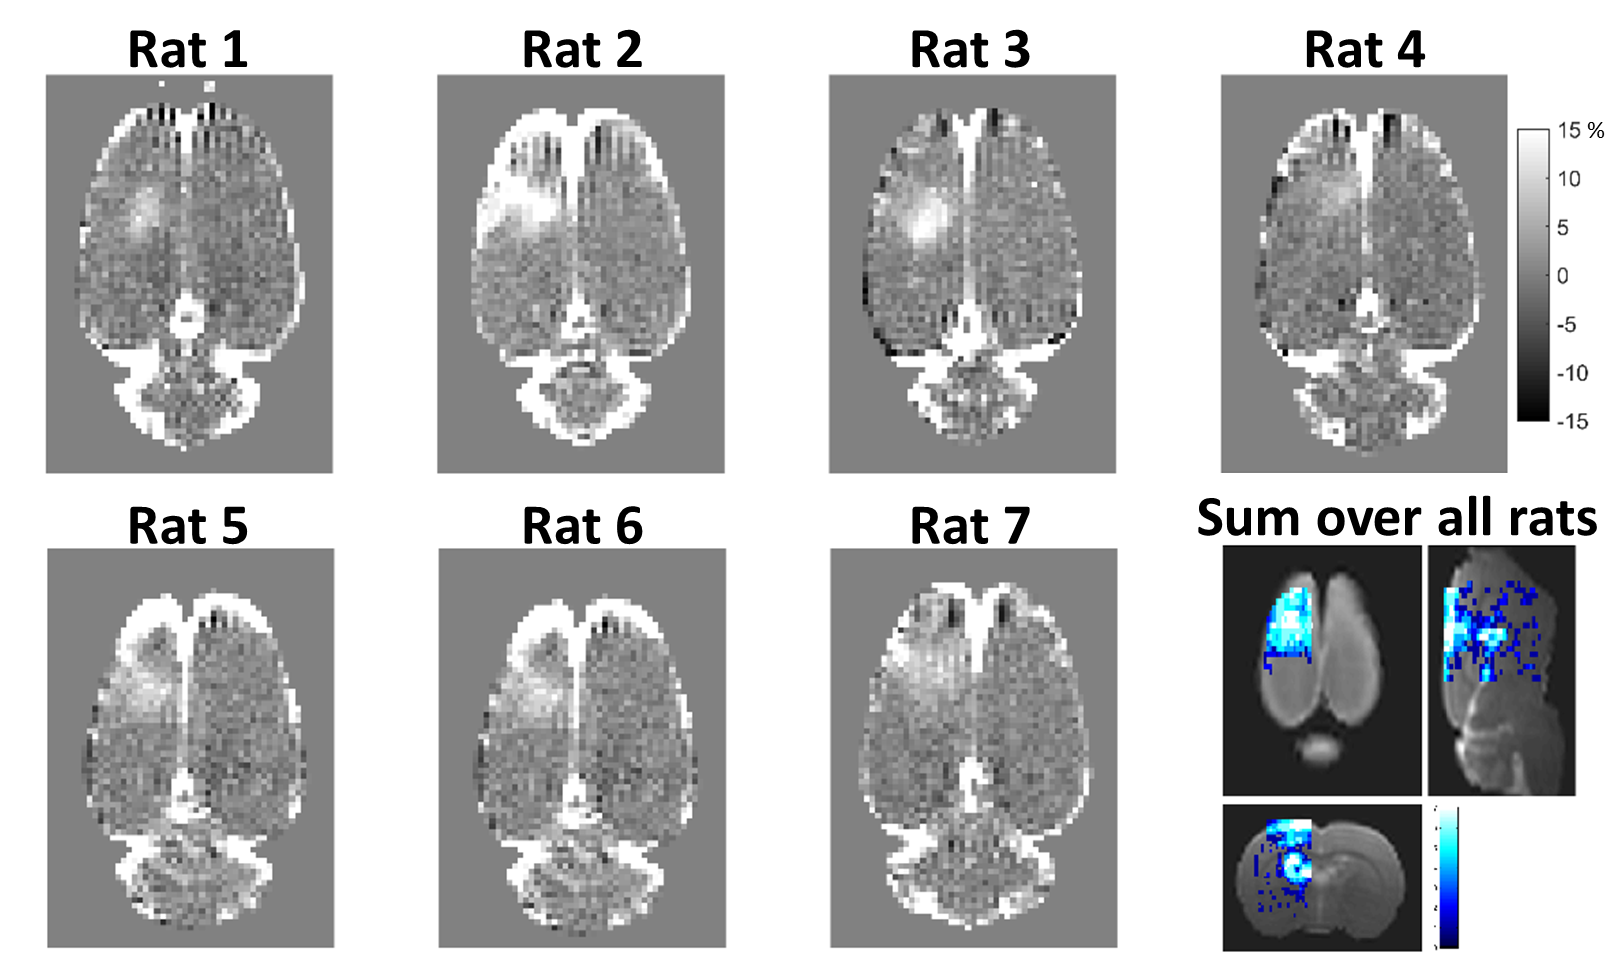
BBB opening: BBB disruption was targeted to the right somatosensory cortex (S1) in one hemisphere only. Microbubbles were injected (Optison, 200 μl/kg) and 690 kHz transcranial FUS was applied using 10 ms bursts at 1 Hz for 120 seconds. The extent and location of BBB opening were evaluated with T1-weighted Gadolinium contrast imaging.
Stimulation: Bilateral hindpaw electrical stimulation (4 mA, 0.3 ms duration, 6 Hz) for activation of the somatosensory network. Rats were under light anesthetic sedation using Dexdormitor (0.4 mg/kg bolus followed subcutaneous infusion as needed) and light isoflurane (0.25%) with respiratory rate monitored throughout6,7.
Imaging: All images were acquired on a Bruker 7T small animal scanner. BOLD fMRI data was acquired with a single shot EPI sequence (TR = 1.5 s, TE = 18 ms, 18 slices, 0.5 x 0.5 x 1.0 mm resolution, 300 images). ASL data was acquired with a continuous ASL sequence with single shot EPI readout (TR = 3000 ms, TE = 15.5 ms, 2000 ms labeling duration, 400 ms post-label delay, interleaved label/control, 1 2mm thick slice). ASL data was acquired without stimulation to create a baseline cerebral blood flow (CBF) map and with stimulation for functional CBF maps. Stimulation was performed in a 40 s OFF, 20 s ON block design over 7.5 minutes (BOLD) or 10 minutes (ASL). BOLD data were processed using SPM12 with realignment, coregistration to a T2w anatomical image, normalization to a common space, and Gaussian filter spatial smoothing (0.8 x 0.8 x 0.8 mm FWHM). ASL data were smoothed (1.0 x 1.0 x 1.0 mm FWHM) and converted CBF maps8.
Results
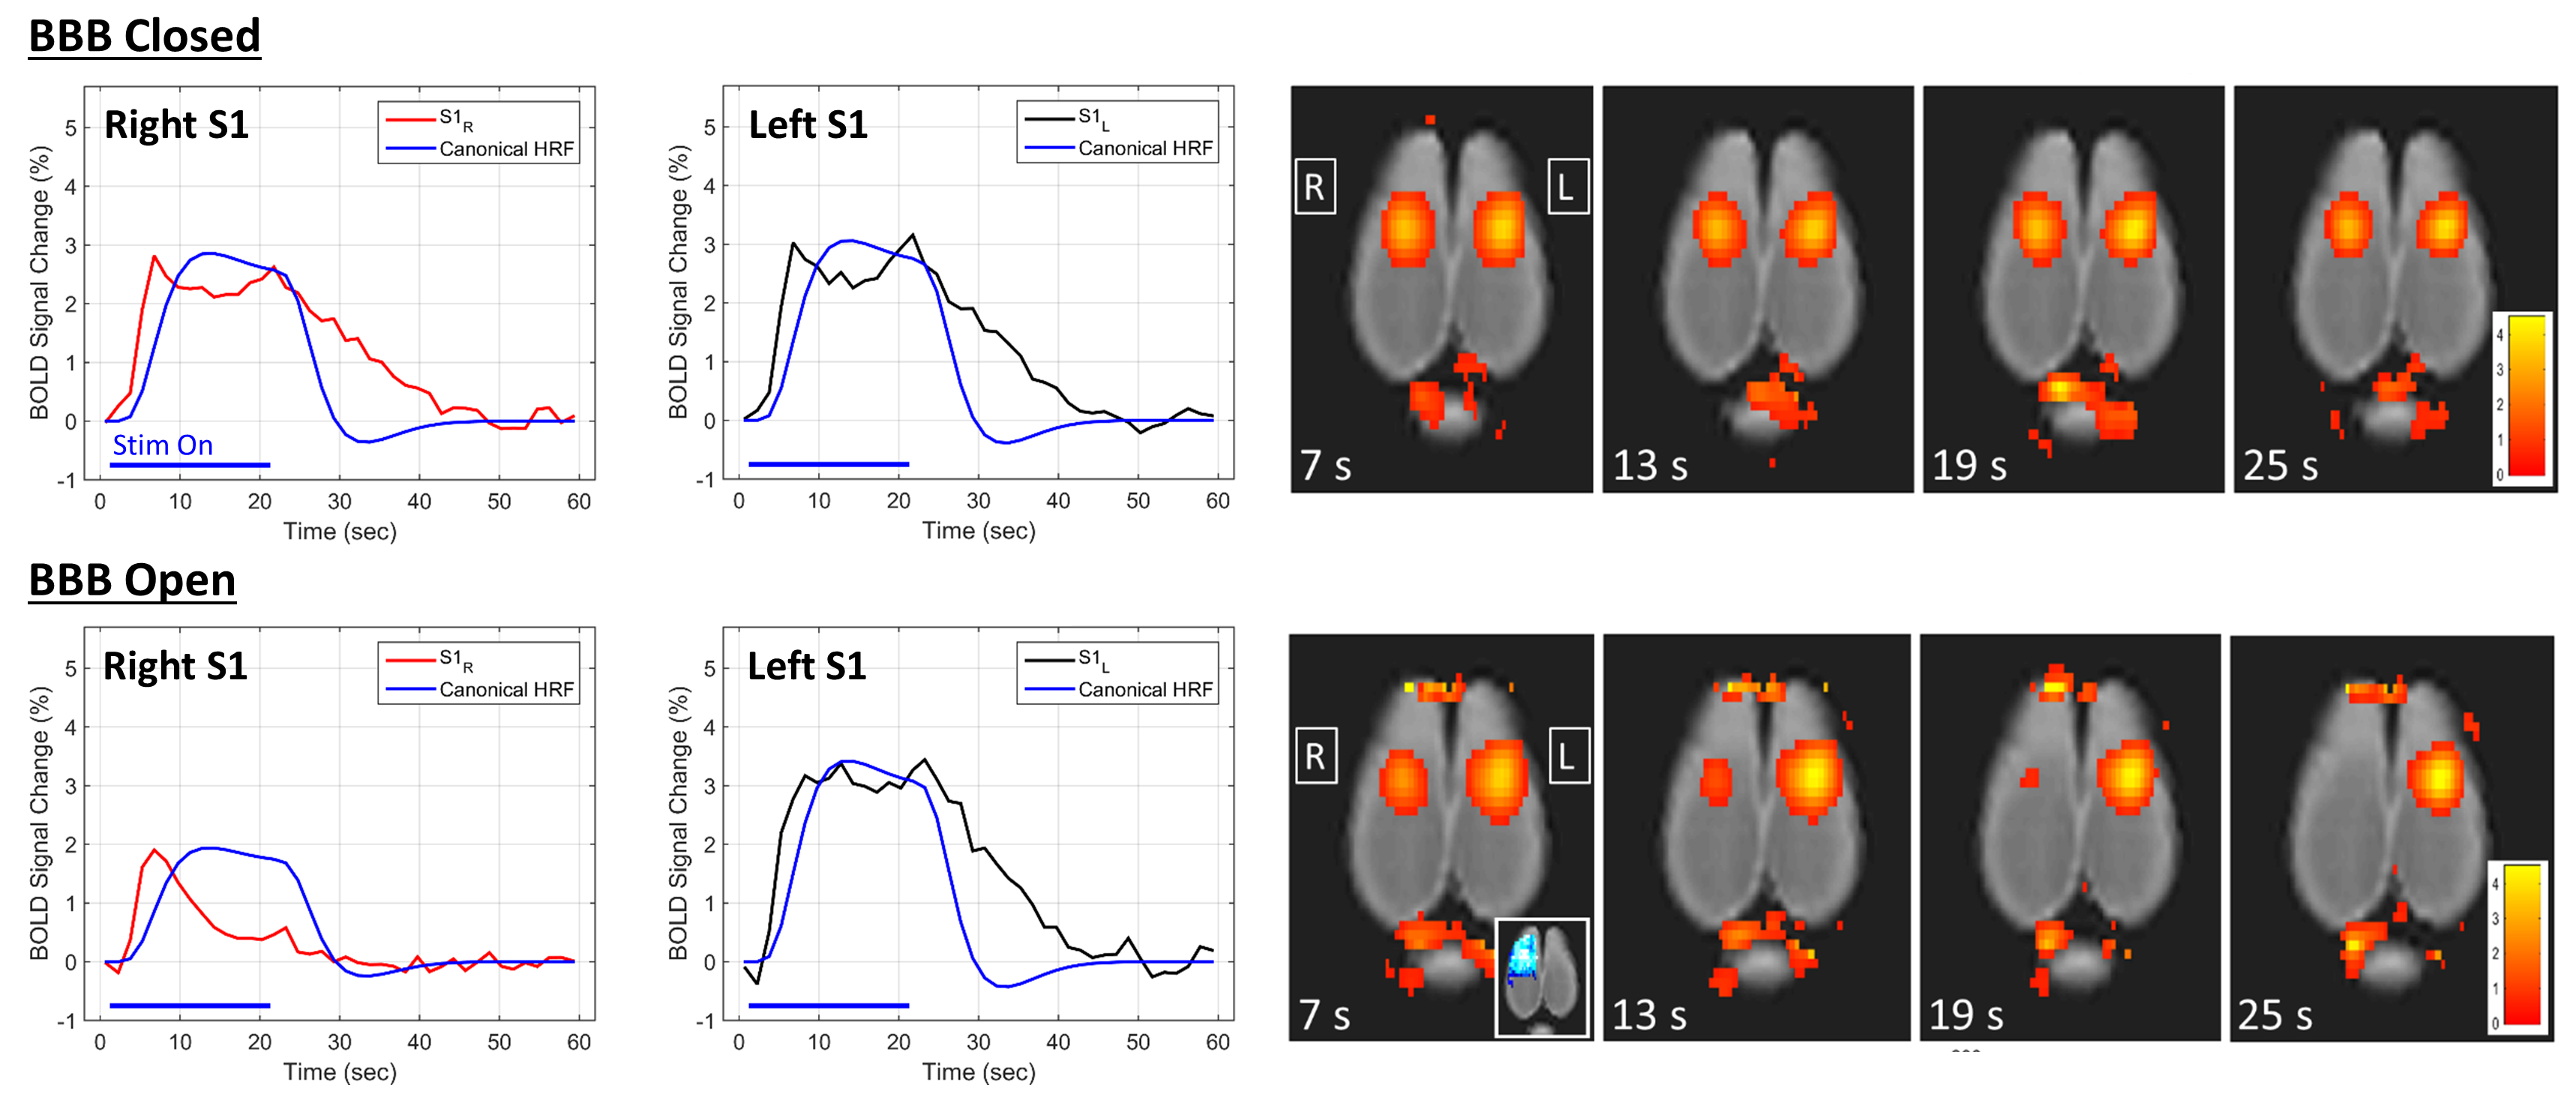
Figure 1 shows gadolinium percent difference images depicting the extent of BBB opening achieved in each of the 7 rats, with the disruption well localized to the right hemisphere. Figure 2 shows the BOLD response to the stimulus for the BBB closed and BBB open cases. The plots of BOLD percent change are shown with SPM’s canonical hemodynamic response plotted for reference. When the BBB is open, the BOLD signal has a slightly lower peak change and returns to baseline more rapidly, even before the stimulus is turned off.
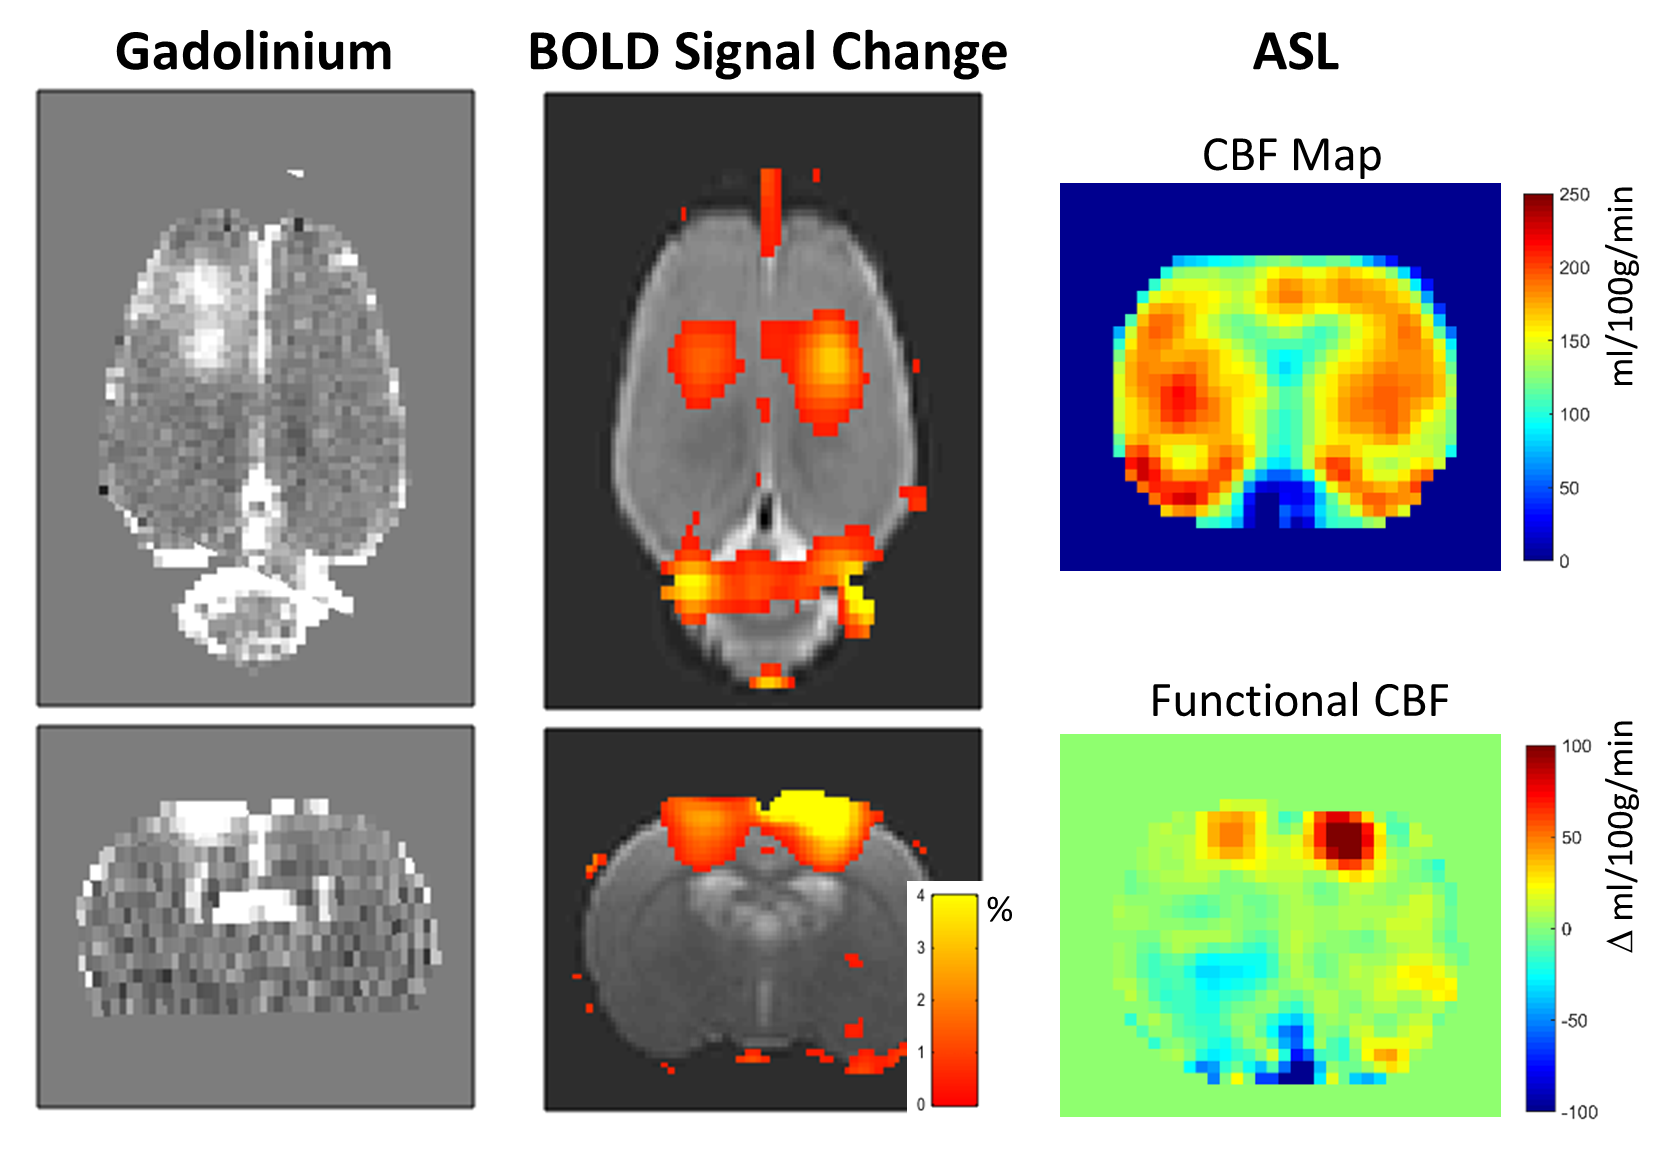
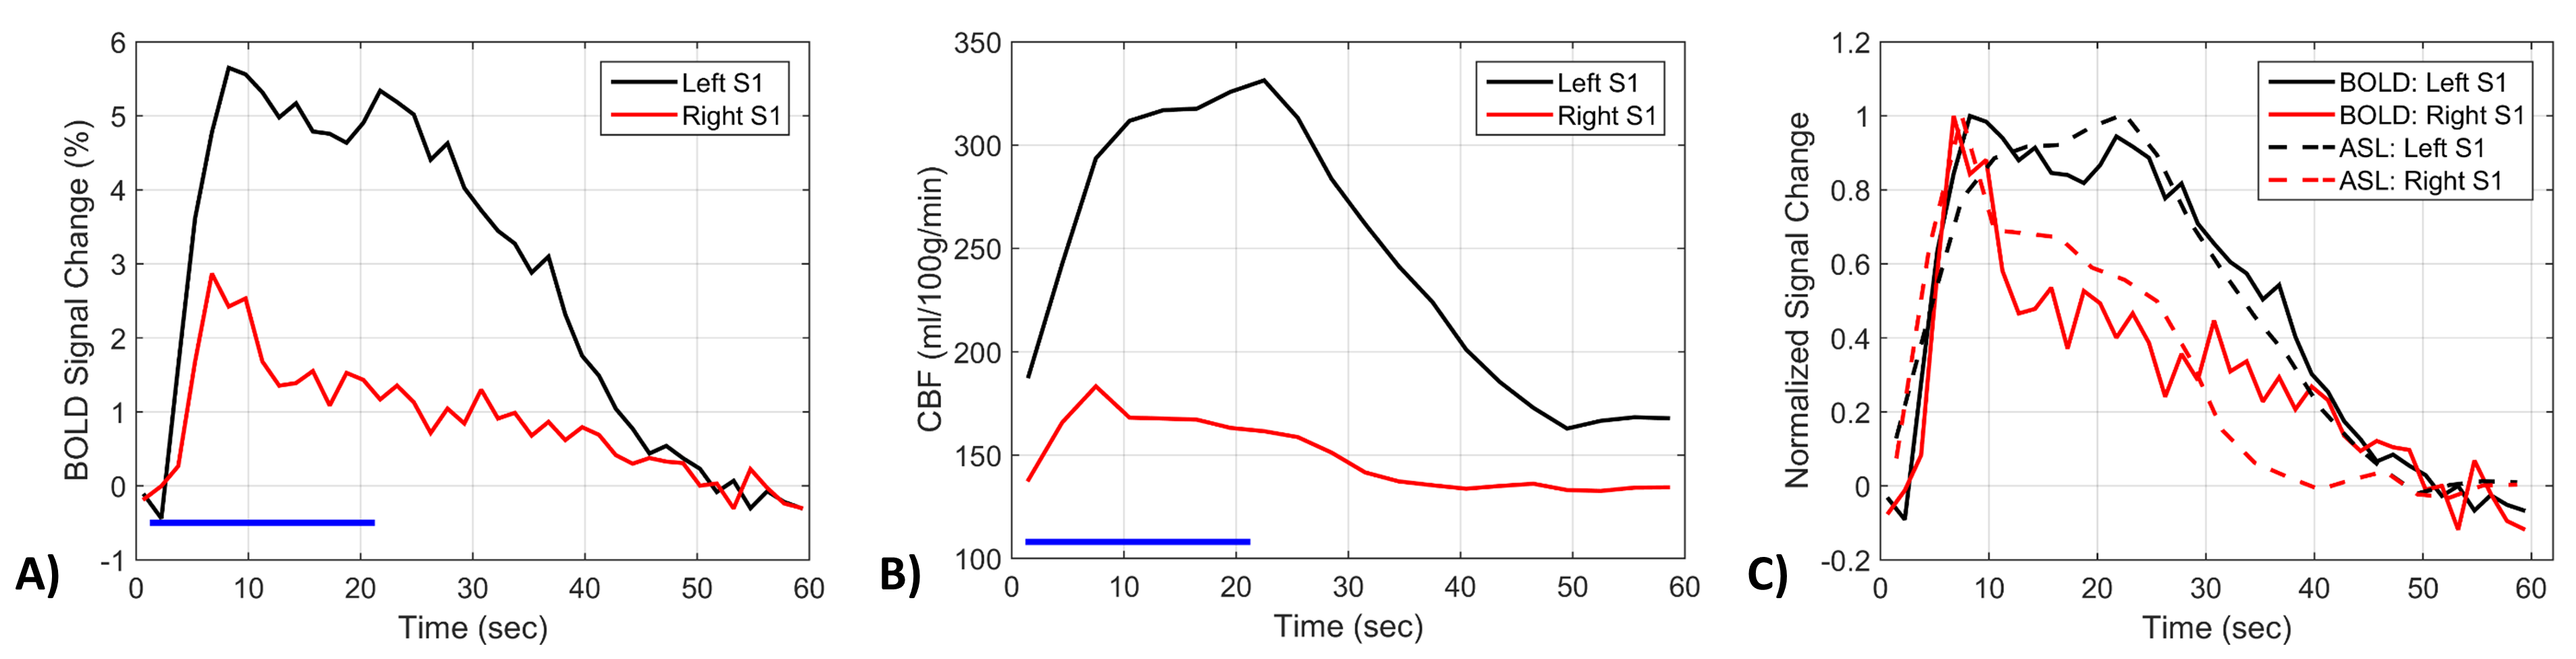
Figures 3 and 4 show data comparing the BOLD and ASL data. The observed BOLD response is similar to what was seen in the other rats. The CBF map without stimulation shows reduced flow in the right S1. The functional CBF map shows that the change in CBF due to stimulation is less in the right S1 compared to the left S1. The plots shows the changes in the BOLD and CBF signals over the stimulus block. The CBF data largely follow the BOLD data, with the right S1 showing both a smaller change and a faster return to baseline.
Discussion & Conclusions
The BOLD data clearly show that the hemodynamic response is altered due to FUS-induced BBB opening. The BOLD signal is determined by a complicated mixture of effects related to changes in oxygen metabolism, blood flow, and local blood volume. Quantification of these individual components would be ideal. The very preliminary ASL data shows that this may be possible as it gives a direct measure of blood flow. Future work will add more ASL data sets and additional imaging techniques such as hypercapnia imaging and cerebral blood volume imaging to try to better understand the underlying physiological effects caused by BBB opening.Acknowledgements
NIH grants R25CA089017-13 and K01EB023983, and the Focused Ultrasound Surgery Foundation 2017 Global Internship Program.References
1. Hynynen, K. et al., 2001. Noninvasive MR imaging-guided focal opening of the blood-brain barrier in rabbits. Radiology, 220(3), pp.640–6.
2. McDannold, N. et al., 2012. Temporary disruption of the blood-brain barrier by use of ultrasound and microbubbles: safety and efficacy evaluation in rhesus macaques. Cancer research, 72(14), pp.3652–63.
3. Weng, J.-C. et al., 2011. Detecting blood-brain barrier disruption within minimal hemorrhage following transcranial focused ultrasound: a correlation study with contrast-enhanced MRI. Magnetic resonance in medicine, 65(3), pp.802–11.
4. Chu, P. et al., 2015. Neuromodulation accompanying focused ultrasound-induced blood-brain barrier opening. Scientific Reports, 5:15477.
5. Downs, M. et al., 2015. Blood-Brain Barrier Opening in Behaving Non-Human Primates via Focused Ultrasound with Systemically Administered Microbubbles. Scientific Reports, 5:15076.
6. Adamczak, J.M. et al., 2010. High field BOLD response to forepaw stimulation in the mouse. NeuroImage, 51(2), pp.704–712.
7. Brynildsen, J. et al., 2017. Physiological characterization of a robust survival rodent fMRI method. Magnetic Resonance Imaging, 35, 54–60.
8. Alsop, D.C., Detre, J.A., Golay, X., Gunther, M., Hendrikse, J., Hernandez-Garcia, L., Lu, H., MacIntosh, B.J., Parkes, L.M., Smits, M., van Osch, M.J., Wang, D.J., Wong, E.C., Zaharchuk, G., 2015. Recommended implementation of arterial spin-labeled perfusion MRI for clinical applications: A consensus of the ISMRM perfusion study group and the European consortium for ASL in dementia. Magn Reson Med 73, 102-116.
Figures