0053
Influence of end-tidal CO2 on cerebrovascular reactivity mapping: within-subject and across-subject effects1Division of MR Research, Johns Hopkins University, Baltimore, MD, United States, 2Johns Hopkins University, Baltimore, MD, United States, 3National Institutes of Health, Bethesda, MD, United States
Synopsis
The relationship between end-tidal (Et) CO2, and the output measure, BOLD signal, is highly non-linear, due to both physiological non-linearity between cerebral blood flow (CBF) and CO2 as well as biophysical non-linearity between CBF and BOLD. In this study, we found that, across subjects, baseline EtCO2 and ΔEtCO2 inversely influenced the measured CVR values. Therefore, these factors should be taken into account when comparing CVR between groups or patients. However, these inter-subject differences appear to have an independent physiological underpinning, as manipulations of these factors within the subject did not seem to have an effect on the measured CVR values.
Introduction
Cerebrovascular reactivity (CVR) mapping using CO2-inhalation is increasingly used in basic science and clinical applications. CVR measures MR signal difference, e.g. ΔBOLD, between two states, one representing a baseline state (e.g. room-air breathing) and the other representing a challenged state (e.g. hypercapnia). However, the relationship between the input physiological variable, end-tidal (Et) CO2, and the output measure, BOLD signal, is highly non-linear, due to both physiological non-linearity between CBF and CO2 as well as biophysical non-linearity between CBF and BOLD1. Therefore, measured CVR values may be dependent on experimental conditions such as baseline EtCO2 and ΔEtCO2, which denotes the CO2 difference between baseline and challenged state. Note that variations in EtCO2 and ΔEtCO2 have both across-subject and within-subject components. That is, different subjects have different EtCO2 levels that their body is used to2,3. On the other hand, even for the same subject, his/her EtCO2 could vary on different days/time. Therefore, the purpose of this study was to investigate the effect of baseline EtCO2 and ΔEtCO2 on CVR, in both within- and across-subject settings.Methods
Two studies were performed. Study 1 was performed in a smaller sample size (N=10), and both within- and across-subject effects were examined. Study 2 was conducted in a larger sample size (N=207), and only across-subject effects were examined. All MRI were performed on a Philips 3T.
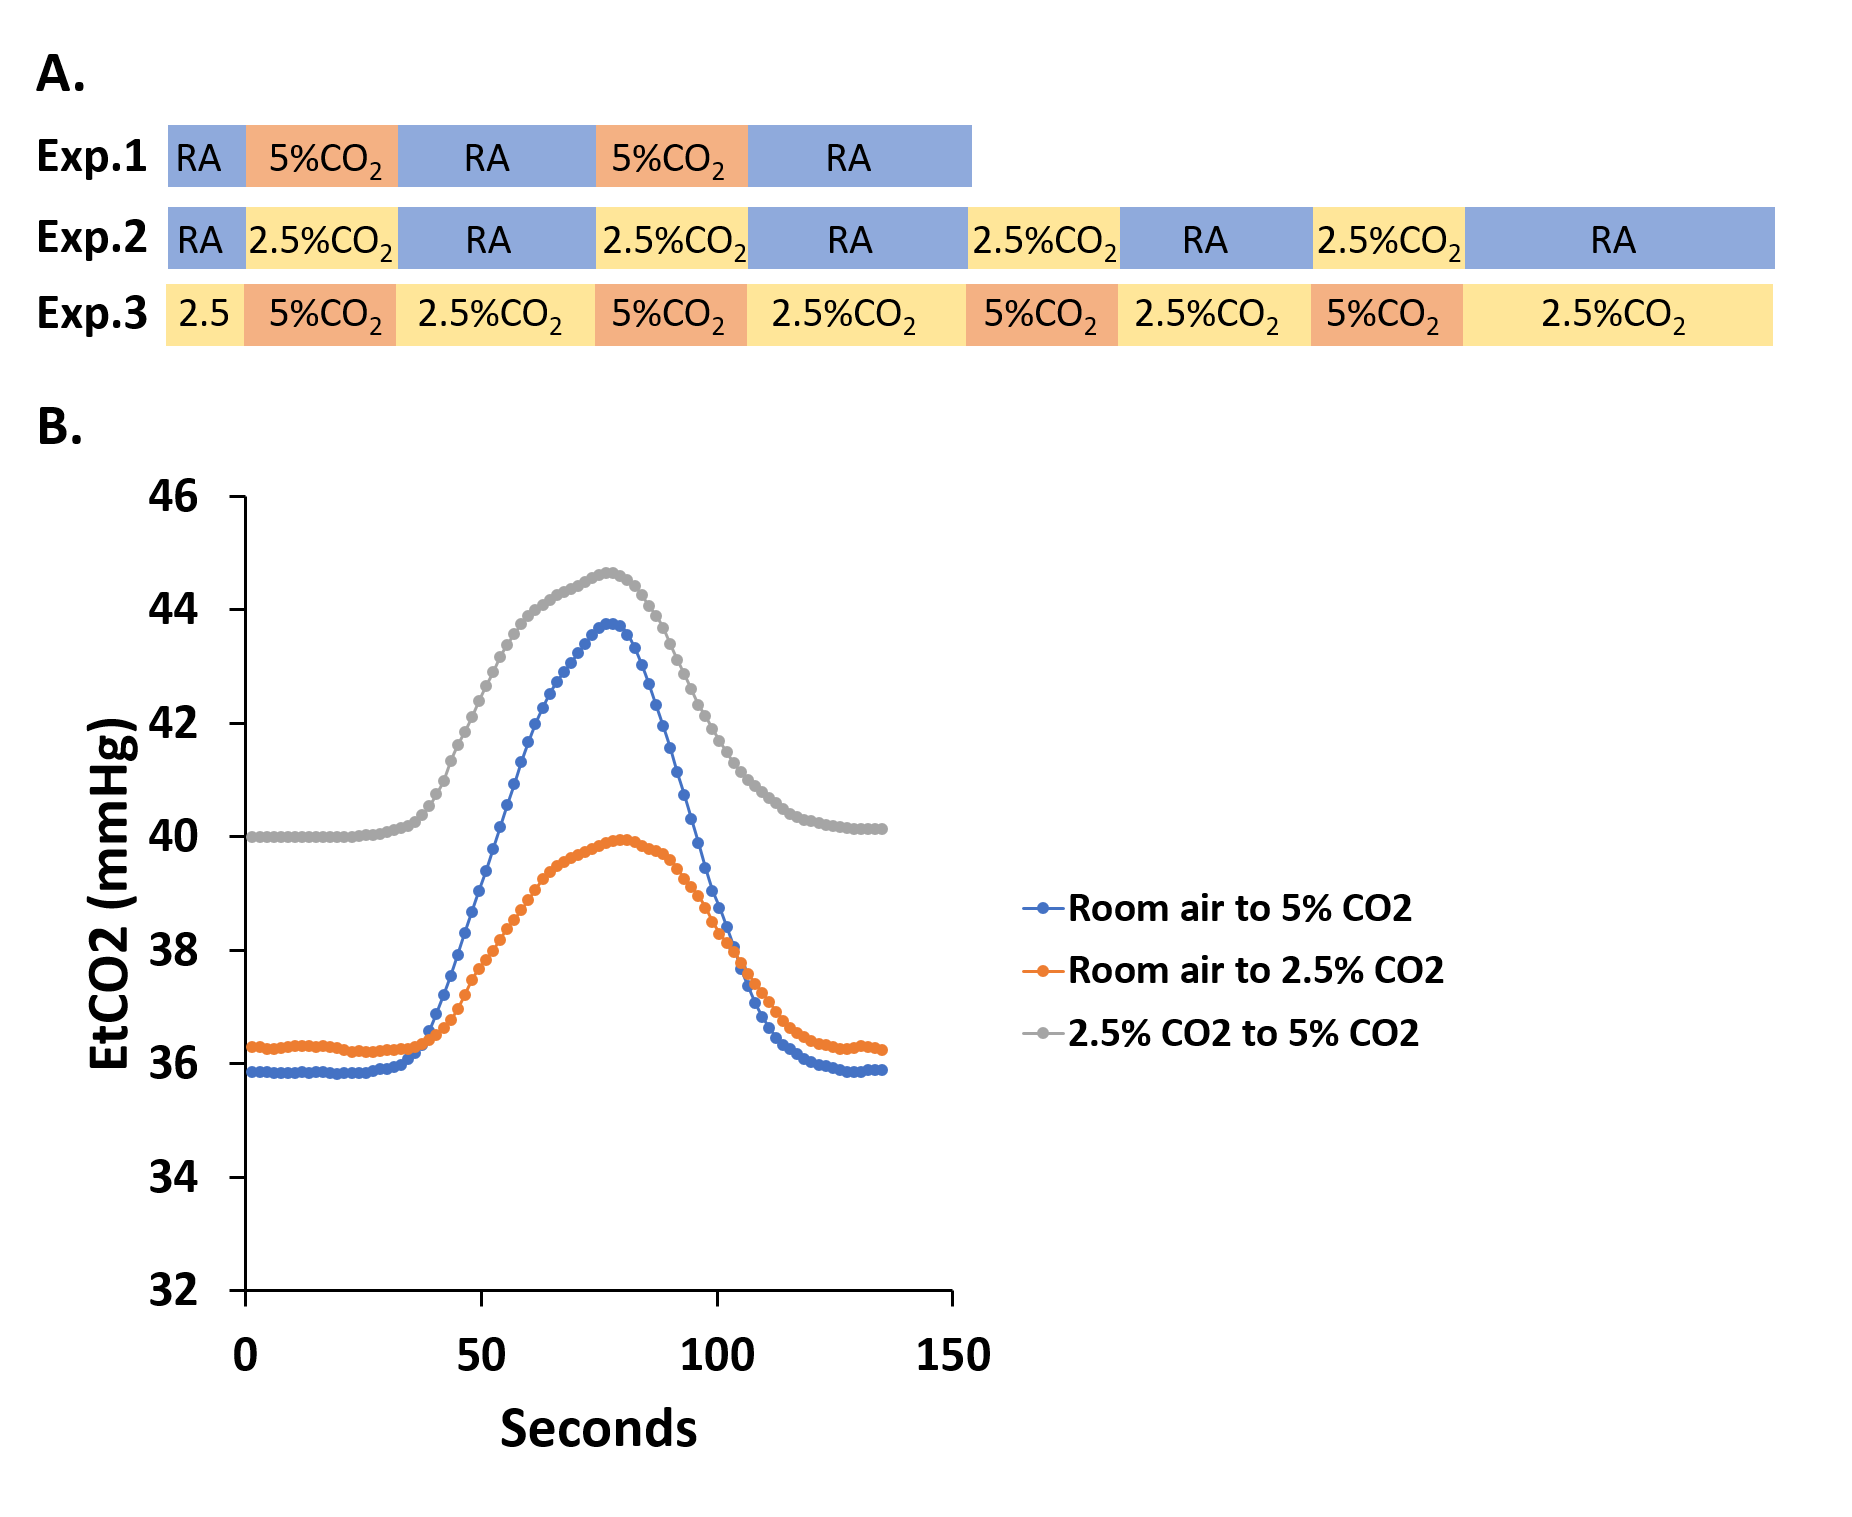
Study 1 enrolled 10 subjects (3M, age: 18-40 years). Three CVR experiments were performed in each subject in a pseudo-random order: experiment (Exp) 1 interleaved room-air breathing with 5% CO2; Exp 2 interleaved room-air with 2.5% CO2; and Exp 3 interleaved 2.5% CO2 with 5% CO2 (Figure 1a). Imaging parameters for all experiments were TR/TE=1500/21ms, voxel size 3.2x3.2x3.5mm3. These experiments resulted in intended variations in baseline EtCO2 and ΔEtCO2 (Figure 1b) in the same subject, allowing examination of the effect of baseline EtCO2 and ΔEtCO2 on CVR in a within-subject setting. Additionally, we used data from one challenge, e.g. room-air interleaved with 5% CO2, to evaluate the relationship in an across-subject setting.
Study 2 enrolled 207 subjects (82M, age: 20-88 years) as part of a large-scale aging study. One CVR experiment was performed in each participant using interleaved room-air breathing with 5% CO2. Imaging parameters were TR/TE=2000ms/25ms, voxel size 3.4x3.4x3.5mm3, scan time=5:2min. This study allowed us to investigate the effect of baseline EtCO2 and ΔEtCO2 on CVR in an across-subject setting in a large cohort.
Results
Study 1:
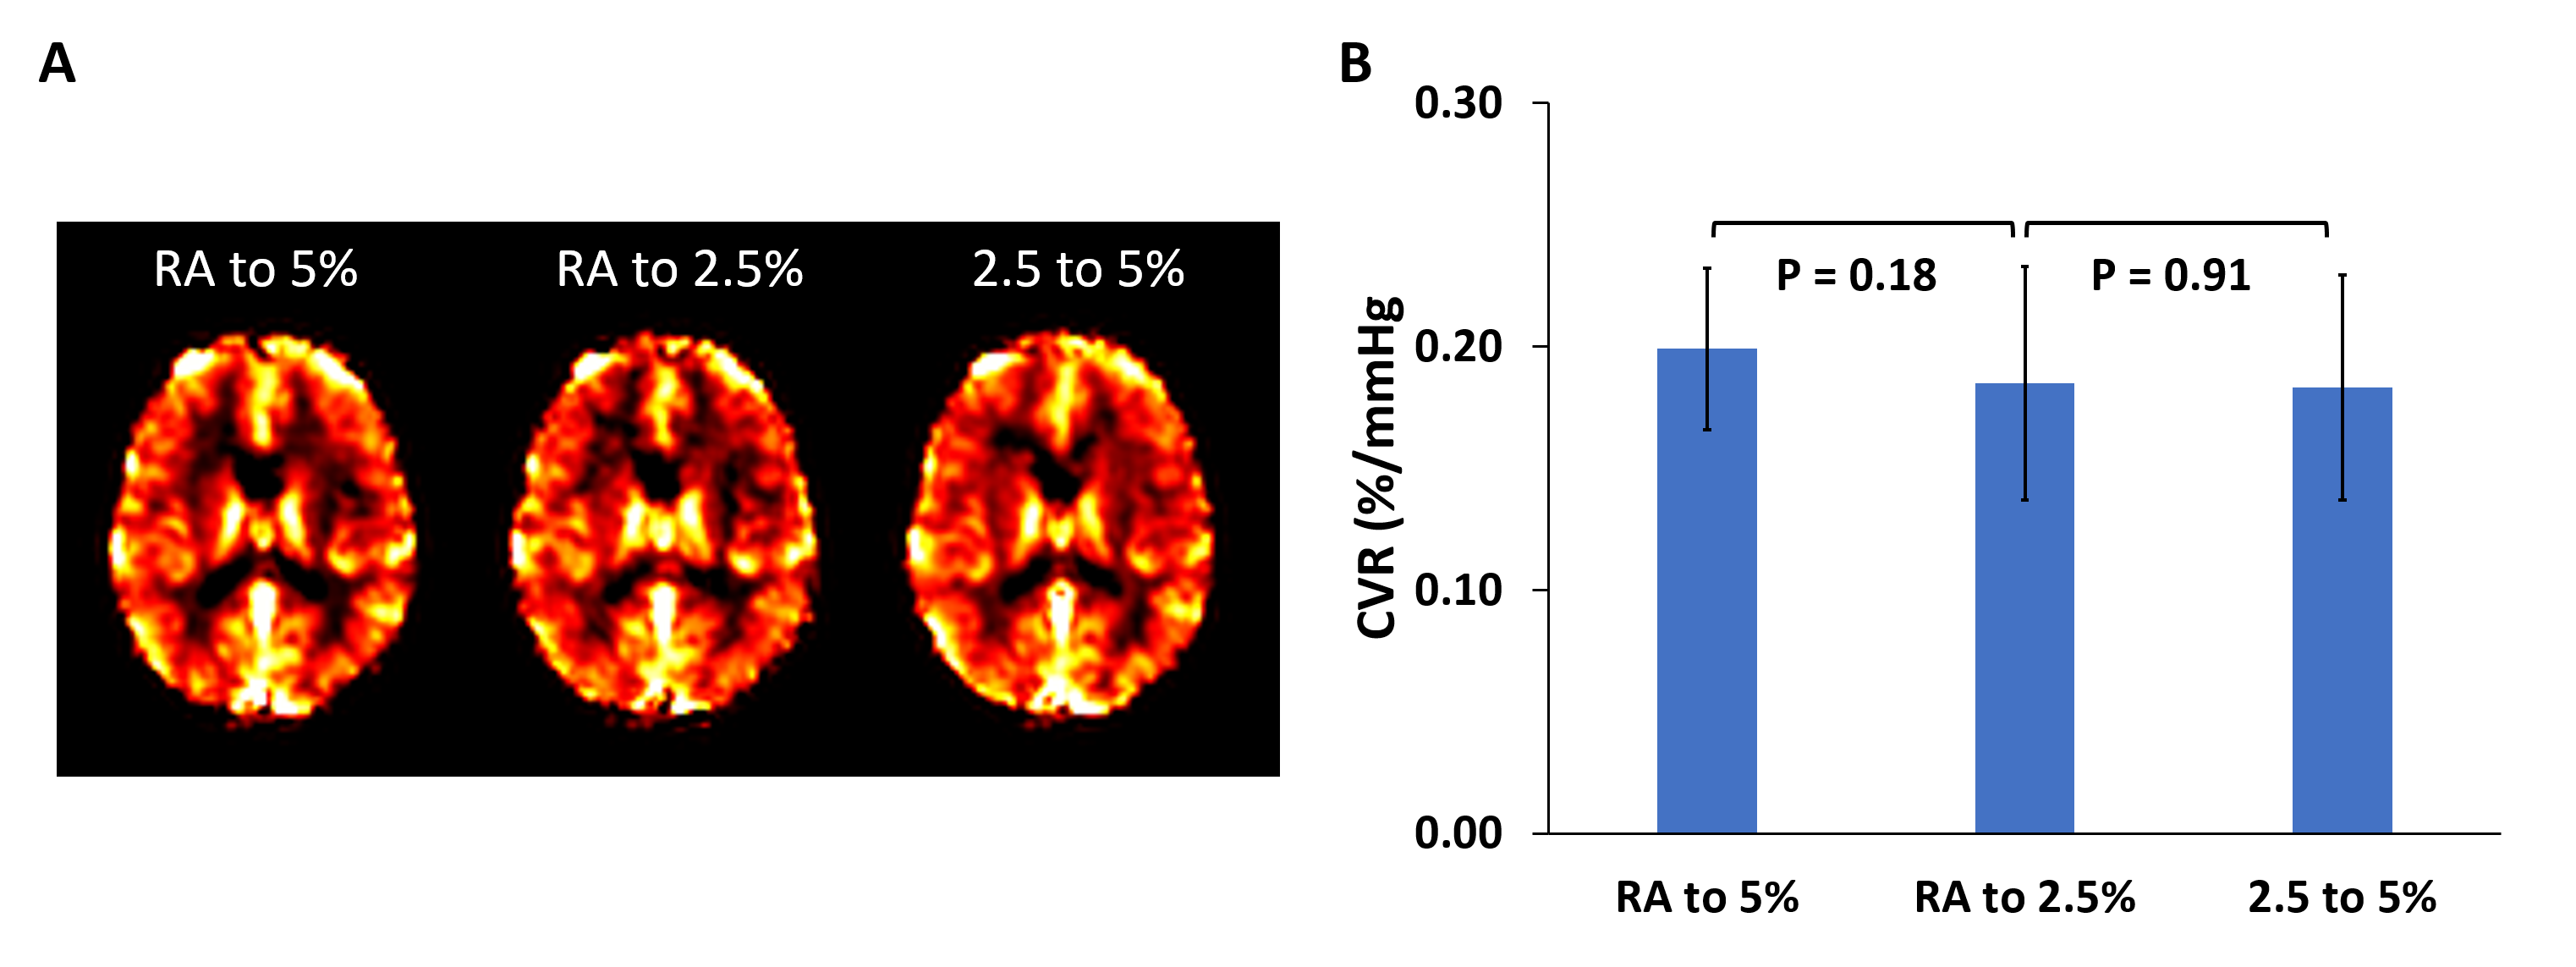
Group-averaged CVR maps from the three experiments are shown in Figure 2a. Whole-brain CVR did not show a significant difference between Exp 1 and Exp 2 (Figure 2b), suggesting that, within a subject, ΔEtCO2 does not influence the measured CVR. Similarly, whole-brain CVR between Exp 2 and Exp 3 did not reveal a significant difference (Figure 2b), suggesting a minimal within-subject effect of baseline EtCO2. These results were confirmed by mixed-effect model analysis which found no significant effects of baseline EtCO2 or ΔEtCO2 on CVR (p=0.99 and 0.48, respectively).
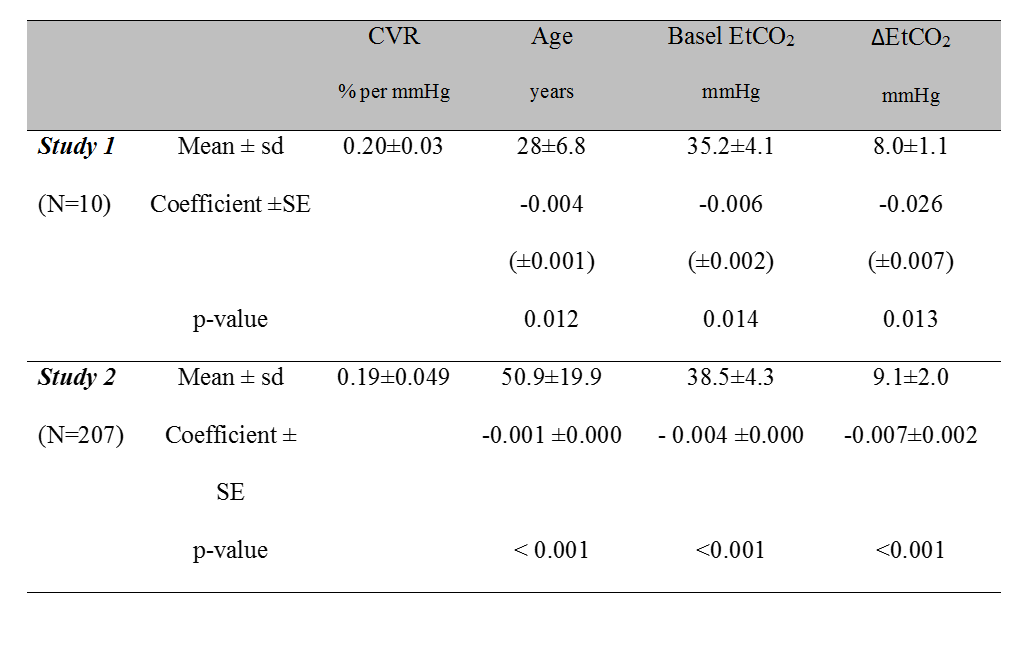
When using Exp 1 data only, a linear regression analysis revealed a significant influence of baseline EtCO2 (p=0.014) and ΔEtCO2 (p=0.013) on CVR across subjects (Table 1). That is, subjects with higher baseline EtCO2 and larger challenge-induced ΔEtCO2 tend to have lower CVR. Similar findings were observed when using Exp 2 data only, although the effects did not reach statistical significance (p=0.08 and 0.14, respectively).
Study 2:
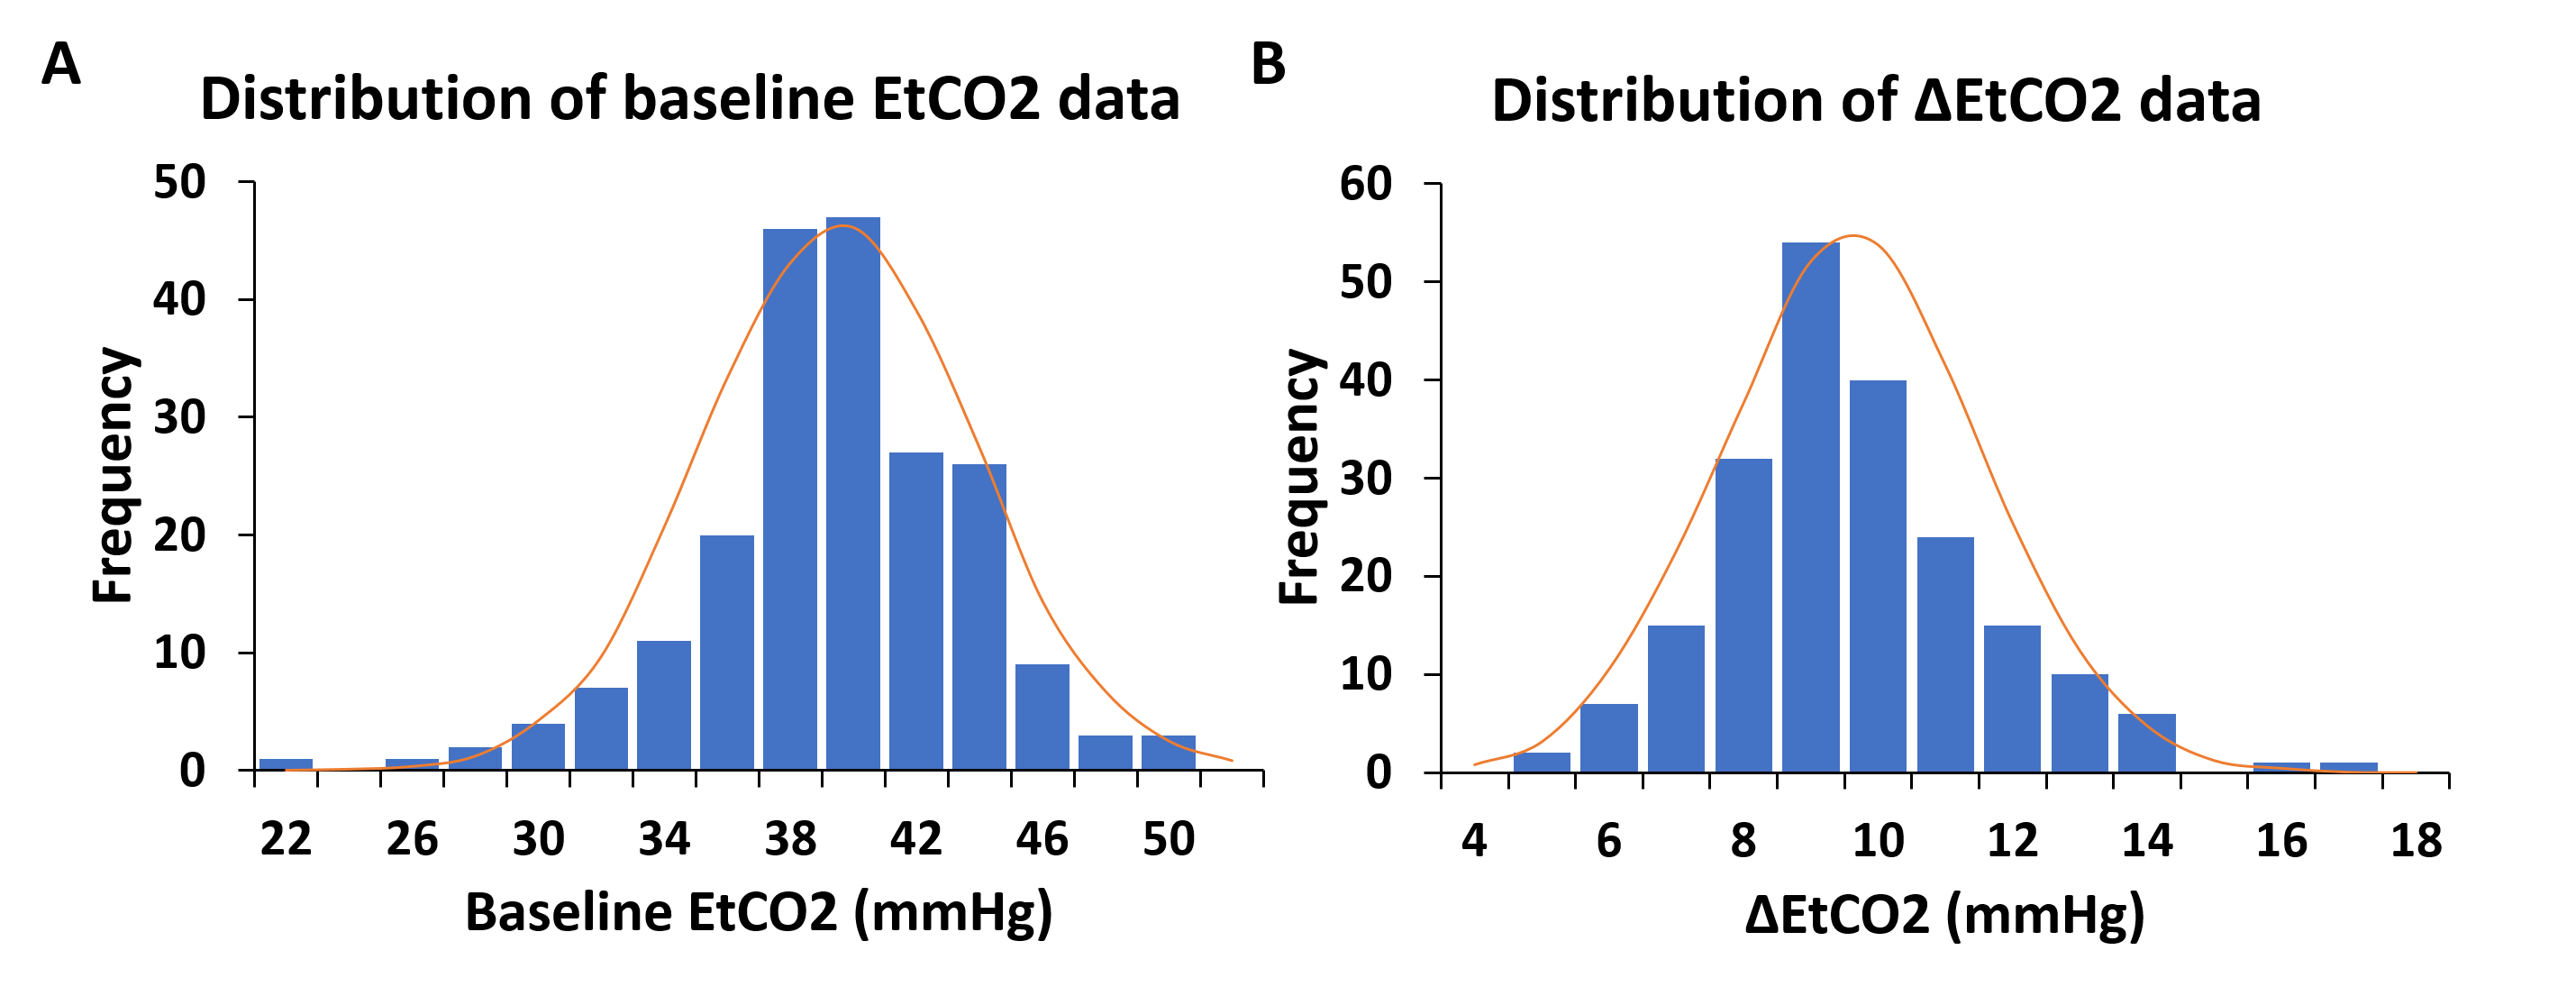
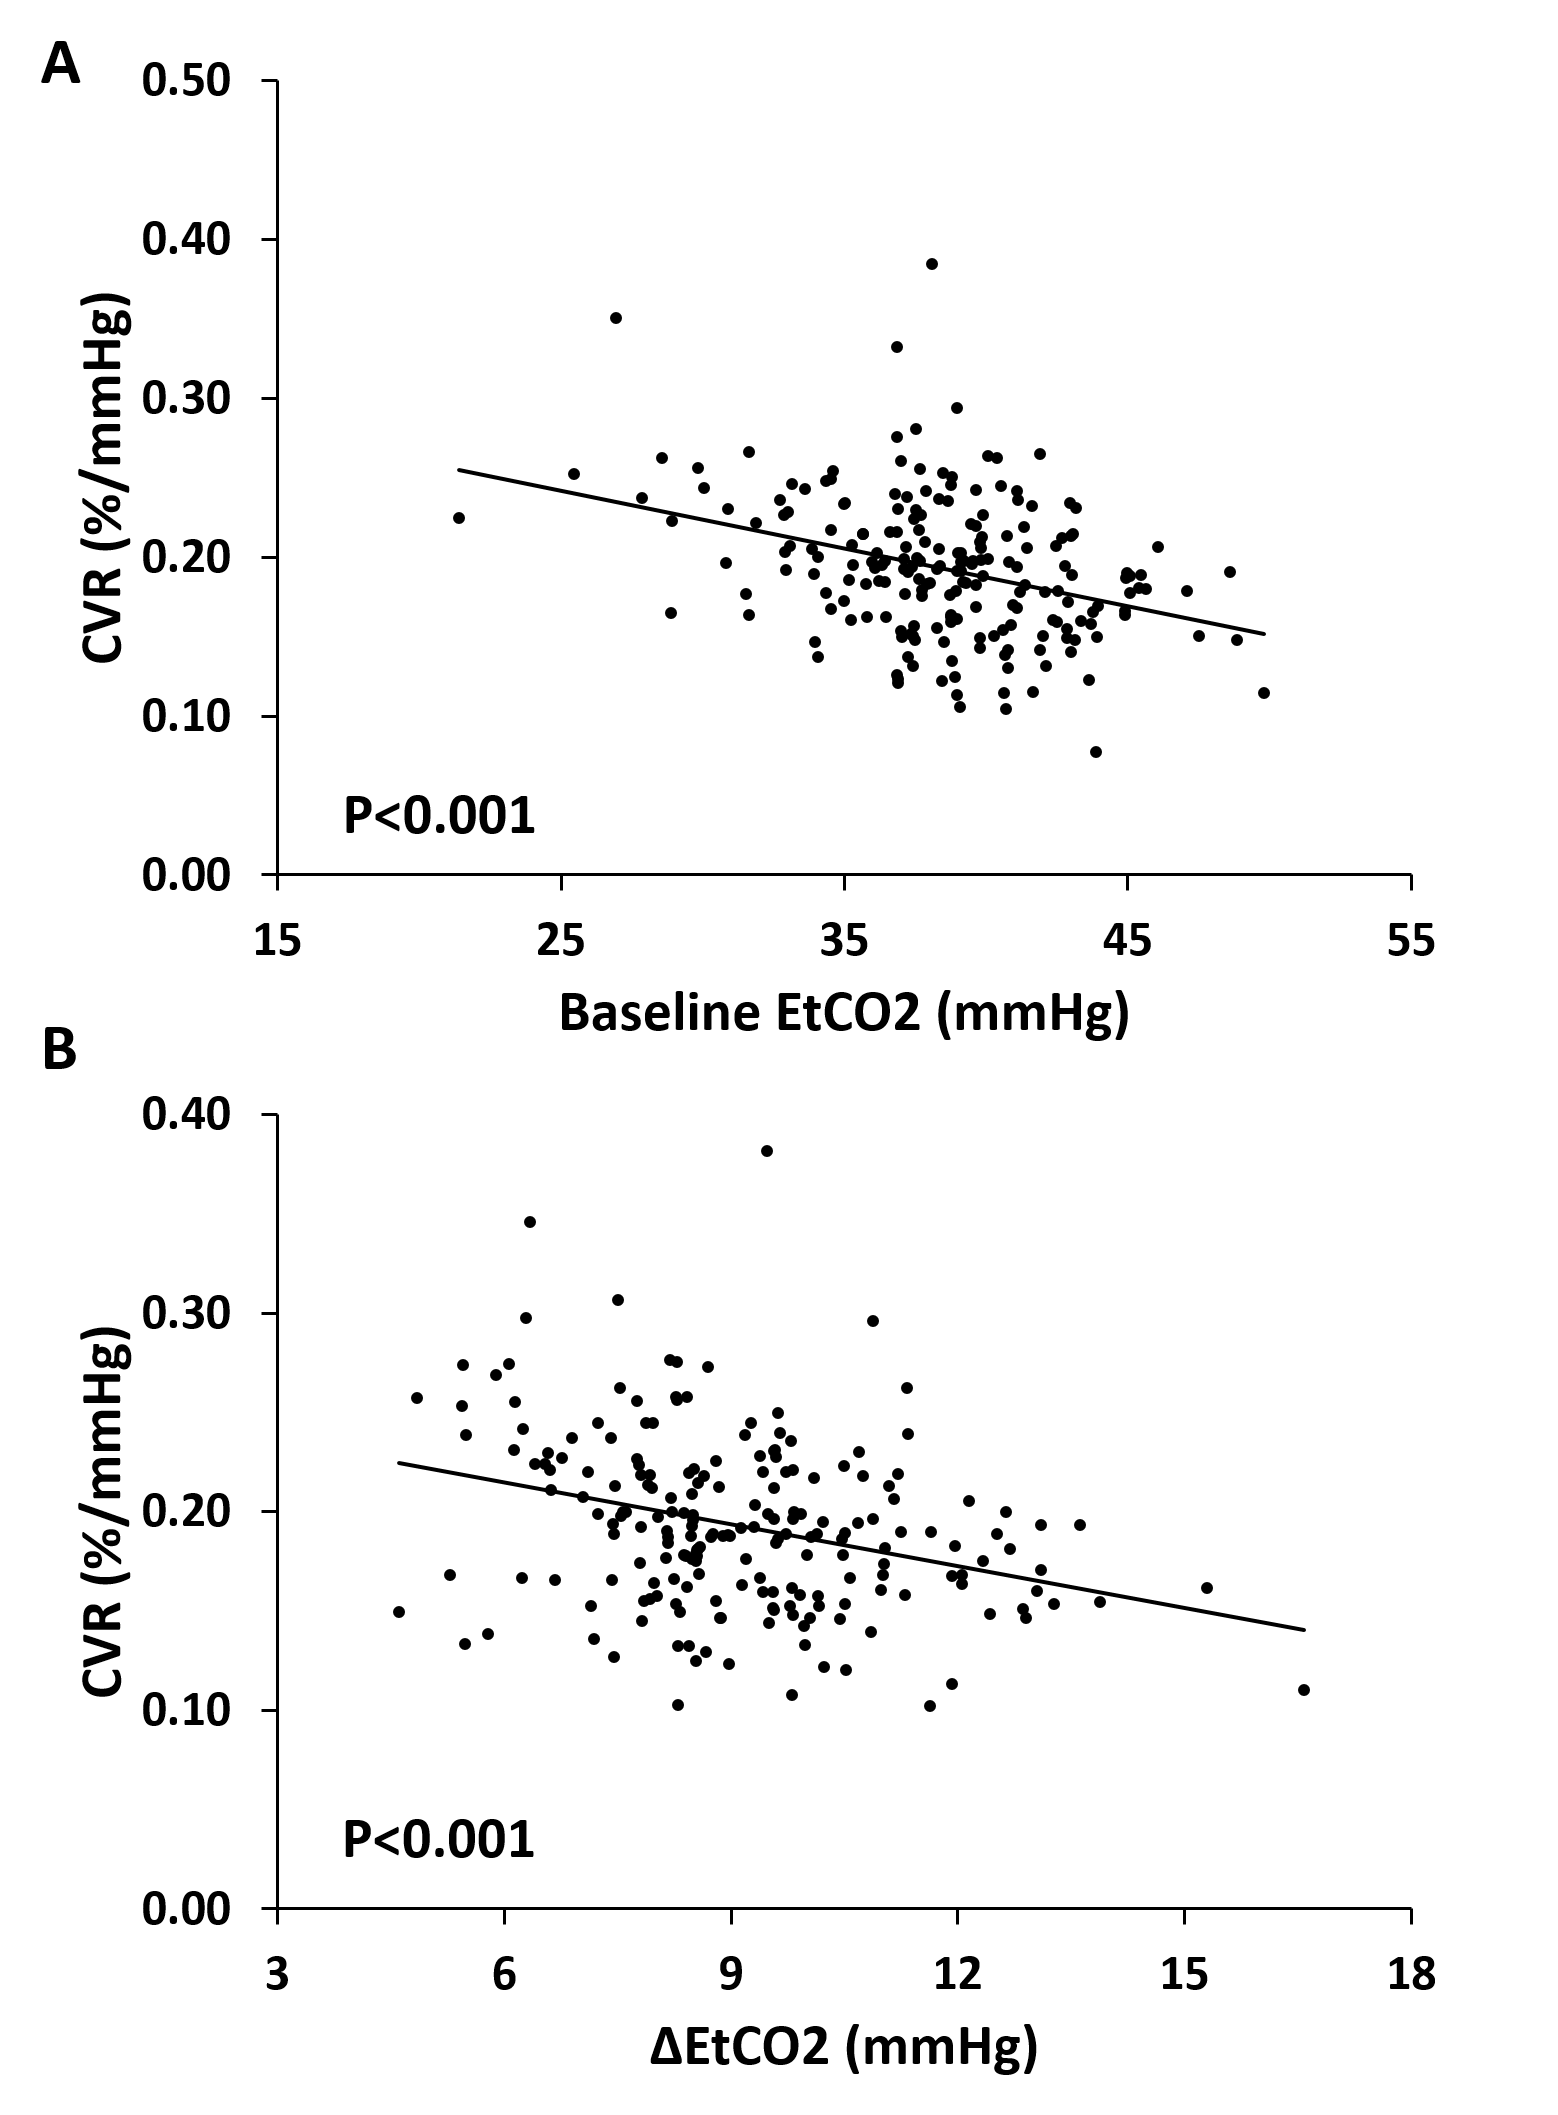
With a large sample size afforded in this study, we first characterized normal variations in baseline EtCO2 and ΔEtCO2 by plotting their histograms (Figure 3). It can be seen that baseline EtCO2 had a mean value of 38.5 mmHg and the standard deviation across subjects was 4.3 mmHg. For ΔEtCO2, the mean and standard deviation was 9.1 mmHg and 2.0 mmHg, respectively. Both manifested a considerable variation across participants. Linear regression analysis revealed a significant influence of baseline EtCO2 and ΔEtCO2 on CVR (p<0.001 for both effects, see Table 1) across subjects. Figure 4 shows a scatter plot between CVR and each of these factors. Although it is not the main point of this study, we also observed a significant age-related decrease in EtCO2 (p=0.04), but an age-increase in ΔEtCO2 (p=0.01).
Discussion and conclusion
We found that, across subjects, baseline EtCO2 and ΔEtCO2 inversely influenced the measured CVR values. Therefore, these factors should be taken into account when comparing CVR between groups or patients. However, these inter-subject differences appear to have an independent physiological underpinning, as manipulations of these factors within the subject did not seem to have an effect on the measured CVR values.Acknowledgements
No acknowledgement found.References
1. Bhogal AA, Siero JC, Fisher JA, et al. Investigating the non-linearity of the BOLD cerebrovascular reactivity response to targeted hypo/hypercapnia at 7T. Neuroimage. 2014; 98:296-305..
2. De Vis JB, Hendrikse J, Bhogal A, et al. Age-related changes in brain hemodynamics ; a calibrated MRI study. Hum Brain Mapp. 2015;36(10):3973-87.
3. Fulop M. A guide for predicting arterial CO2 tension in metabolic acidosis. Am J. Nephrol. 1997;17(5):421-4.
Figures