0052
Dynamic measurement of oxygen extraction fraction using a Multiple‑Offset‑Spin‑Echo Echo‑Planar Imaging (MOSE‑EPI) pulse sequence1Center for MRI Research, Peking University, Beijing, China, 2MR Research China, GE Healthcare, Beijing, China
Synopsis
The development of neuroimaging methods to detect functional oxygen extraction fraction (OEF) is crucial for understanding mechanisms of physiologic function and the underlying neuronal activities. However, dynamic measurement of the OEF is currently limited by the long acquisition time. In this study, a novel pulse sequence using a multiple-offset-spin-echo (MOSE) with an echo-planar imaging (EPI) acquisition scheme was developed to improve the temporal resolution of dynamic OEF measurements. A motor task experiment was performed for ten subjects. The OEF activation maps generated through the proposed technique and compared to traditional blood oxygenation level-dependent (BOLD) activation maps.
Purpose
The oxygen extraction fraction (OEF) represents the amount of oxygen that leaves the blood stream to enter surrounding tissues and is thus defined as the ratio of oxygen consumption to oxygen delivery. From a neuroscience perspective, measuring OEF in response to task-based stimulation should enable new advances in the understanding of brain functional architectures and connectivities, due to its close relationship to underlying neuronal activity. However, dynamic measurement of the OEF is currently limited by the long acquisition time1,2. In this work, a novel method named MOSE-EPI is proposed to address this issue. This technique provides a substantial improvement in the temporal resolution for OEF mapping. A motor task functional study was carried out for its verification.Methods
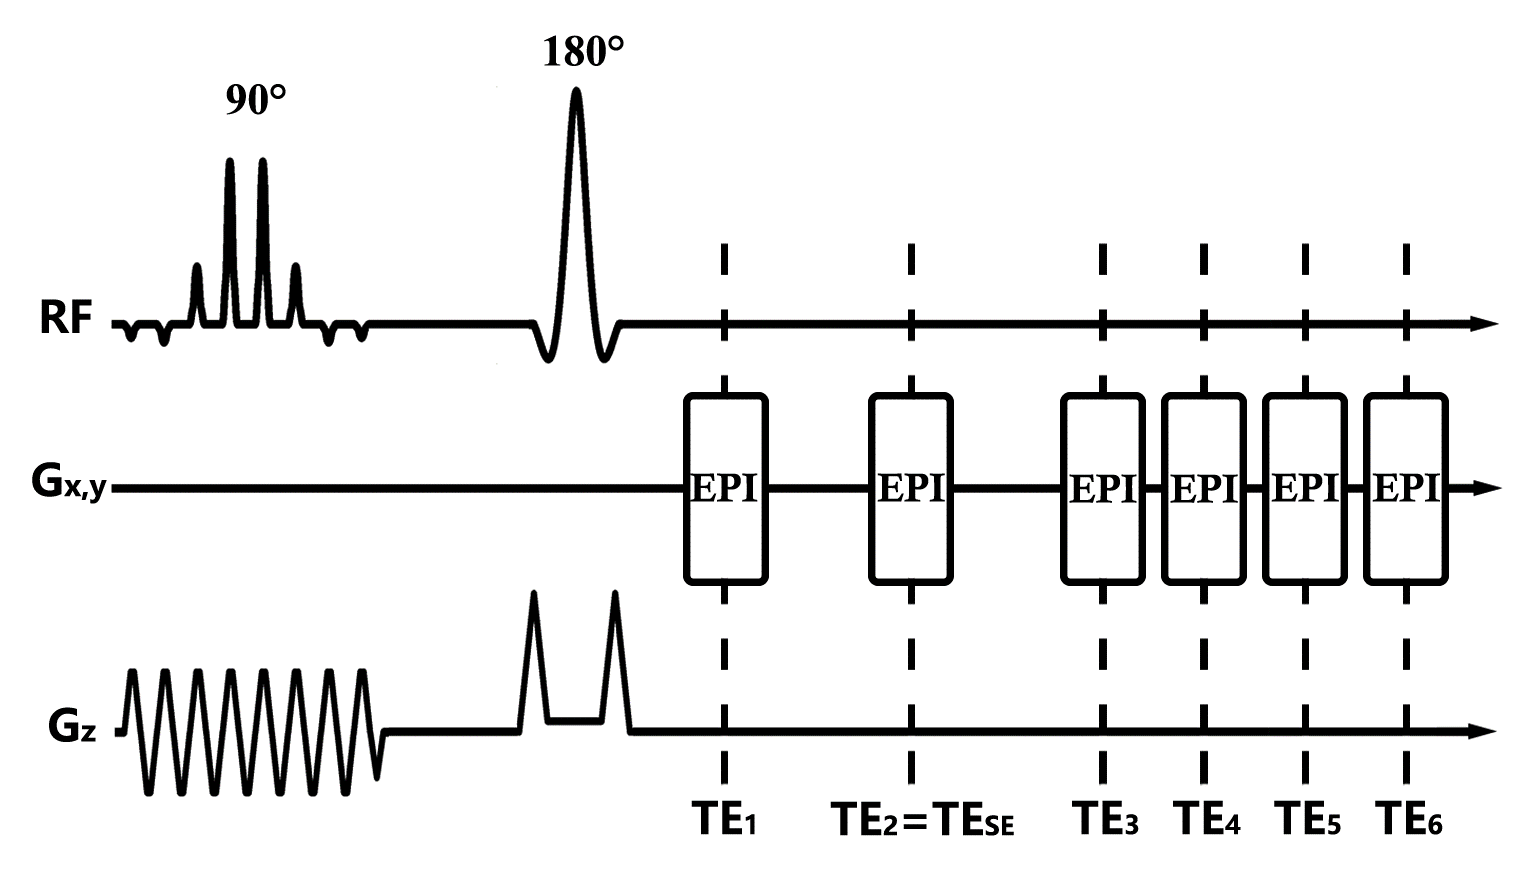
The pulse sequence diagram of MOSE-EPI is shown in Figure.1. ΔTE₁ and ΔTE₂ are defined as the echo spacing, where ΔTE₁= TE₂ – TE₁ = TE₃ – TE₂, ΔTE₂ = TE₄ – TE₃ = TE₅ – TE₄ = TE₆ – TE₅. MRI experiments were performed using a 3.0T whole body GE MR750 scanner. Ten healthy adult subjects (22-28 y) were recruited for a motor task study. The stimulus paradigm consisted of 12 s of dummy scanning and two blocks of a bilateral hand grasp-release task (1 Hz) alternated with three baseline blocks, the period of each block was 30 s.
Two fMRI scans were performed to acquire the OEF and BOLD images during the task. The common fMRI acquisition parameters for both OEF and BOLD were as follows: FOV = 260×260 mm2; voxel size = 4×4×6mm3; TR = 2000 ms; and ten interleaved axial slices without space was acquired. For OEF-fMRI, a MOSE-EPI sequence was used and the scan parameters as follows: SENSE factor = 2; TESE = 100 ms; ΔTE₁= 35 ms; and ΔTE₂ = 12.4 ms. For BOLD-fMRI, a GE EPI with TE = 30 ms was used for data acquisition. 3D T1-weighted images were acquired with TR/TE/FA=6.6 ms/2.9 ms/12°, 1×1×1 mm3.
The first six images were discarded for both scans to ensure that the signal has reached a steady state. Then, all functional data was corrected for motion, co-registered to the 3D T1 anatomical image, and spatially smoothed and normalized to the MNI space. For OEF-fMRI images, R2 was estimated from one pairs of the gradient echo images (the 1st and 3rd echoes) that were acquired symmetrically about the spin echo as: $$R_{2}=ln\left(\begin{array}{c}\frac{S(TE_{SE}-\triangle{TE_{1}})}{S(TE_{SE}+\triangle{TE_{1}})}\end{array}\right)/2\triangle{TE_{1}}$$
Then, the reversible relaxation rate, R2', can be estimated from the last four gradient echo images by: $$S(t)=S_{0}\cdot exp(\lambda)\cdot exp(-R_{2}\cdot t)\cdot exp[-R_{2}^{'}\cdot(t-TE_{SE})]$$
Furthermore, the fractional cerebral venous blood volume (λ) can be obtained from the center of the spin echo signal S(TESE) and extrapolated spin echo signal Sextrapolated(TESE) from Eq.[2] by: $$\lambda=ln\left(\begin{array}{c}\frac{S_{extrapolated}({TE_{SE}})}{S(TE_{SE})}\end{array}\right)$$
then OEF can be calculated by: $$OEF=\frac{R_{2}^{'}}{\lambda\cdot\frac{4}{3}\cdot\pi\cdot\gamma\cdot\triangle\chi_{0}\cdot Hct\cdot B_{0}}$$
where γ is the gyromagnetic ration; Hct is the fractional hematocrit, a constant Hct of 0.3573 was employed for all subjects; Δχ0 is the susceptibility difference between the fully oxygenated and fully deoxygenated blood, which has been measured to be 0.18 ppm per unit Hct4.
The activation maps for OEF and BOLD were generated using a general linear model with a voxel-level threshold of P < 0.001 and a cluster-level FWE correction of P < 0.05. Only common activation areas that passed the statistically significant threshold for OEF and BOLD maps in the primary motor cortex was used for calculating the relative changes in the OEF (δOEF) and BOLD (δBOLD), respectively. The average magnitude of the δOEF (mδOEF) and δBOLD (mδBOLD) were computed by averaging the values of δOEF and δBOLD during the task blocks, respectively.
Results
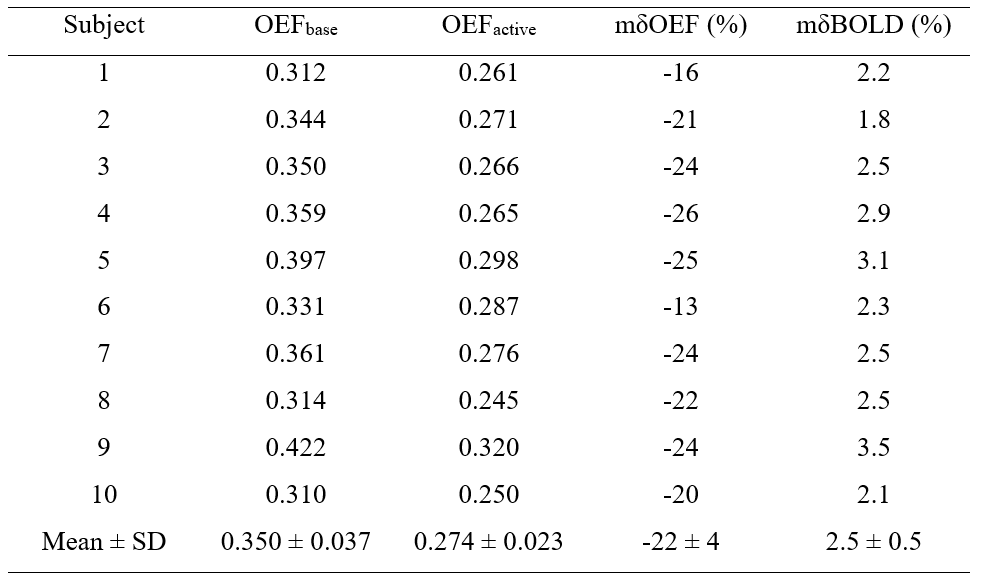
The activation maps for the OEF and BOLD all revealed significant changes during the motor task, and the activation maps of a typical subject is shown in Figure.2 (seven slices are shown). The OEFbase, OEFactive, mδOEF and mδBOLD results for all volunteers are summarized in Table 1, and their values are (mean ± SD) 0.350 ± 0.037, 0.274 ± 0.023, -22% ± 4% and 2.5% ± 0.5%, respectively.Discussion and conclusion
In this work, a novel method termed MOSE-EPI that acquires the voxel wise relative changes of OEF during functional challenges was proposed and tested in a volunteer study. Both baseline and relative changes of OEF fall within the expected physiological range and are comparable with previous reports5,6. Due to its short scan time, it might be a highly potential method to assess the OEF in functional studies.Acknowledgements
No acknowledgement found.References
1: He X, Yablonskiy DA. Quantitative BOLD: mapping of human cerebral deoxygenated blood volume and oxygen extraction fraction: default state. Magnetic Resonance in Medicine 2007;57(1):115-126.
2: An H, Lin W. Quantitative measurements of cerebral blood oxygen saturation using magnetic resonance imaging. Journal of Cerebral Blood Flow & Metabolism 2000;20(8):1225-1236.
3: Eichling JO, Raichle ME, Grubb RL Jr, Larson KB, Ter-Pogossian MM. In vivo determination of cerebral blood volume with radioactive oxygen-15 in the monkey. Circulation Research. 1975; 37:707–714.
4: Weisskoff RM, Kiihne S. MRI susceptometry: image-based measurement of absolute susceptibility of MR contrast agents and human blood. Magnetic Resonance in Medicine. 1992; 24:375–383.
5: Gauthier CJ, Hoge RD. Magnetic resonance imaging of resting OEF and CMRO 2 using a generalized calibration model for hypercapnia and hyperoxia. Neuroimage 2012;60(2):1212-1225.
6: Ito H, Ibaraki M, Takuwa H, Kawaguchi H, Masamoto K, Ikoma Y, Seki C, Kanno I. Changes in effective diffusivity for oxygen in the capillary bed during neural activation and deactivation measured by PET. Journal of Nuclear Medicine 2013;54(supplement 2):1813-1813.
Figures