0050
The potential for gas-free measurements of absolute oxygen metabolism during both baseline and activation states in the human brain1Neurosciences Graduate Program, Medical Scientist Training Program, University of California, San Diego, La Jolla, CA, United States, 2Center for Functional MRI, University of California, San Diego, La Jolla, CA, United States, 3Radiology, Stanford University, Stanford, CA, United States, 4Radiation Medicine and Applied Sciences, University of California, San Diego, La Jolla, CA, United States, 5Psychiatry, Center for Human Development, University of California, San Diego, La Jolla, CA, United States, 6Radiology, University of California, San Diego, La Jolla, CA, United States
Synopsis
We tested noninvasive methods to measure absolute oxygen metabolism (CMRO2) in both baseline and activation states without the use of special gases: VSEAN to measure baseline O2 extraction fraction (OEF), and FLAIR-GESSE to measure R2’ to estimate the scaling parameter M. Primary findings were: M derived from R2’ had less variation across subjects compared to hypercapnia-derived M; OEF values were in good agreement with previous PET findings; and, variation of baseline CBF/CMRO2 coupling across subjects does not follow activation coupling, suggesting different mechanisms may be involved. These results support the potential of gas-free methods for quantitative physiological measurements.
Introduction
While methods for measuring cerebral blood flow (CBF) and blood-oxygen-level dependent signal (BOLD) are well established, the cerebral metabolic rate of oxygen (CMRO2) may provide a better measure of neural activity by reflecting the energy cost of that activity, and may potentially provide information on the activity of specific neural populations1,2. Current quantitative fMRI methods based on simultaneous CBF/BOLD measurements during inhalation of CO2 enriched and O2 enriched gases make it possible to measure absolute CMRO2 in both baseline and activation states3,4. However, the need for special gas administration requires complicated experimental setup that limits wider application of these tools to other research and clinical settings. Our goal was to evaluate the combination of two gas-free techniques to make absolute baseline and activation CMRO2 measurements for more widespread applications.Experimental Approach
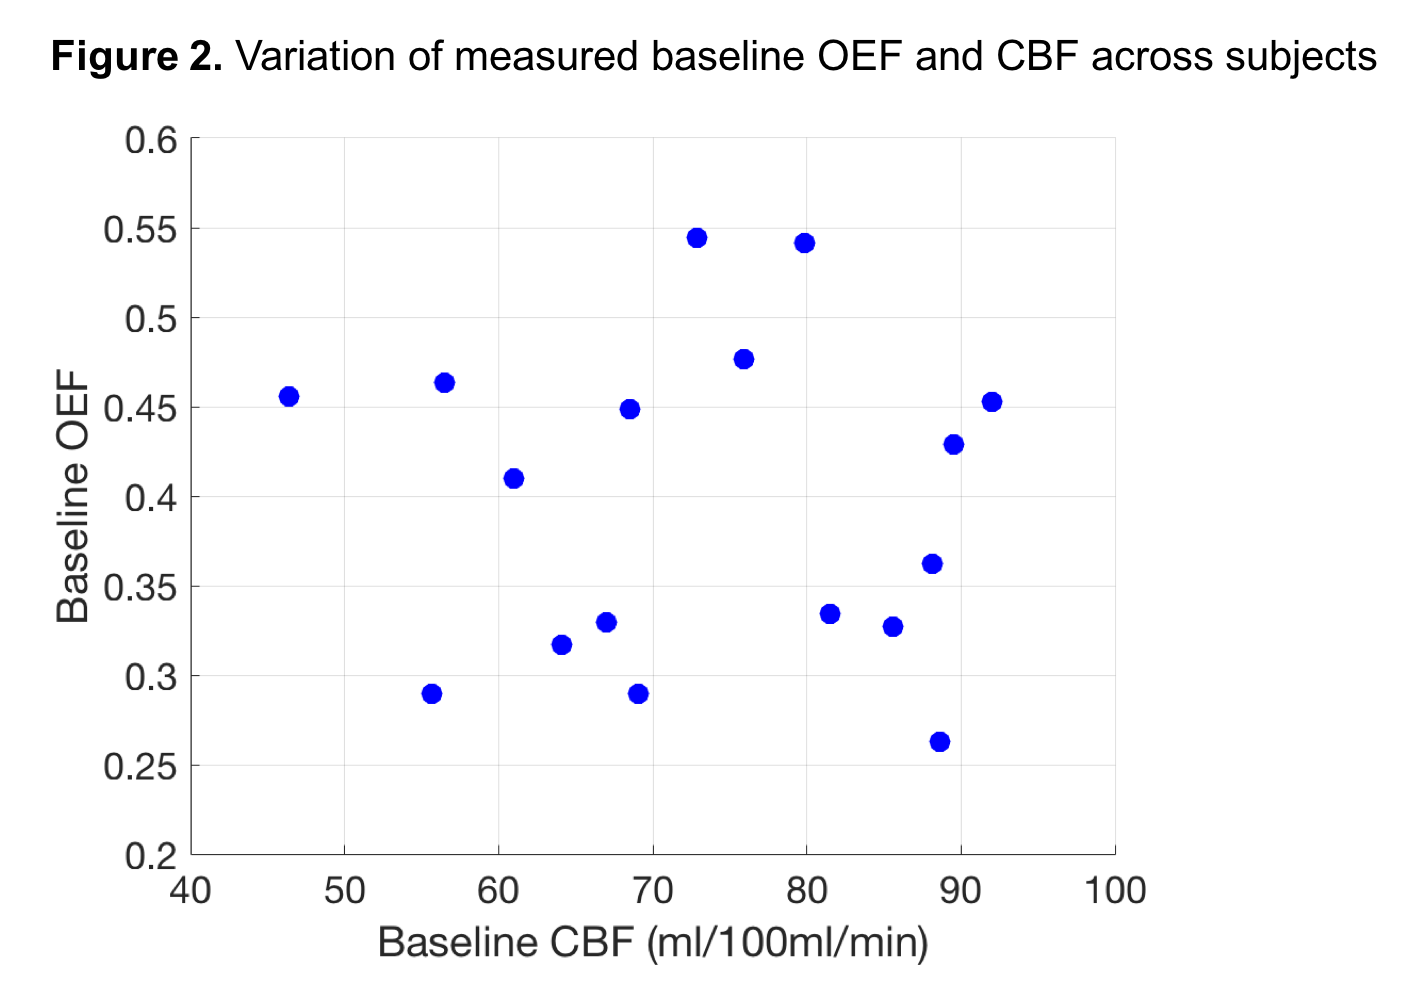
Baseline CMRO2: The baseline CMRO2 measurement is done with Velocity-Selective Excitation and Arterial Nulling (VSEAN)5, which isolates the signal of local venous blood and measures its relaxation rate R2. Because R2 depends primarily on the O2 saturation of hemoglobin, this provides a measurement of the local O2 extraction fraction (OEF), and together with a baseline CBF measurement with ASL yields a measurement of baseline CMRO2.
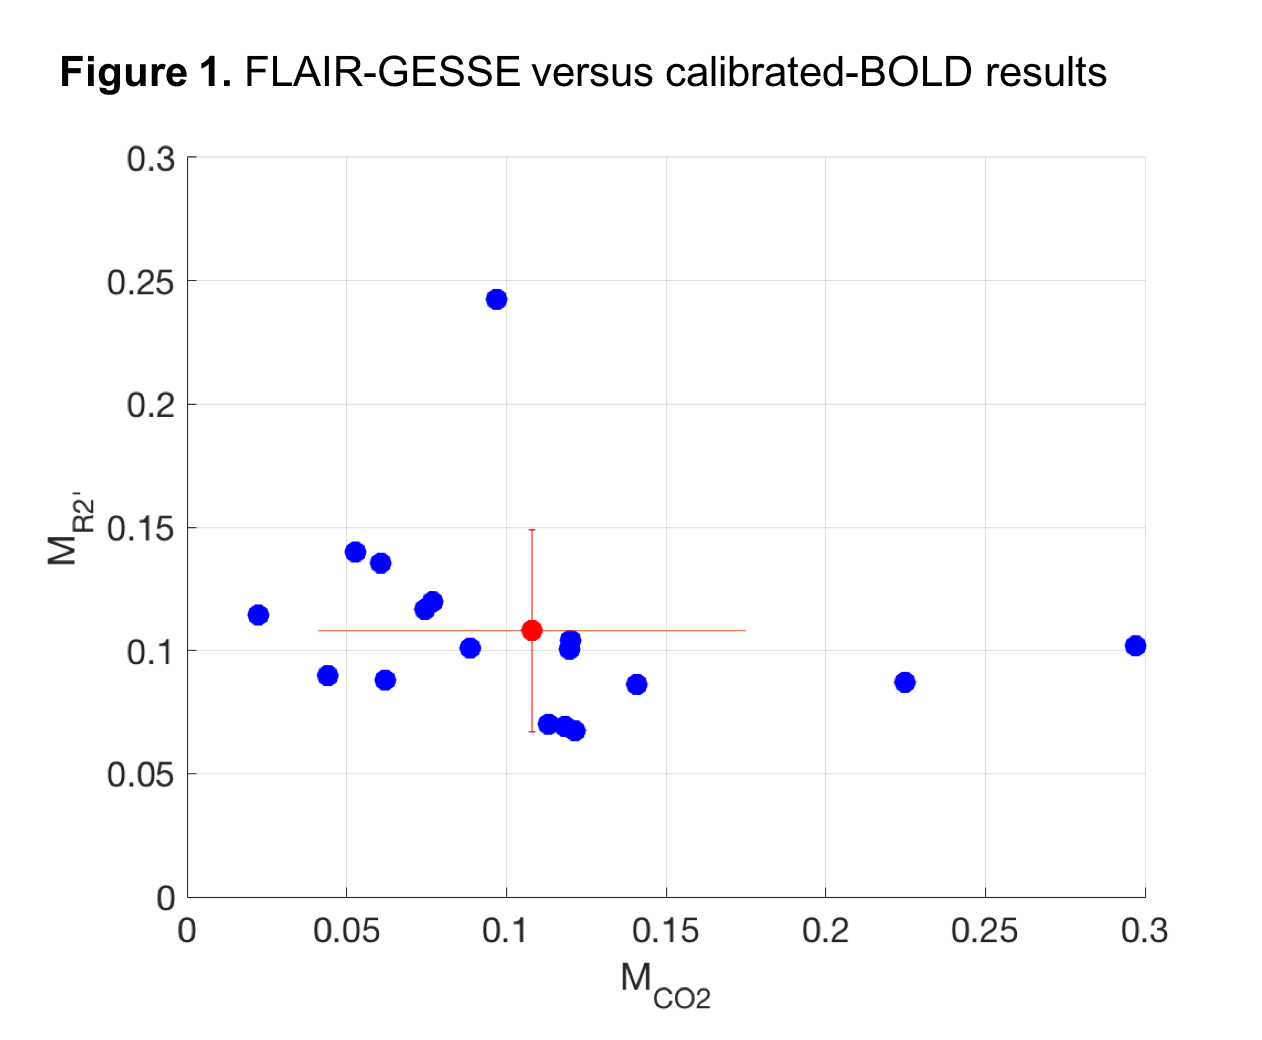
Activation CMRO2: In the classic calibrated-BOLD3 method to measure the fractional change in CMRO2 with activation, the BOLD signal model includes a scaling parameter M that is calculated from a separate measurement of CBF and BOLD responses to a hypercapnia challenge3. Here, we instead use a measurement of R2’, which, like M, reflects the baseline deoxyhemoglobin content of a voxel. We measured R2’ with a FLuid Attenuated Inversion Recovery Gradient Echo Sampling of Spin Echo (FLAIR-GESSE)6 technique, which has an extensive literature building on early work of Yablonskiy and Haacke7. In the ideal case we expect M~TE·R2’, but an empirical scaling factor c is needed to convert R2’ to M in a way that includes all of the effects on the BOLD signal that are difficult to model, such as intravascular signal changes, volume changes, and diffusion effects around small vessels:
$$M_{{R_{2}}'} = TE \times {R_2} ' \times c$$
Experimental Methods
Seventeen subjects (8F/9M) were examined with a dual-echo spiral PICORE QUIPSS II ASL acquisition8 (TR=2.5s, TE1/2=3/30ms, 7 5mm-slices, gap=1mm) to simultaneously measure CBF and BOLD dynamics. Flickering-checkerboard visual stimulus was administered (two blocks, 1-min ON/1-min OFF) while the subject performed a 1-back task presented at the center of the checkerboard as an active baseline throughout the functional run and during the hypercapnia run (5%CO2 in air)3. An activated ROI in visual cortex was identified with a separate functional localizer experiment. VSEAN5 (126reps, one 10mm-slice aligned to center of ASL prescription, TR=3s) and FLAIR-GESSE6 (two scans: TE=63ms/83ms for early/late spin echo series; asymmetrical sampling of decay curves; CSF nulling for middle slice, TR=3.5s, TI=1.16s) were both collected in the baseline state. The total acquisition time for VSEAN and GESSE data was 14 minutes. Post-processing and analysis were performed as previously reported5,6,9,10.Results and Discussion
Table 1 summarizes the physiological measurements in the visual cortex ROI for the 17 subjects. The conversion factor from R2’·TE to M was c=0.994, unexpectedly close to 1 for this data. Primary findings were:
- Calibration data: M derived from R2’ showed much less variance across subjects than M from the hypercapnia experiment (Figure 1), suggesting that R2’ may be a more precise measurement. Excluding the one high value of R2’ as an outlier (>3 std dev), MR2’ ranged from 0.067 to 0.14, while MCO2 ranged from 0.022 to 0.30.
- OEF data: OEF measurements from VSEAN (Figure 2) demonstrate values in good agreement with PET literature11,12. There was no correlation of OEF with baseline CBF.
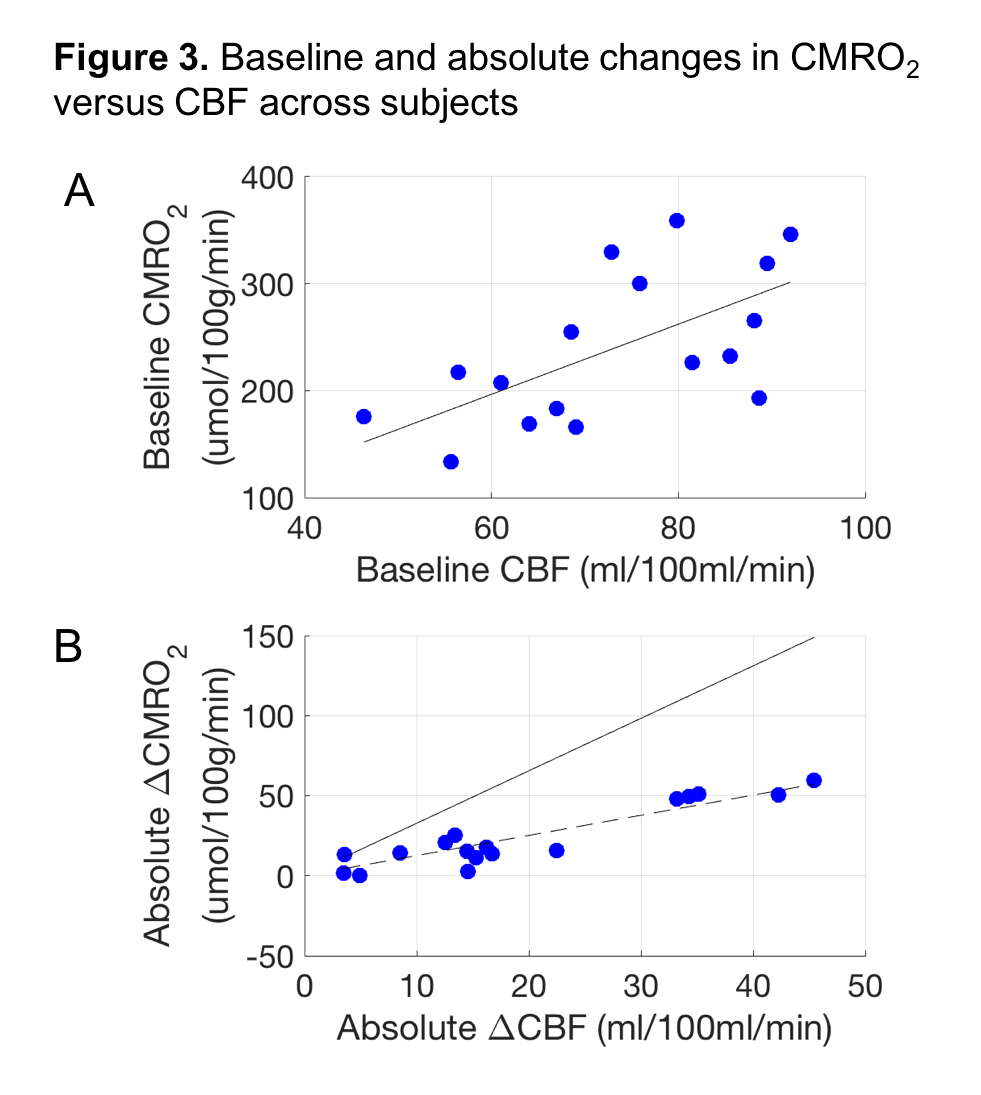
- CBF/CMRO2 coupling: The slope of absolute CBF and CMRO2 was distinctly different for variations in the baseline values and variations in the activation values (Figure 3). This suggests that variations in the baseline state are not simply variations of the “activation level” at rest for different subjects, but instead may be set by different physiological mechanisms.
Conclusions
These results demonstrate the potential for making absolute CMRO2 measurements without requiring the subject to breathe special gases. However, work is still needed to refine these methods and establish their validity. Each method has its own challenges: for VSEAN, low SNR of the isolated blood signal for some voxels, and for FLAIR-GESSE, excessive field distortion near edges. Nevertheless, these results support the feasibility of painting a more complete picture of brain physiology, in absolute terms, during both baseline and activation states, with the potential of providing a deeper probe of neural activity.Acknowledgements
E. Y. Liu would like to acknowledge and thank Kenny Jackson, Abel Martinez, and Jessica Ho for their help in data acquisition; David Shin and Kun Lu for their advice and expertise with various imaging sequences and analyses; Interfaces Graduate Training Program and the UCSD Medical Scientist Training Program for support and funding. Lastly, the authors would like to acknowledge NIH grant support through NS036722 and NS085478.References
- Uhlirova, H. et al. The roadmap for estimation of cell-type- specific neuronal activity from non- invasive measurements. Proc. R. Soc. London. Ser. B Biol. Sci. (2016). doi:10.1098/rstb.2015.0356
- Uhlirova, H. et al. Cell type specificity of neurovascular coupling in cerebral cortex. Elife 5, (2016).
- Davis, T. L., Kwong, K. K., Weisskoff, R. M. & Rosen, B. R. Calibrated functional MRI: mapping the dynamics of oxidative metabolism. Proc. Natl. Acad. Sci. U. S. A. 95, 1834–1839 (1998).
- Wise, R. G., Harris, A. D., Stone, A. J. & Murphy, K. Measurement of OEF and absolute CMRO2: MRI-based methods using interleaved and combined hypercapnia and hyperoxia. Neuroimage 83, 135–147 (2013).
- Guo, J. & Wong, E. C. Venous oxygenation mapping using velocity-selective excitation and arterial nulling. Magn. Reson. Med. 68, 1458–1471 (2012).
- Simon, A. B., Dubowitz, D. J., Blockley, N. P. & Buxton, R. B. A novel Bayesian approach to accounting for uncertainty in fMRI-derived estimates of cerebral oxygen metabolism fluctuations. Neuroimage 129, 198–213 (2016).
- Yablonskiy, D. A. & Haacke, E. M. An MRI method for measuring T2 in the presence of static and RF magnetic field inhomogeneities. Magn. Reson. Med. 37, 872–876 (1997).
- Wong, E. C., Buxton, R. B. & Frank, L. R. Quantitative imaging of perfusion using a single subtraction (QUIPSS and QUIPSS II). Magn. Reson. Med. 39, 702–708 (1998).
- Griffeth, V. E. M., Blockley, N., Simon, A. B. & Buxton, R. B. A New Functional MRI Approach for Investigating Modulations of Brain Oxygen Metabolism. PLoS One 8, e68122 (2013).
- Simon, A. B. & Buxton, R. B. Understanding the dynamic relationship between cerebral blood flow and the BOLD signal: Implications for quantitative functional MRI. Neuroimage 116, 158–167 (2015).
- Ibaraki, M. et al. Quantification of cerebral blood flow and oxygen metabolism with 3-dimensional PET and 15O: validation by comparison with 2-dimensional PET. J. Nucl. Med. 49, 50–9 (2008).
- Ishii, K. et al. Regional difference in cerebral blood flow and oxidative metabolism in human cortex. J Nucl Med 37, 1086–1088 (1996).
- Mintun, M. a, Raichle, M. E., Martin, W. R. & Herscovitch, P. Brain oxygen utilization measured with O-15 radiotracers and positron emission tomography. J. Nucl. Med. 25, 177–187 (1984).
- Xu, F., Ge, Y. & Lu, H. Non-invasive Quantification of Whole-brain Cerebral Metabolic Rate of Oxygen by MRI. Magn. Reson. Med. 62, 141–148 (2009).
Figures